

Key Insights
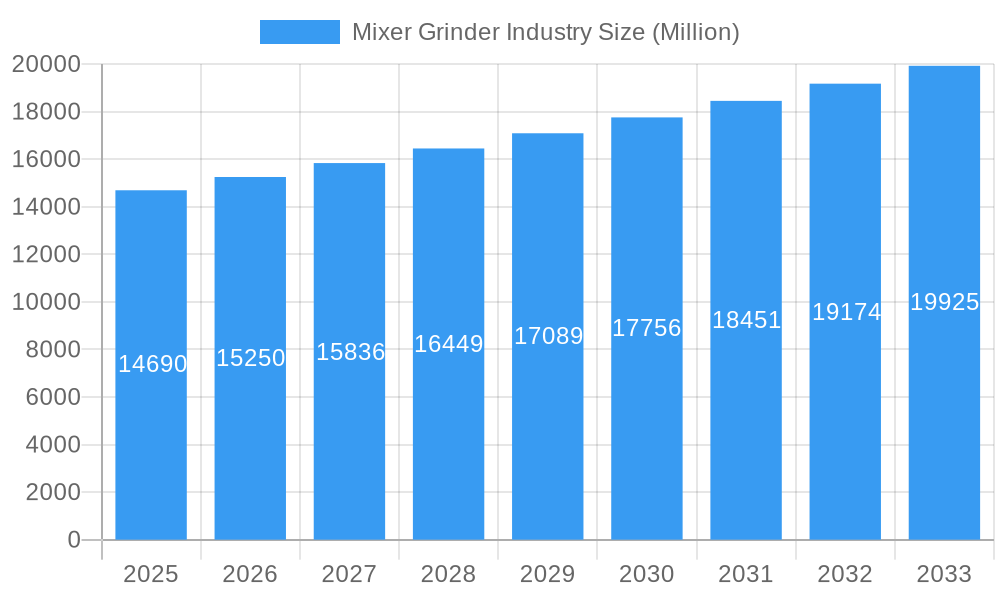
The global mixer grinder market, valued at $14.69 billion in 2025, is projected to experience steady growth, driven by increasing urbanization, changing lifestyles, and rising disposable incomes, particularly in developing economies. The market's Compound Annual Growth Rate (CAGR) of 3.71% from 2019 to 2024 suggests a consistent demand for these appliances. Key growth drivers include the increasing preference for convenient and time-saving kitchen solutions, the rising popularity of healthy eating and homemade food, and the expanding e-commerce sector facilitating easy access to a wide range of models. Stand mixers are expected to remain a significant segment, capturing a larger market share compared to traditional mixers due to their versatility and ability to perform a wider range of tasks beyond simple blending. The distribution channel analysis shows a strong presence of multi-brand stores and a growing contribution from online sales, reflecting the changing consumer purchasing habits. Competitive pressures are evident with major players like Panasonic, Whirlpool, LG, and others vying for market share through product innovation, strategic partnerships, and aggressive marketing. Geographic expansion, focusing on emerging markets in Asia-Pacific and South America, presents lucrative opportunities for market expansion.
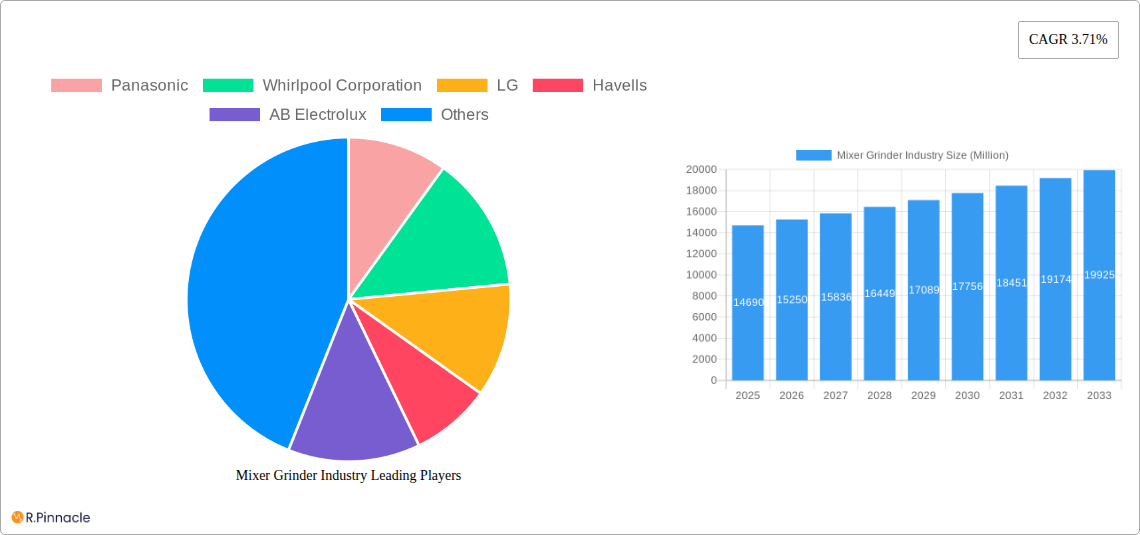
Mixer Grinder Industry Market Size (In Billion)
Despite the positive growth outlook, the market faces certain challenges. Price fluctuations in raw materials and increasing competition could impact profit margins. Consumer preference shifts towards newer kitchen technologies may also pose a challenge to traditional mixer grinder models. To mitigate these restraints, manufacturers are investing in energy-efficient models, innovative features, and enhanced product design to attract a broader consumer base and maintain a competitive edge. Moreover, strategic collaborations with retailers and effective marketing strategies are crucial for brand building and market penetration. The forecast period of 2025-2033 indicates continued expansion, with potential for accelerated growth driven by technological advancements and shifting consumer preferences within specific geographic regions.
Mixer Grinder Industry Company Market Share
Mixer Grinder Industry: A Comprehensive Market Report (2019-2033)
This in-depth report provides a comprehensive analysis of the global mixer grinder industry, covering the period 2019-2033. It delves into market dynamics, competitive landscapes, technological advancements, and future growth projections, offering actionable insights for industry professionals, investors, and stakeholders. With a focus on key players like Panasonic, Whirlpool Corporation, LG, Havells, AB Electrolux, Bosch Global, Philips, Samsung, Haier Inc, and Morphy Richards, this report offers a granular understanding of this dynamic market. The report's base year is 2025, with estimations for 2025 and forecasts spanning 2025-2033. The historical period analyzed is 2019-2024.
Mixer Grinder Industry Market Structure & Innovation Trends
This section analyzes the competitive landscape of the mixer grinder industry, including market concentration, innovation drivers, regulatory frameworks, product substitutes, end-user demographics, and mergers & acquisitions (M&A) activities. The global mixer grinder market size was valued at approximately $XX Million in 2024 and is projected to reach $XX Million by 2033.
- Market Concentration: The market exhibits a moderately concentrated structure, with the top 10 players holding an estimated XX% market share in 2024. Further detailed analysis of market share for each company is provided within the full report.
- Innovation Drivers: Growing demand for convenient kitchen appliances, technological advancements (e.g., improved motor technology, enhanced safety features), and increasing disposable incomes are key innovation drivers.
- Regulatory Frameworks: Compliance with safety and energy efficiency standards influences product design and manufacturing. Variations in regulations across different regions are highlighted.
- Product Substitutes: Other food processing appliances, such as blenders and food processors, pose some level of substitution threat.
- End-User Demographics: The primary end-user demographic comprises households with rising disposable income and a preference for convenience, specifically targeting women.
- M&A Activities: Significant M&A activity includes the acquisition of TSI Semiconductors by Bosch in 2023 and the acquisition of Tosei Corporation by Electrolux Professional in December 2023 for USD 161.20 Million. These deals have implications for market consolidation and technological advancements. The report analyzes the impact of these transactions and other relevant M&A activities on market dynamics and share valuations.
Mixer Grinder Industry Market Dynamics & Trends
This section explores the key market dynamics and trends influencing the mixer grinder industry. This includes analysis of market growth drivers, technological disruptions, evolving consumer preferences, and competitive dynamics. The report provides detailed information regarding the compound annual growth rate (CAGR) and market penetration. The market is driven by factors such as increased urbanization, rising disposable incomes, and changing lifestyles. Further, consumer preference trends towards premium quality appliances, energy-efficient models, and stylish designs are shaping the market landscape. Technological advancements like improved motor technology, multiple speed settings, and safety features contribute to a premium pricing market sector.
Dominant Regions & Segments in Mixer Grinder Industry
This section identifies the leading regions, countries, and segments within the mixer grinder industry. Analysis considers end-user (residential and commercial), product type (stand and traditional mixers), and distribution channels (multi-brand stores, exclusive stores, online stores, and other channels).
- Leading Regions: [Specific region will be detailed in the full report] dominates due to factors such as [reasons for dominance, e.g., high disposable income, robust infrastructure, supportive government policies].
- Leading Segments: The residential segment is currently the largest, driven by increasing household penetration of mixer grinders. Within product types, Traditional Mixer holds a larger market share due to price sensitivity. Online sales channels are showing significant growth due to increasing e-commerce penetration.
Key Drivers in Leading Regions (Bullet Points):
- High disposable incomes
- Growing urbanization
- Favorable demographic trends
- Government initiatives promoting kitchen appliance adoption
Mixer Grinder Industry Product Innovations
The mixer grinder industry witnesses continuous innovation, encompassing enhancements in motor technology, design aesthetics, and safety features. Smart features, such as app connectivity and pre-programmed settings, are gaining traction. These improvements cater to evolving consumer preferences for convenience and efficiency, creating competitive advantages for companies that embrace technological advancements and effectively market product benefits to consumers.
Report Scope & Segmentation Analysis
This report segments the mixer grinder market across various parameters:
- End-User: Residential and Commercial segments. Growth in each segment is analyzed, taking into consideration their specific demand drivers. Competitive dynamics within each segment are also outlined.
- Product Type: Stand mixers and Traditional mixers; market share and growth projections are detailed.
- Distribution Channel: Multi-brand stores, exclusive stores, online stores, and other channels are examined for their market share, growth potential, and challenges.
Key Drivers of Mixer Grinder Industry Growth
The mixer grinder industry's growth is fueled by several factors: rising disposable incomes in emerging economies, increasing urbanization leading to smaller kitchen spaces and a preference for compact appliances, and the growing popularity of convenient and quick food preparation methods. Technological advancements, such as improved motor technology and enhanced safety features, also contribute to market expansion. Government initiatives promoting energy-efficient appliances further stimulate market growth.
Challenges in the Mixer Grinder Industry Sector
The industry faces challenges, including intense competition, fluctuating raw material prices impacting production costs, and stringent regulatory requirements concerning safety and energy efficiency. Supply chain disruptions can also impact production and delivery timelines. These factors necessitate efficient cost management and agile supply chain strategies for companies operating in this sector.
Emerging Opportunities in Mixer Grinder Industry
Emerging opportunities lie in expanding into new markets, particularly in developing economies with rising disposable incomes. The increasing demand for smart appliances with app connectivity and pre-programmed settings presents a significant opportunity for innovation. Sustainable and eco-friendly products are gaining increasing importance as consumer preferences are being shaped by environmental concerns.
Leading Players in the Mixer Grinder Industry Market
- Panasonic
- Whirlpool Corporation
- LG
- Havells
- AB Electrolux
- Bosch Global
- Philips
- Samsung
- Haier Inc
- Morphy Richards
Key Developments in Mixer Grinder Industry
- April 2023: Bosch announced plans to acquire TSI Semiconductors.
- August 2023: Bosch finalized the acquisition of TSI Semiconductors, forming Robert Bosch Semiconductor LLC.
- December 2023: Electrolux Professional completed the acquisition of Tosei Corporation for USD 161.20 Million.
Future Outlook for Mixer Grinder Industry Market
The mixer grinder industry is poised for continued growth, driven by increasing demand in emerging markets, technological advancements, and evolving consumer preferences. Strategic partnerships, product diversification, and effective marketing will be crucial for companies to capitalize on future market opportunities and maintain a competitive edge.
Mixer Grinder Industry Segmentation
-
1. Product Type
- 1.1. Stand Mixer
- 1.2. Traditional Mixer
-
2. Distribution Channel
- 2.1. Multi-brands Stores
- 2.2. Exclusive Stores
- 2.3. Online Stores
- 2.4. Other Distribution Channels
-
3. End User
- 3.1. Residential
- 3.2. Commercial
Mixer Grinder Industry Segmentation By Geography
- 1. North America
- 2. Europe
- 3. Asia Pacific
- 4. Latin America
- 5. Middle East and Africa
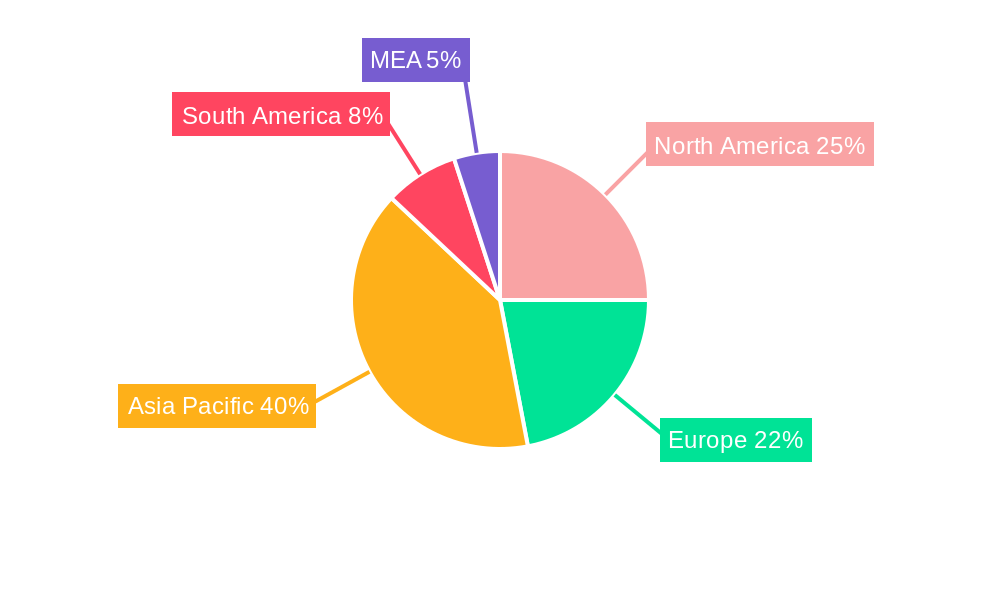
Mixer Grinder Industry Regional Market Share
Geographic Coverage of Mixer Grinder Industry
Mixer Grinder Industry REPORT HIGHLIGHTS
| Aspects | Details |
|---|---|
| Study Period | 2020-2034 |
| Base Year | 2025 |
| Estimated Year | 2026 |
| Forecast Period | 2026-2034 |
| Historical Period | 2020-2025 |
| Growth Rate | CAGR of 3.71% from 2020-2034 |
| Segmentation |
|
Table of Contents
- 1. Introduction
- 1.1. Research Scope
- 1.2. Market Segmentation
- 1.3. Research Objective
- 1.4. Definitions and Assumptions
- 2. Executive Summary
- 2.1. Market Snapshot
- 3. Market Dynamics
- 3.1. Market Drivers
- 3.2. Market Restrains
- 3.3. Market Trends
- 3.4. Market Opportunities
- 4. Market Factor Analysis
- 4.1. Porters Five Forces
- 4.1.1. Bargaining Power of Suppliers
- 4.1.2. Bargaining Power of Buyers
- 4.1.3. Threat of New Entrants
- 4.1.4. Threat of Substitutes
- 4.1.5. Competitive Rivalry
- 4.2. PESTEL analysis
- 4.3. BCG Analysis
- 4.3.1. Stars (High Growth, High Market Share)
- 4.3.2. Cash Cows (Low Growth, High Market Share)
- 4.3.3. Question Mark (High Growth, Low Market Share)
- 4.3.4. Dogs (Low Growth, Low Market Share)
- 4.4. Ansoff Matrix Analysis
- 4.5. Supply Chain Analysis
- 4.6. Regulatory Landscape
- 4.7. Current Market Potential and Opportunity Assessment (TAM–SAM–SOM Framework)
- 4.8. PRI Analyst Note
- 4.1. Porters Five Forces
- 5. Market Analysis, Insights and Forecast 2021-2033
- 5.1. Market Analysis, Insights and Forecast - by Product Type
- 5.1.1. Stand Mixer
- 5.1.2. Traditional Mixer
- 5.2. Market Analysis, Insights and Forecast - by Distribution Channel
- 5.2.1. Multi-brands Stores
- 5.2.2. Exclusive Stores
- 5.2.3. Online Stores
- 5.2.4. Other Distribution Channels
- 5.3. Market Analysis, Insights and Forecast - by End User
- 5.3.1. Residential
- 5.3.2. Commercial
- 5.4. Market Analysis, Insights and Forecast - by Region
- 5.4.1. North America
- 5.4.2. Europe
- 5.4.3. Asia Pacific
- 5.4.4. Latin America
- 5.4.5. Middle East and Africa
- 5.1. Market Analysis, Insights and Forecast - by Product Type
- 6. Global Mixer Grinder Industry Analysis, Insights and Forecast, 2021-2033
- 6.1. Market Analysis, Insights and Forecast - by Product Type
- 6.1.1. Stand Mixer
- 6.1.2. Traditional Mixer
- 6.2. Market Analysis, Insights and Forecast - by Distribution Channel
- 6.2.1. Multi-brands Stores
- 6.2.2. Exclusive Stores
- 6.2.3. Online Stores
- 6.2.4. Other Distribution Channels
- 6.3. Market Analysis, Insights and Forecast - by End User
- 6.3.1. Residential
- 6.3.2. Commercial
- 6.1. Market Analysis, Insights and Forecast - by Product Type
- 7. North America Mixer Grinder Industry Analysis, Insights and Forecast, 2020-2032
- 7.1. Market Analysis, Insights and Forecast - by Product Type
- 7.1.1. Stand Mixer
- 7.1.2. Traditional Mixer
- 7.2. Market Analysis, Insights and Forecast - by Distribution Channel
- 7.2.1. Multi-brands Stores
- 7.2.2. Exclusive Stores
- 7.2.3. Online Stores
- 7.2.4. Other Distribution Channels
- 7.3. Market Analysis, Insights and Forecast - by End User
- 7.3.1. Residential
- 7.3.2. Commercial
- 7.1. Market Analysis, Insights and Forecast - by Product Type
- 8. Europe Mixer Grinder Industry Analysis, Insights and Forecast, 2020-2032
- 8.1. Market Analysis, Insights and Forecast - by Product Type
- 8.1.1. Stand Mixer
- 8.1.2. Traditional Mixer
- 8.2. Market Analysis, Insights and Forecast - by Distribution Channel
- 8.2.1. Multi-brands Stores
- 8.2.2. Exclusive Stores
- 8.2.3. Online Stores
- 8.2.4. Other Distribution Channels
- 8.3. Market Analysis, Insights and Forecast - by End User
- 8.3.1. Residential
- 8.3.2. Commercial
- 8.1. Market Analysis, Insights and Forecast - by Product Type
- 9. Asia Pacific Mixer Grinder Industry Analysis, Insights and Forecast, 2020-2032
- 9.1. Market Analysis, Insights and Forecast - by Product Type
- 9.1.1. Stand Mixer
- 9.1.2. Traditional Mixer
- 9.2. Market Analysis, Insights and Forecast - by Distribution Channel
- 9.2.1. Multi-brands Stores
- 9.2.2. Exclusive Stores
- 9.2.3. Online Stores
- 9.2.4. Other Distribution Channels
- 9.3. Market Analysis, Insights and Forecast - by End User
- 9.3.1. Residential
- 9.3.2. Commercial
- 9.1. Market Analysis, Insights and Forecast - by Product Type
- 10. Latin America Mixer Grinder Industry Analysis, Insights and Forecast, 2020-2032
- 10.1. Market Analysis, Insights and Forecast - by Product Type
- 10.1.1. Stand Mixer
- 10.1.2. Traditional Mixer
- 10.2. Market Analysis, Insights and Forecast - by Distribution Channel
- 10.2.1. Multi-brands Stores
- 10.2.2. Exclusive Stores
- 10.2.3. Online Stores
- 10.2.4. Other Distribution Channels
- 10.3. Market Analysis, Insights and Forecast - by End User
- 10.3.1. Residential
- 10.3.2. Commercial
- 10.1. Market Analysis, Insights and Forecast - by Product Type
- 11. Middle East and Africa Mixer Grinder Industry Analysis, Insights and Forecast, 2020-2032
- 11.1. Market Analysis, Insights and Forecast - by Product Type
- 11.1.1. Stand Mixer
- 11.1.2. Traditional Mixer
- 11.2. Market Analysis, Insights and Forecast - by Distribution Channel
- 11.2.1. Multi-brands Stores
- 11.2.2. Exclusive Stores
- 11.2.3. Online Stores
- 11.2.4. Other Distribution Channels
- 11.3. Market Analysis, Insights and Forecast - by End User
- 11.3.1. Residential
- 11.3.2. Commercial
- 11.1. Market Analysis, Insights and Forecast - by Product Type
- 12. Competitive Analysis
- 12.1. Company Profiles
- 12.1.1 Panasonic
- 12.1.1.1. Company Overview
- 12.1.1.2. Products
- 12.1.1.3. Company Financials
- 12.1.1.4. SWOT Analysis
- 12.1.2 Whirlpool Corporation
- 12.1.2.1. Company Overview
- 12.1.2.2. Products
- 12.1.2.3. Company Financials
- 12.1.2.4. SWOT Analysis
- 12.1.3 LG
- 12.1.3.1. Company Overview
- 12.1.3.2. Products
- 12.1.3.3. Company Financials
- 12.1.3.4. SWOT Analysis
- 12.1.4 Havells
- 12.1.4.1. Company Overview
- 12.1.4.2. Products
- 12.1.4.3. Company Financials
- 12.1.4.4. SWOT Analysis
- 12.1.5 AB Electrolux
- 12.1.5.1. Company Overview
- 12.1.5.2. Products
- 12.1.5.3. Company Financials
- 12.1.5.4. SWOT Analysis
- 12.1.6 Bosch Global
- 12.1.6.1. Company Overview
- 12.1.6.2. Products
- 12.1.6.3. Company Financials
- 12.1.6.4. SWOT Analysis
- 12.1.7 Philips
- 12.1.7.1. Company Overview
- 12.1.7.2. Products
- 12.1.7.3. Company Financials
- 12.1.7.4. SWOT Analysis
- 12.1.8 Samsung
- 12.1.8.1. Company Overview
- 12.1.8.2. Products
- 12.1.8.3. Company Financials
- 12.1.8.4. SWOT Analysis
- 12.1.9 Haier Inc
- 12.1.9.1. Company Overview
- 12.1.9.2. Products
- 12.1.9.3. Company Financials
- 12.1.9.4. SWOT Analysis
- 12.1.10 Morphy Richards
- 12.1.10.1. Company Overview
- 12.1.10.2. Products
- 12.1.10.3. Company Financials
- 12.1.10.4. SWOT Analysis
- 12.1.1 Panasonic
- 12.2. Market Entropy
- 12.2.1 Company's Key Areas Served
- 12.2.2 Recent Developments
- 12.3. Company Market Share Analysis 2025
- 12.3.1 Top 5 Companies Market Share Analysis
- 12.3.2 Top 3 Companies Market Share Analysis
- 12.4. List of Potential Customers
- 13. Research Methodology
List of Figures
- Figure 1: Global Mixer Grinder Industry Revenue Breakdown (Million, %) by Region 2025 & 2033
- Figure 2: Global Mixer Grinder Industry Volume Breakdown (K Unit, %) by Region 2025 & 2033
- Figure 3: North America Mixer Grinder Industry Revenue (Million), by Product Type 2025 & 2033
- Figure 4: North America Mixer Grinder Industry Volume (K Unit), by Product Type 2025 & 2033
- Figure 5: North America Mixer Grinder Industry Revenue Share (%), by Product Type 2025 & 2033
- Figure 6: North America Mixer Grinder Industry Volume Share (%), by Product Type 2025 & 2033
- Figure 7: North America Mixer Grinder Industry Revenue (Million), by Distribution Channel 2025 & 2033
- Figure 8: North America Mixer Grinder Industry Volume (K Unit), by Distribution Channel 2025 & 2033
- Figure 9: North America Mixer Grinder Industry Revenue Share (%), by Distribution Channel 2025 & 2033
- Figure 10: North America Mixer Grinder Industry Volume Share (%), by Distribution Channel 2025 & 2033
- Figure 11: North America Mixer Grinder Industry Revenue (Million), by End User 2025 & 2033
- Figure 12: North America Mixer Grinder Industry Volume (K Unit), by End User 2025 & 2033
- Figure 13: North America Mixer Grinder Industry Revenue Share (%), by End User 2025 & 2033
- Figure 14: North America Mixer Grinder Industry Volume Share (%), by End User 2025 & 2033
- Figure 15: North America Mixer Grinder Industry Revenue (Million), by Country 2025 & 2033
- Figure 16: North America Mixer Grinder Industry Volume (K Unit), by Country 2025 & 2033
- Figure 17: North America Mixer Grinder Industry Revenue Share (%), by Country 2025 & 2033
- Figure 18: North America Mixer Grinder Industry Volume Share (%), by Country 2025 & 2033
- Figure 19: Europe Mixer Grinder Industry Revenue (Million), by Product Type 2025 & 2033
- Figure 20: Europe Mixer Grinder Industry Volume (K Unit), by Product Type 2025 & 2033
- Figure 21: Europe Mixer Grinder Industry Revenue Share (%), by Product Type 2025 & 2033
- Figure 22: Europe Mixer Grinder Industry Volume Share (%), by Product Type 2025 & 2033
- Figure 23: Europe Mixer Grinder Industry Revenue (Million), by Distribution Channel 2025 & 2033
- Figure 24: Europe Mixer Grinder Industry Volume (K Unit), by Distribution Channel 2025 & 2033
- Figure 25: Europe Mixer Grinder Industry Revenue Share (%), by Distribution Channel 2025 & 2033
- Figure 26: Europe Mixer Grinder Industry Volume Share (%), by Distribution Channel 2025 & 2033
- Figure 27: Europe Mixer Grinder Industry Revenue (Million), by End User 2025 & 2033
- Figure 28: Europe Mixer Grinder Industry Volume (K Unit), by End User 2025 & 2033
- Figure 29: Europe Mixer Grinder Industry Revenue Share (%), by End User 2025 & 2033
- Figure 30: Europe Mixer Grinder Industry Volume Share (%), by End User 2025 & 2033
- Figure 31: Europe Mixer Grinder Industry Revenue (Million), by Country 2025 & 2033
- Figure 32: Europe Mixer Grinder Industry Volume (K Unit), by Country 2025 & 2033
- Figure 33: Europe Mixer Grinder Industry Revenue Share (%), by Country 2025 & 2033
- Figure 34: Europe Mixer Grinder Industry Volume Share (%), by Country 2025 & 2033
- Figure 35: Asia Pacific Mixer Grinder Industry Revenue (Million), by Product Type 2025 & 2033
- Figure 36: Asia Pacific Mixer Grinder Industry Volume (K Unit), by Product Type 2025 & 2033
- Figure 37: Asia Pacific Mixer Grinder Industry Revenue Share (%), by Product Type 2025 & 2033
- Figure 38: Asia Pacific Mixer Grinder Industry Volume Share (%), by Product Type 2025 & 2033
- Figure 39: Asia Pacific Mixer Grinder Industry Revenue (Million), by Distribution Channel 2025 & 2033
- Figure 40: Asia Pacific Mixer Grinder Industry Volume (K Unit), by Distribution Channel 2025 & 2033
- Figure 41: Asia Pacific Mixer Grinder Industry Revenue Share (%), by Distribution Channel 2025 & 2033
- Figure 42: Asia Pacific Mixer Grinder Industry Volume Share (%), by Distribution Channel 2025 & 2033
- Figure 43: Asia Pacific Mixer Grinder Industry Revenue (Million), by End User 2025 & 2033
- Figure 44: Asia Pacific Mixer Grinder Industry Volume (K Unit), by End User 2025 & 2033
- Figure 45: Asia Pacific Mixer Grinder Industry Revenue Share (%), by End User 2025 & 2033
- Figure 46: Asia Pacific Mixer Grinder Industry Volume Share (%), by End User 2025 & 2033
- Figure 47: Asia Pacific Mixer Grinder Industry Revenue (Million), by Country 2025 & 2033
- Figure 48: Asia Pacific Mixer Grinder Industry Volume (K Unit), by Country 2025 & 2033
- Figure 49: Asia Pacific Mixer Grinder Industry Revenue Share (%), by Country 2025 & 2033
- Figure 50: Asia Pacific Mixer Grinder Industry Volume Share (%), by Country 2025 & 2033
- Figure 51: Latin America Mixer Grinder Industry Revenue (Million), by Product Type 2025 & 2033
- Figure 52: Latin America Mixer Grinder Industry Volume (K Unit), by Product Type 2025 & 2033
- Figure 53: Latin America Mixer Grinder Industry Revenue Share (%), by Product Type 2025 & 2033
- Figure 54: Latin America Mixer Grinder Industry Volume Share (%), by Product Type 2025 & 2033
- Figure 55: Latin America Mixer Grinder Industry Revenue (Million), by Distribution Channel 2025 & 2033
- Figure 56: Latin America Mixer Grinder Industry Volume (K Unit), by Distribution Channel 2025 & 2033
- Figure 57: Latin America Mixer Grinder Industry Revenue Share (%), by Distribution Channel 2025 & 2033
- Figure 58: Latin America Mixer Grinder Industry Volume Share (%), by Distribution Channel 2025 & 2033
- Figure 59: Latin America Mixer Grinder Industry Revenue (Million), by End User 2025 & 2033
- Figure 60: Latin America Mixer Grinder Industry Volume (K Unit), by End User 2025 & 2033
- Figure 61: Latin America Mixer Grinder Industry Revenue Share (%), by End User 2025 & 2033
- Figure 62: Latin America Mixer Grinder Industry Volume Share (%), by End User 2025 & 2033
- Figure 63: Latin America Mixer Grinder Industry Revenue (Million), by Country 2025 & 2033
- Figure 64: Latin America Mixer Grinder Industry Volume (K Unit), by Country 2025 & 2033
- Figure 65: Latin America Mixer Grinder Industry Revenue Share (%), by Country 2025 & 2033
- Figure 66: Latin America Mixer Grinder Industry Volume Share (%), by Country 2025 & 2033
- Figure 67: Middle East and Africa Mixer Grinder Industry Revenue (Million), by Product Type 2025 & 2033
- Figure 68: Middle East and Africa Mixer Grinder Industry Volume (K Unit), by Product Type 2025 & 2033
- Figure 69: Middle East and Africa Mixer Grinder Industry Revenue Share (%), by Product Type 2025 & 2033
- Figure 70: Middle East and Africa Mixer Grinder Industry Volume Share (%), by Product Type 2025 & 2033
- Figure 71: Middle East and Africa Mixer Grinder Industry Revenue (Million), by Distribution Channel 2025 & 2033
- Figure 72: Middle East and Africa Mixer Grinder Industry Volume (K Unit), by Distribution Channel 2025 & 2033
- Figure 73: Middle East and Africa Mixer Grinder Industry Revenue Share (%), by Distribution Channel 2025 & 2033
- Figure 74: Middle East and Africa Mixer Grinder Industry Volume Share (%), by Distribution Channel 2025 & 2033
- Figure 75: Middle East and Africa Mixer Grinder Industry Revenue (Million), by End User 2025 & 2033
- Figure 76: Middle East and Africa Mixer Grinder Industry Volume (K Unit), by End User 2025 & 2033
- Figure 77: Middle East and Africa Mixer Grinder Industry Revenue Share (%), by End User 2025 & 2033
- Figure 78: Middle East and Africa Mixer Grinder Industry Volume Share (%), by End User 2025 & 2033
- Figure 79: Middle East and Africa Mixer Grinder Industry Revenue (Million), by Country 2025 & 2033
- Figure 80: Middle East and Africa Mixer Grinder Industry Volume (K Unit), by Country 2025 & 2033
- Figure 81: Middle East and Africa Mixer Grinder Industry Revenue Share (%), by Country 2025 & 2033
- Figure 82: Middle East and Africa Mixer Grinder Industry Volume Share (%), by Country 2025 & 2033
List of Tables
- Table 1: Global Mixer Grinder Industry Revenue Million Forecast, by Product Type 2020 & 2033
- Table 2: Global Mixer Grinder Industry Volume K Unit Forecast, by Product Type 2020 & 2033
- Table 3: Global Mixer Grinder Industry Revenue Million Forecast, by Distribution Channel 2020 & 2033
- Table 4: Global Mixer Grinder Industry Volume K Unit Forecast, by Distribution Channel 2020 & 2033
- Table 5: Global Mixer Grinder Industry Revenue Million Forecast, by End User 2020 & 2033
- Table 6: Global Mixer Grinder Industry Volume K Unit Forecast, by End User 2020 & 2033
- Table 7: Global Mixer Grinder Industry Revenue Million Forecast, by Region 2020 & 2033
- Table 8: Global Mixer Grinder Industry Volume K Unit Forecast, by Region 2020 & 2033
- Table 9: Global Mixer Grinder Industry Revenue Million Forecast, by Product Type 2020 & 2033
- Table 10: Global Mixer Grinder Industry Volume K Unit Forecast, by Product Type 2020 & 2033
- Table 11: Global Mixer Grinder Industry Revenue Million Forecast, by Distribution Channel 2020 & 2033
- Table 12: Global Mixer Grinder Industry Volume K Unit Forecast, by Distribution Channel 2020 & 2033
- Table 13: Global Mixer Grinder Industry Revenue Million Forecast, by End User 2020 & 2033
- Table 14: Global Mixer Grinder Industry Volume K Unit Forecast, by End User 2020 & 2033
- Table 15: Global Mixer Grinder Industry Revenue Million Forecast, by Country 2020 & 2033
- Table 16: Global Mixer Grinder Industry Volume K Unit Forecast, by Country 2020 & 2033
- Table 17: Global Mixer Grinder Industry Revenue Million Forecast, by Product Type 2020 & 2033
- Table 18: Global Mixer Grinder Industry Volume K Unit Forecast, by Product Type 2020 & 2033
- Table 19: Global Mixer Grinder Industry Revenue Million Forecast, by Distribution Channel 2020 & 2033
- Table 20: Global Mixer Grinder Industry Volume K Unit Forecast, by Distribution Channel 2020 & 2033
- Table 21: Global Mixer Grinder Industry Revenue Million Forecast, by End User 2020 & 2033
- Table 22: Global Mixer Grinder Industry Volume K Unit Forecast, by End User 2020 & 2033
- Table 23: Global Mixer Grinder Industry Revenue Million Forecast, by Country 2020 & 2033
- Table 24: Global Mixer Grinder Industry Volume K Unit Forecast, by Country 2020 & 2033
- Table 25: Global Mixer Grinder Industry Revenue Million Forecast, by Product Type 2020 & 2033
- Table 26: Global Mixer Grinder Industry Volume K Unit Forecast, by Product Type 2020 & 2033
- Table 27: Global Mixer Grinder Industry Revenue Million Forecast, by Distribution Channel 2020 & 2033
- Table 28: Global Mixer Grinder Industry Volume K Unit Forecast, by Distribution Channel 2020 & 2033
- Table 29: Global Mixer Grinder Industry Revenue Million Forecast, by End User 2020 & 2033
- Table 30: Global Mixer Grinder Industry Volume K Unit Forecast, by End User 2020 & 2033
- Table 31: Global Mixer Grinder Industry Revenue Million Forecast, by Country 2020 & 2033
- Table 32: Global Mixer Grinder Industry Volume K Unit Forecast, by Country 2020 & 2033
- Table 33: Global Mixer Grinder Industry Revenue Million Forecast, by Product Type 2020 & 2033
- Table 34: Global Mixer Grinder Industry Volume K Unit Forecast, by Product Type 2020 & 2033
- Table 35: Global Mixer Grinder Industry Revenue Million Forecast, by Distribution Channel 2020 & 2033
- Table 36: Global Mixer Grinder Industry Volume K Unit Forecast, by Distribution Channel 2020 & 2033
- Table 37: Global Mixer Grinder Industry Revenue Million Forecast, by End User 2020 & 2033
- Table 38: Global Mixer Grinder Industry Volume K Unit Forecast, by End User 2020 & 2033
- Table 39: Global Mixer Grinder Industry Revenue Million Forecast, by Country 2020 & 2033
- Table 40: Global Mixer Grinder Industry Volume K Unit Forecast, by Country 2020 & 2033
- Table 41: Global Mixer Grinder Industry Revenue Million Forecast, by Product Type 2020 & 2033
- Table 42: Global Mixer Grinder Industry Volume K Unit Forecast, by Product Type 2020 & 2033
- Table 43: Global Mixer Grinder Industry Revenue Million Forecast, by Distribution Channel 2020 & 2033
- Table 44: Global Mixer Grinder Industry Volume K Unit Forecast, by Distribution Channel 2020 & 2033
- Table 45: Global Mixer Grinder Industry Revenue Million Forecast, by End User 2020 & 2033
- Table 46: Global Mixer Grinder Industry Volume K Unit Forecast, by End User 2020 & 2033
- Table 47: Global Mixer Grinder Industry Revenue Million Forecast, by Country 2020 & 2033
- Table 48: Global Mixer Grinder Industry Volume K Unit Forecast, by Country 2020 & 2033
Frequently Asked Questions
1. What is the projected Compound Annual Growth Rate (CAGR) of the Mixer Grinder Industry?
The projected CAGR is approximately 3.71%.
2. Which companies are prominent players in the Mixer Grinder Industry?
Key companies in the market include Panasonic, Whirlpool Corporation, LG, Havells, AB Electrolux, Bosch Global, Philips, Samsung, Haier Inc, Morphy Richards.
3. What are the main segments of the Mixer Grinder Industry?
The market segments include Product Type, Distribution Channel, End User.
4. Can you provide details about the market size?
The market size is estimated to be USD 14.69 Million as of 2022.
5. What are some drivers contributing to market growth?
Increasing Urbanization is Driving the Market; Increase in Usage of Smart Kitchen Appliances is Driving the Market.
6. What are the notable trends driving market growth?
E-commerce Emerges as a Fastest Growing Distribution Channel for Mixer Grinders.
7. Are there any restraints impacting market growth?
High Power Consumption.
8. Can you provide examples of recent developments in the market?
In April 2023, Bosch revealed plans to acquire the assets of TSI Semiconductors, including its Roseville, California campus. The acquisition was finalized on August 31, 2023, and the newly formed company will operate under the name Robert Bosch Semiconductor LLC.
9. What pricing options are available for accessing the report?
Pricing options include single-user, multi-user, and enterprise licenses priced at USD 4750, USD 5250, and USD 8750 respectively.
10. Is the market size provided in terms of value or volume?
The market size is provided in terms of value, measured in Million and volume, measured in K Unit.
11. Are there any specific market keywords associated with the report?
Yes, the market keyword associated with the report is "Mixer Grinder Industry," which aids in identifying and referencing the specific market segment covered.
12. How do I determine which pricing option suits my needs best?
The pricing options vary based on user requirements and access needs. Individual users may opt for single-user licenses, while businesses requiring broader access may choose multi-user or enterprise licenses for cost-effective access to the report.
13. Are there any additional resources or data provided in the Mixer Grinder Industry report?
While the report offers comprehensive insights, it's advisable to review the specific contents or supplementary materials provided to ascertain if additional resources or data are available.
14. How can I stay updated on further developments or reports in the Mixer Grinder Industry?
To stay informed about further developments, trends, and reports in the Mixer Grinder Industry, consider subscribing to industry newsletters, following relevant companies and organizations, or regularly checking reputable industry news sources and publications.
Methodology
Step 1 - Identification of Relevant Samples Size from Population Database


Step 2 - Approaches for Defining Global Market Size (Value, Volume* & Price*)

Note*: In applicable scenarios
Step 3 - Data Sources
Primary Research
- Web Analytics
- Survey Reports
- Research Institute
- Latest Research Reports
- Opinion Leaders
Secondary Research
- Annual Reports
- White Paper
- Latest Press Release
- Industry Association
- Paid Database
- Investor Presentations

Step 4 - Data Triangulation
Involves using different sources of information in order to increase the validity of a study
These sources are likely to be stakeholders in a program - participants, other researchers, program staff, other community members, and so on.
Then we put all data in single framework & apply various statistical tools to find out the dynamic on the market.
During the analysis stage, feedback from the stakeholder groups would be compared to determine areas of agreement as well as areas of divergence