

Key Insights
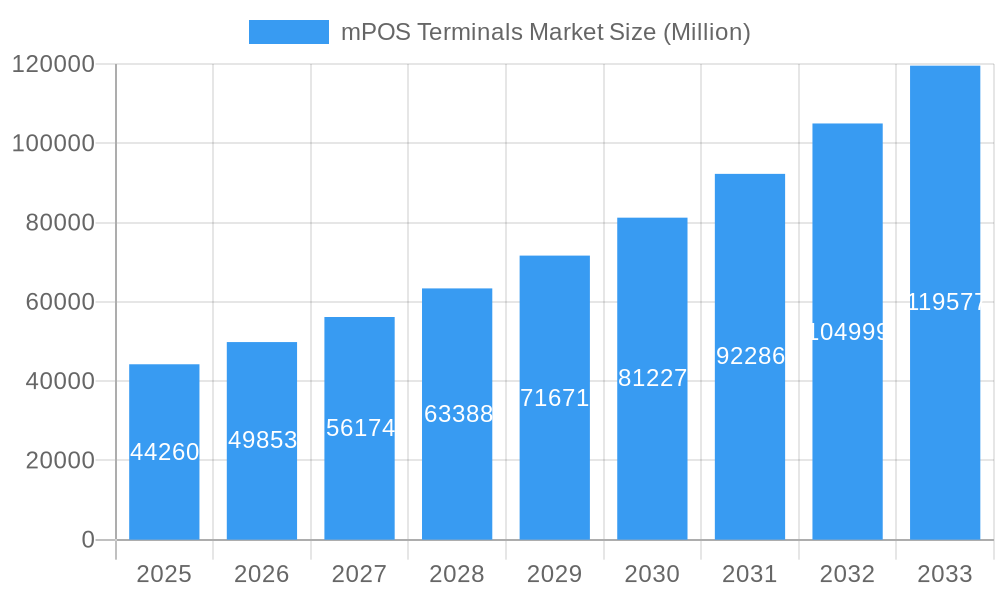
The mPOS (mobile point of sale) terminal market is experiencing robust growth, projected to reach a market size of $44.26 billion in 2025 and exhibiting a Compound Annual Growth Rate (CAGR) of 12.73% from 2025 to 2033. This expansion is fueled by several key drivers. The increasing adoption of digital payment methods by consumers and businesses is a primary catalyst, alongside the rising need for efficient and portable payment solutions for small and medium-sized enterprises (SMEs). Furthermore, the expanding e-commerce sector and the growing preference for contactless payments are significantly contributing to market growth. Technological advancements, such as improved security features and integration with other business software, further enhance the appeal of mPOS terminals. The market is segmented by type (software and services), organization size (SMEs and large enterprises), and end-user industry (BFSI, aerospace and defense, government and legal firms, IT and telecom, healthcare, education, energy and utilities, and others). North America currently holds a significant market share, but the Asia-Pacific region is anticipated to experience substantial growth driven by rapid digitalization and expanding e-commerce penetration in countries like China and India. While challenges such as security concerns and data breaches exist, the overall market outlook remains positive, driven by the continuous evolution of technology and the increasing demand for convenient and secure payment solutions.
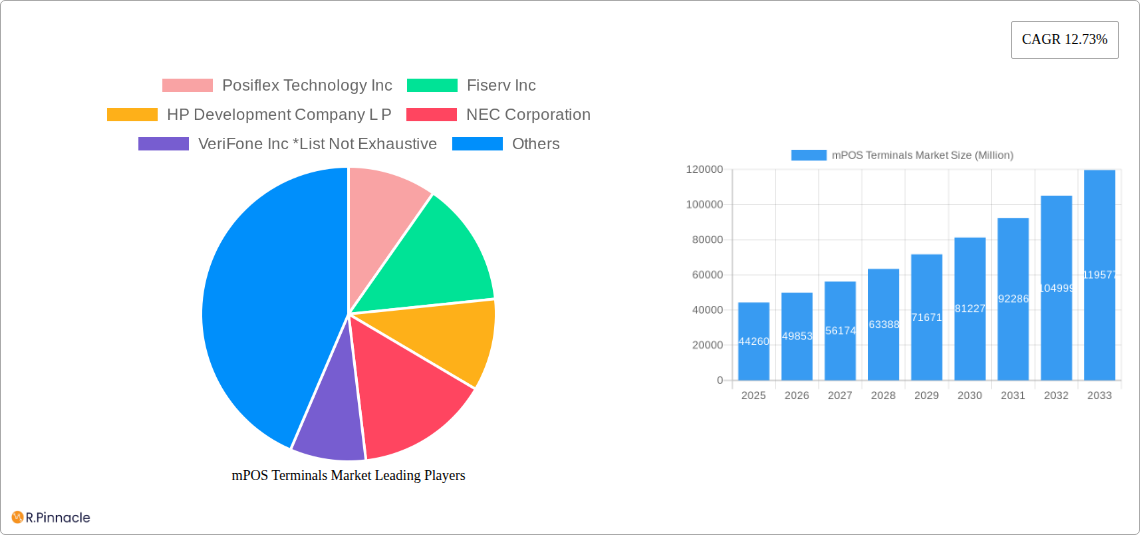
mPOS Terminals Market Market Size (In Billion)
The competitive landscape is characterized by a mix of established players like Posiflex Technology Inc., Fiserv Inc., HP Development Company L.P., NEC Corporation, and VeriFone Inc., alongside emerging companies innovating in features and functionalities. The ongoing development of integrated solutions that seamlessly link mPOS terminals with inventory management, customer relationship management (CRM), and other business applications is driving further market expansion. The market's future trajectory depends on factors such as regulatory changes impacting digital payments, the evolving technological landscape, and the overall economic climate. However, given the persistent trends towards digitalization and the expanding acceptance of mobile payment technologies, the mPOS terminal market is poised for continued significant growth in the coming years.
mPOS Terminals Market Company Market Share
mPOS Terminals Market Report: 2019-2033
This comprehensive report provides a detailed analysis of the mPOS Terminals Market, offering invaluable insights for industry professionals, investors, and strategists. Covering the period from 2019 to 2033, with a focus on 2025, this report unveils the market's structure, dynamics, dominant segments, and future outlook. The report uses a data-driven approach, incorporating market size estimations in Millions, CAGR projections, and analysis of key players such as Posiflex Technology Inc, Fiserv Inc, HP Development Company L P, NEC Corporation, and VeriFone Inc (list not exhaustive), amongst others like SPECTRA Technologies, SAMSUNG ELECTRONICS, PAX Technology, Panasonic Corporation, and Ingenico.
mPOS Terminals Market Structure & Innovation Trends
This section analyzes the competitive landscape of the mPOS terminals market, examining market concentration, innovation drivers, regulatory influences, and merger & acquisition (M&A) activities. The report quantifies market share amongst leading players and assesses the financial impact of notable M&A deals.
- Market Concentration: The mPOS terminals market exhibits [xx]% market concentration in 2025, with the top five players holding a combined [xx]% share. This indicates a [highly competitive/moderately concentrated/fragmented] market.
- Innovation Drivers: Key drivers include advancements in mobile technology (e.g., 5G, NFC), increasing demand for contactless payments, and the growing adoption of cloud-based POS solutions.
- Regulatory Frameworks: Government regulations regarding data security and payment processing significantly impact market dynamics. Compliance costs and varying regulations across different geographies pose both challenges and opportunities.
- Product Substitutes: Traditional POS systems and online payment gateways represent key substitutes. However, the convenience and portability of mPOS terminals continue to drive market growth.
- End-User Demographics: The market caters to a wide range of end-users, including SMEs, large enterprises, and diverse industry sectors. The report segments the market to provide granular insights into user preferences and adoption rates.
- M&A Activities: The report documents significant M&A activities in the mPOS terminals market during the study period, detailing deal values and their impact on market consolidation. For example, [Insert a specific example of an M&A deal, if data is available, and its value in Millions].
mPOS Terminals Market Dynamics & Trends
This section delves into the market’s growth drivers, technological disruptions, consumer preferences, and competitive dynamics. It provides a detailed analysis of market size, CAGR, and penetration rates across key segments.
[This section requires approximately 600 words of detailed analysis focusing on the above mentioned points, incorporating data such as CAGR and market penetration for different segments and regions. Include discussion on the impact of technological advancements like NFC, 5G, and cloud computing on market growth. Analyze consumer preference shifts toward contactless and cashless payments and its implications for the mPOS terminals market. Discuss the competitive strategies employed by various players, including pricing strategies, product differentiation, and market expansion initiatives.]
Dominant Regions & Segments in mPOS Terminals Market
This section identifies the leading regions, countries, and segments within the mPOS terminals market, analyzing factors contributing to their dominance.
- By Type: [Analysis comparing the Software and Services segments, identifying the dominant segment and providing reasons for its dominance. Include growth projections and market sizes in Millions for each segment.]
- By Organization Size: [Analysis comparing the SMEs and Large Enterprises segments, identifying the dominant segment and providing reasons for its dominance. Include growth projections and market sizes in Millions for each segment.]
- By End-user Industry: [Analysis of the BFSI, Aerospace and Defense, Government and Legal Firm, IT and Telecom, Healthcare, Education, Energy and Utilities, and Other End-user Industries segments, identifying the dominant segment(s) and providing reasons for dominance. Include growth projections and market sizes in Millions for each segment.]
[This section requires approximately 600 words of detailed analysis, including key drivers (economic policies, infrastructure, etc.) presented in bullet points for each segment and detailed paragraphs for dominance analysis.]
mPOS Terminals Market Product Innovations
This section summarizes recent product developments, highlighting technological trends and their market relevance. The focus is on competitive advantages arising from innovation and the overall market fit of new products.
[This section requires approximately 100-150 words summarizing recent innovations in mPOS terminals, including new features, functionalities, and technological advancements. This should highlight how these innovations address market needs and provide competitive advantages for companies.]
Report Scope & Segmentation Analysis
This section details the market segmentation by Type (Software, Services), Organization Size (SMEs, Large Enterprises), and End-user Industry (BFSI, Aerospace and Defense, Government and Legal Firm, IT and Telecom, Healthcare, Education, Energy and Utilities, Other End-user Industries).
[This section requires approximately 100-150 words. Provide a brief paragraph for each segmentation category, including growth projections, market sizes in Millions, and competitive dynamics. The information should be concise and highlight the key features of each segment.]
Key Drivers of mPOS Terminals Market Growth
This section outlines the key factors driving the growth of the mPOS terminals market.
[This section requires approximately 150 words. The discussion should cover technological advancements (e.g., improved security features, contactless payment options), economic factors (e.g., increasing consumer spending, growth of e-commerce), and regulatory changes (e.g., government initiatives promoting digital payments) as drivers. Include specific examples to support the analysis.]
Challenges in the mPOS Terminals Market Sector
This section discusses the barriers and restraints impacting the mPOS terminals market.
[This section requires approximately 150 words. Discuss regulatory hurdles (e.g., data privacy regulations), supply chain disruptions, and intense competition as challenges. Quantify the impact where possible, for example, by estimating the percentage of market growth hampered by supply chain issues or the cost incurred by companies due to regulatory compliance.]
Emerging Opportunities in mPOS Terminals Market
This section highlights promising opportunities for growth in the mPOS terminals market.
[This section requires approximately 150 words. Focus on emerging markets (e.g., developing countries with high mobile penetration), new technologies (e.g., integration with AI and blockchain), and evolving consumer preferences (e.g., demand for integrated loyalty programs) as potential growth opportunities. Provide concrete examples to illustrate each opportunity.]
Leading Players in the mPOS Terminals Market Market
- Posiflex Technology Inc
- Fiserv Inc
- HP Development Company L P
- NEC Corporation
- VeriFone Inc
- SPECTRA Technologies
- SAMSUNG ELECTRONICS
- PAX Technology
- Panasonic Corporation
- Ingenico
Key Developments in mPOS Terminals Market Industry
- May 2023: CaixaBank launched a new app enabling contactless payments via Android devices in Spain, becoming the first Spanish bank to offer this service.
- October 2022: Unzer, a German fintech firm, launched POS Go, a mobile POS system for SMEs offering features like digital receipt storage and real-time sales analysis.
- January 2022: Ayden V. launched an all-in-one mobile POS terminal with Android OS in the UK, US, and EU, eliminating the need for barcodes and separate cash registers.
Future Outlook for mPOS Terminals Market Market
The mPOS terminals market is poised for continued growth, driven by the increasing adoption of digital payments, technological advancements, and the expansion into new markets. Strategic opportunities lie in developing innovative solutions that cater to specific industry needs, such as customized software integrations and enhanced security features. The market's future potential is significant, especially in regions with expanding e-commerce sectors and growing smartphone penetration.
mPOS Terminals Market Segmentation
- 1. Production Analysis
- 2. Consumption Analysis
- 3. Import Market Analysis (Value & Volume)
- 4. Export Market Analysis (Value & Volume)
- 5. Price Trend Analysis
mPOS Terminals Market Segmentation By Geography
- 1. North America
- 2. Europe
- 3. Asia
- 4. Latin America
- 5. Middle East and Africa
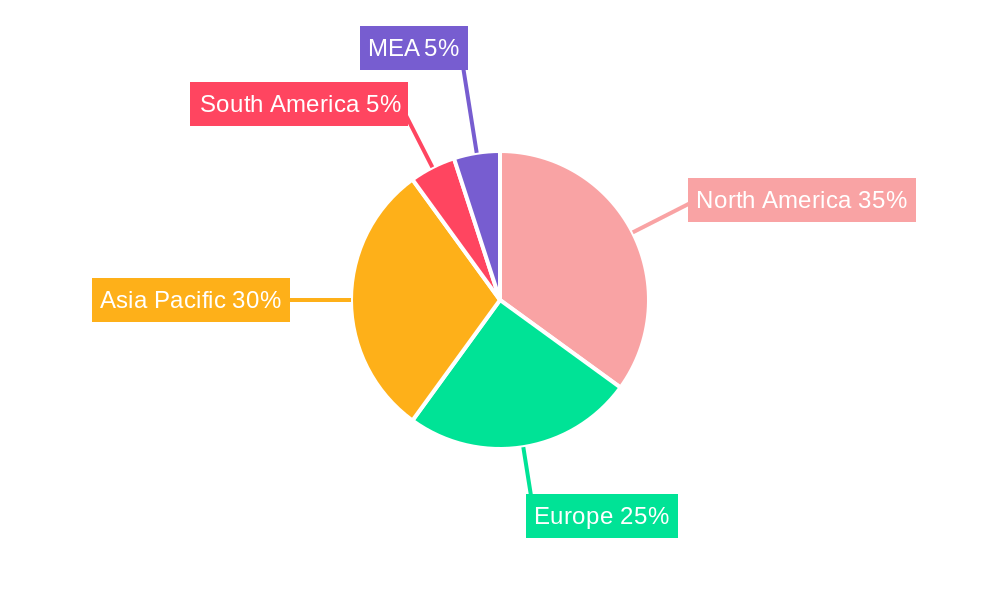
mPOS Terminals Market Regional Market Share
Geographic Coverage of mPOS Terminals Market
mPOS Terminals Market REPORT HIGHLIGHTS
| Aspects | Details |
|---|---|
| Study Period | 2020-2034 |
| Base Year | 2025 |
| Estimated Year | 2026 |
| Forecast Period | 2026-2034 |
| Historical Period | 2020-2025 |
| Growth Rate | CAGR of 12.73% from 2020-2034 |
| Segmentation |
|
Table of Contents
- 1. Introduction
- 1.1. Research Scope
- 1.2. Market Segmentation
- 1.3. Research Objective
- 1.4. Definitions and Assumptions
- 2. Executive Summary
- 2.1. Market Snapshot
- 3. Market Dynamics
- 3.1. Market Drivers
- 3.2. Market Restrains
- 3.3. Market Trends
- 3.4. Market Opportunities
- 4. Market Factor Analysis
- 4.1. Porters Five Forces
- 4.1.1. Bargaining Power of Suppliers
- 4.1.2. Bargaining Power of Buyers
- 4.1.3. Threat of New Entrants
- 4.1.4. Threat of Substitutes
- 4.1.5. Competitive Rivalry
- 4.2. PESTEL analysis
- 4.3. BCG Analysis
- 4.3.1. Stars (High Growth, High Market Share)
- 4.3.2. Cash Cows (Low Growth, High Market Share)
- 4.3.3. Question Mark (High Growth, Low Market Share)
- 4.3.4. Dogs (Low Growth, Low Market Share)
- 4.4. Ansoff Matrix Analysis
- 4.5. Supply Chain Analysis
- 4.6. Regulatory Landscape
- 4.7. Current Market Potential and Opportunity Assessment (TAM–SAM–SOM Framework)
- 4.8. PRI Analyst Note
- 4.1. Porters Five Forces
- 5. Market Analysis, Insights and Forecast 2021-2033
- 5.1. Market Analysis, Insights and Forecast - by Production Analysis
- 5.2. Market Analysis, Insights and Forecast - by Consumption Analysis
- 5.3. Market Analysis, Insights and Forecast - by Import Market Analysis (Value & Volume)
- 5.4. Market Analysis, Insights and Forecast - by Export Market Analysis (Value & Volume)
- 5.5. Market Analysis, Insights and Forecast - by Price Trend Analysis
- 5.6. Market Analysis, Insights and Forecast - by Region
- 5.6.1. North America
- 5.6.2. Europe
- 5.6.3. Asia
- 5.6.4. Latin America
- 5.6.5. Middle East and Africa
- 6. Global mPOS Terminals Market Analysis, Insights and Forecast, 2021-2033
- 6.1. Market Analysis, Insights and Forecast - by Production Analysis
- 6.2. Market Analysis, Insights and Forecast - by Consumption Analysis
- 6.3. Market Analysis, Insights and Forecast - by Import Market Analysis (Value & Volume)
- 6.4. Market Analysis, Insights and Forecast - by Export Market Analysis (Value & Volume)
- 6.5. Market Analysis, Insights and Forecast - by Price Trend Analysis
- 7. North America mPOS Terminals Market Analysis, Insights and Forecast, 2020-2032
- 7.1. Market Analysis, Insights and Forecast - by Production Analysis
- 7.2. Market Analysis, Insights and Forecast - by Consumption Analysis
- 7.3. Market Analysis, Insights and Forecast - by Import Market Analysis (Value & Volume)
- 7.4. Market Analysis, Insights and Forecast - by Export Market Analysis (Value & Volume)
- 7.5. Market Analysis, Insights and Forecast - by Price Trend Analysis
- 8. Europe mPOS Terminals Market Analysis, Insights and Forecast, 2020-2032
- 8.1. Market Analysis, Insights and Forecast - by Production Analysis
- 8.2. Market Analysis, Insights and Forecast - by Consumption Analysis
- 8.3. Market Analysis, Insights and Forecast - by Import Market Analysis (Value & Volume)
- 8.4. Market Analysis, Insights and Forecast - by Export Market Analysis (Value & Volume)
- 8.5. Market Analysis, Insights and Forecast - by Price Trend Analysis
- 9. Asia mPOS Terminals Market Analysis, Insights and Forecast, 2020-2032
- 9.1. Market Analysis, Insights and Forecast - by Production Analysis
- 9.2. Market Analysis, Insights and Forecast - by Consumption Analysis
- 9.3. Market Analysis, Insights and Forecast - by Import Market Analysis (Value & Volume)
- 9.4. Market Analysis, Insights and Forecast - by Export Market Analysis (Value & Volume)
- 9.5. Market Analysis, Insights and Forecast - by Price Trend Analysis
- 10. Latin America mPOS Terminals Market Analysis, Insights and Forecast, 2020-2032
- 10.1. Market Analysis, Insights and Forecast - by Production Analysis
- 10.2. Market Analysis, Insights and Forecast - by Consumption Analysis
- 10.3. Market Analysis, Insights and Forecast - by Import Market Analysis (Value & Volume)
- 10.4. Market Analysis, Insights and Forecast - by Export Market Analysis (Value & Volume)
- 10.5. Market Analysis, Insights and Forecast - by Price Trend Analysis
- 11. Middle East and Africa mPOS Terminals Market Analysis, Insights and Forecast, 2020-2032
- 11.1. Market Analysis, Insights and Forecast - by Production Analysis
- 11.2. Market Analysis, Insights and Forecast - by Consumption Analysis
- 11.3. Market Analysis, Insights and Forecast - by Import Market Analysis (Value & Volume)
- 11.4. Market Analysis, Insights and Forecast - by Export Market Analysis (Value & Volume)
- 11.5. Market Analysis, Insights and Forecast - by Price Trend Analysis
- 12. Competitive Analysis
- 12.1. Company Profiles
- 12.1.1 Posiflex Technology Inc
- 12.1.1.1. Company Overview
- 12.1.1.2. Products
- 12.1.1.3. Company Financials
- 12.1.1.4. SWOT Analysis
- 12.1.2 Fiserv Inc
- 12.1.2.1. Company Overview
- 12.1.2.2. Products
- 12.1.2.3. Company Financials
- 12.1.2.4. SWOT Analysis
- 12.1.3 HP Development Company L P
- 12.1.3.1. Company Overview
- 12.1.3.2. Products
- 12.1.3.3. Company Financials
- 12.1.3.4. SWOT Analysis
- 12.1.4 NEC Corporation
- 12.1.4.1. Company Overview
- 12.1.4.2. Products
- 12.1.4.3. Company Financials
- 12.1.4.4. SWOT Analysis
- 12.1.5 VeriFone Inc *List Not Exhaustive
- 12.1.5.1. Company Overview
- 12.1.5.2. Products
- 12.1.5.3. Company Financials
- 12.1.5.4. SWOT Analysis
- 12.1.6 SPECTRA Technologies
- 12.1.6.1. Company Overview
- 12.1.6.2. Products
- 12.1.6.3. Company Financials
- 12.1.6.4. SWOT Analysis
- 12.1.7 SAMSUNG ELECTRONICS
- 12.1.7.1. Company Overview
- 12.1.7.2. Products
- 12.1.7.3. Company Financials
- 12.1.7.4. SWOT Analysis
- 12.1.8 PAX Technology
- 12.1.8.1. Company Overview
- 12.1.8.2. Products
- 12.1.8.3. Company Financials
- 12.1.8.4. SWOT Analysis
- 12.1.9 Panasonic Corporation
- 12.1.9.1. Company Overview
- 12.1.9.2. Products
- 12.1.9.3. Company Financials
- 12.1.9.4. SWOT Analysis
- 12.1.10 Ingenico
- 12.1.10.1. Company Overview
- 12.1.10.2. Products
- 12.1.10.3. Company Financials
- 12.1.10.4. SWOT Analysis
- 12.1.1 Posiflex Technology Inc
- 12.2. Market Entropy
- 12.2.1 Company's Key Areas Served
- 12.2.2 Recent Developments
- 12.3. Company Market Share Analysis 2025
- 12.3.1 Top 5 Companies Market Share Analysis
- 12.3.2 Top 3 Companies Market Share Analysis
- 12.4. List of Potential Customers
- 13. Research Methodology
List of Figures
- Figure 1: Global mPOS Terminals Market Revenue Breakdown (Million, %) by Region 2025 & 2033
- Figure 2: North America mPOS Terminals Market Revenue (Million), by Production Analysis 2025 & 2033
- Figure 3: North America mPOS Terminals Market Revenue Share (%), by Production Analysis 2025 & 2033
- Figure 4: North America mPOS Terminals Market Revenue (Million), by Consumption Analysis 2025 & 2033
- Figure 5: North America mPOS Terminals Market Revenue Share (%), by Consumption Analysis 2025 & 2033
- Figure 6: North America mPOS Terminals Market Revenue (Million), by Import Market Analysis (Value & Volume) 2025 & 2033
- Figure 7: North America mPOS Terminals Market Revenue Share (%), by Import Market Analysis (Value & Volume) 2025 & 2033
- Figure 8: North America mPOS Terminals Market Revenue (Million), by Export Market Analysis (Value & Volume) 2025 & 2033
- Figure 9: North America mPOS Terminals Market Revenue Share (%), by Export Market Analysis (Value & Volume) 2025 & 2033
- Figure 10: North America mPOS Terminals Market Revenue (Million), by Price Trend Analysis 2025 & 2033
- Figure 11: North America mPOS Terminals Market Revenue Share (%), by Price Trend Analysis 2025 & 2033
- Figure 12: North America mPOS Terminals Market Revenue (Million), by Country 2025 & 2033
- Figure 13: North America mPOS Terminals Market Revenue Share (%), by Country 2025 & 2033
- Figure 14: Europe mPOS Terminals Market Revenue (Million), by Production Analysis 2025 & 2033
- Figure 15: Europe mPOS Terminals Market Revenue Share (%), by Production Analysis 2025 & 2033
- Figure 16: Europe mPOS Terminals Market Revenue (Million), by Consumption Analysis 2025 & 2033
- Figure 17: Europe mPOS Terminals Market Revenue Share (%), by Consumption Analysis 2025 & 2033
- Figure 18: Europe mPOS Terminals Market Revenue (Million), by Import Market Analysis (Value & Volume) 2025 & 2033
- Figure 19: Europe mPOS Terminals Market Revenue Share (%), by Import Market Analysis (Value & Volume) 2025 & 2033
- Figure 20: Europe mPOS Terminals Market Revenue (Million), by Export Market Analysis (Value & Volume) 2025 & 2033
- Figure 21: Europe mPOS Terminals Market Revenue Share (%), by Export Market Analysis (Value & Volume) 2025 & 2033
- Figure 22: Europe mPOS Terminals Market Revenue (Million), by Price Trend Analysis 2025 & 2033
- Figure 23: Europe mPOS Terminals Market Revenue Share (%), by Price Trend Analysis 2025 & 2033
- Figure 24: Europe mPOS Terminals Market Revenue (Million), by Country 2025 & 2033
- Figure 25: Europe mPOS Terminals Market Revenue Share (%), by Country 2025 & 2033
- Figure 26: Asia mPOS Terminals Market Revenue (Million), by Production Analysis 2025 & 2033
- Figure 27: Asia mPOS Terminals Market Revenue Share (%), by Production Analysis 2025 & 2033
- Figure 28: Asia mPOS Terminals Market Revenue (Million), by Consumption Analysis 2025 & 2033
- Figure 29: Asia mPOS Terminals Market Revenue Share (%), by Consumption Analysis 2025 & 2033
- Figure 30: Asia mPOS Terminals Market Revenue (Million), by Import Market Analysis (Value & Volume) 2025 & 2033
- Figure 31: Asia mPOS Terminals Market Revenue Share (%), by Import Market Analysis (Value & Volume) 2025 & 2033
- Figure 32: Asia mPOS Terminals Market Revenue (Million), by Export Market Analysis (Value & Volume) 2025 & 2033
- Figure 33: Asia mPOS Terminals Market Revenue Share (%), by Export Market Analysis (Value & Volume) 2025 & 2033
- Figure 34: Asia mPOS Terminals Market Revenue (Million), by Price Trend Analysis 2025 & 2033
- Figure 35: Asia mPOS Terminals Market Revenue Share (%), by Price Trend Analysis 2025 & 2033
- Figure 36: Asia mPOS Terminals Market Revenue (Million), by Country 2025 & 2033
- Figure 37: Asia mPOS Terminals Market Revenue Share (%), by Country 2025 & 2033
- Figure 38: Latin America mPOS Terminals Market Revenue (Million), by Production Analysis 2025 & 2033
- Figure 39: Latin America mPOS Terminals Market Revenue Share (%), by Production Analysis 2025 & 2033
- Figure 40: Latin America mPOS Terminals Market Revenue (Million), by Consumption Analysis 2025 & 2033
- Figure 41: Latin America mPOS Terminals Market Revenue Share (%), by Consumption Analysis 2025 & 2033
- Figure 42: Latin America mPOS Terminals Market Revenue (Million), by Import Market Analysis (Value & Volume) 2025 & 2033
- Figure 43: Latin America mPOS Terminals Market Revenue Share (%), by Import Market Analysis (Value & Volume) 2025 & 2033
- Figure 44: Latin America mPOS Terminals Market Revenue (Million), by Export Market Analysis (Value & Volume) 2025 & 2033
- Figure 45: Latin America mPOS Terminals Market Revenue Share (%), by Export Market Analysis (Value & Volume) 2025 & 2033
- Figure 46: Latin America mPOS Terminals Market Revenue (Million), by Price Trend Analysis 2025 & 2033
- Figure 47: Latin America mPOS Terminals Market Revenue Share (%), by Price Trend Analysis 2025 & 2033
- Figure 48: Latin America mPOS Terminals Market Revenue (Million), by Country 2025 & 2033
- Figure 49: Latin America mPOS Terminals Market Revenue Share (%), by Country 2025 & 2033
- Figure 50: Middle East and Africa mPOS Terminals Market Revenue (Million), by Production Analysis 2025 & 2033
- Figure 51: Middle East and Africa mPOS Terminals Market Revenue Share (%), by Production Analysis 2025 & 2033
- Figure 52: Middle East and Africa mPOS Terminals Market Revenue (Million), by Consumption Analysis 2025 & 2033
- Figure 53: Middle East and Africa mPOS Terminals Market Revenue Share (%), by Consumption Analysis 2025 & 2033
- Figure 54: Middle East and Africa mPOS Terminals Market Revenue (Million), by Import Market Analysis (Value & Volume) 2025 & 2033
- Figure 55: Middle East and Africa mPOS Terminals Market Revenue Share (%), by Import Market Analysis (Value & Volume) 2025 & 2033
- Figure 56: Middle East and Africa mPOS Terminals Market Revenue (Million), by Export Market Analysis (Value & Volume) 2025 & 2033
- Figure 57: Middle East and Africa mPOS Terminals Market Revenue Share (%), by Export Market Analysis (Value & Volume) 2025 & 2033
- Figure 58: Middle East and Africa mPOS Terminals Market Revenue (Million), by Price Trend Analysis 2025 & 2033
- Figure 59: Middle East and Africa mPOS Terminals Market Revenue Share (%), by Price Trend Analysis 2025 & 2033
- Figure 60: Middle East and Africa mPOS Terminals Market Revenue (Million), by Country 2025 & 2033
- Figure 61: Middle East and Africa mPOS Terminals Market Revenue Share (%), by Country 2025 & 2033
List of Tables
- Table 1: Global mPOS Terminals Market Revenue Million Forecast, by Production Analysis 2020 & 2033
- Table 2: Global mPOS Terminals Market Revenue Million Forecast, by Consumption Analysis 2020 & 2033
- Table 3: Global mPOS Terminals Market Revenue Million Forecast, by Import Market Analysis (Value & Volume) 2020 & 2033
- Table 4: Global mPOS Terminals Market Revenue Million Forecast, by Export Market Analysis (Value & Volume) 2020 & 2033
- Table 5: Global mPOS Terminals Market Revenue Million Forecast, by Price Trend Analysis 2020 & 2033
- Table 6: Global mPOS Terminals Market Revenue Million Forecast, by Region 2020 & 2033
- Table 7: Global mPOS Terminals Market Revenue Million Forecast, by Production Analysis 2020 & 2033
- Table 8: Global mPOS Terminals Market Revenue Million Forecast, by Consumption Analysis 2020 & 2033
- Table 9: Global mPOS Terminals Market Revenue Million Forecast, by Import Market Analysis (Value & Volume) 2020 & 2033
- Table 10: Global mPOS Terminals Market Revenue Million Forecast, by Export Market Analysis (Value & Volume) 2020 & 2033
- Table 11: Global mPOS Terminals Market Revenue Million Forecast, by Price Trend Analysis 2020 & 2033
- Table 12: Global mPOS Terminals Market Revenue Million Forecast, by Country 2020 & 2033
- Table 13: Global mPOS Terminals Market Revenue Million Forecast, by Production Analysis 2020 & 2033
- Table 14: Global mPOS Terminals Market Revenue Million Forecast, by Consumption Analysis 2020 & 2033
- Table 15: Global mPOS Terminals Market Revenue Million Forecast, by Import Market Analysis (Value & Volume) 2020 & 2033
- Table 16: Global mPOS Terminals Market Revenue Million Forecast, by Export Market Analysis (Value & Volume) 2020 & 2033
- Table 17: Global mPOS Terminals Market Revenue Million Forecast, by Price Trend Analysis 2020 & 2033
- Table 18: Global mPOS Terminals Market Revenue Million Forecast, by Country 2020 & 2033
- Table 19: Global mPOS Terminals Market Revenue Million Forecast, by Production Analysis 2020 & 2033
- Table 20: Global mPOS Terminals Market Revenue Million Forecast, by Consumption Analysis 2020 & 2033
- Table 21: Global mPOS Terminals Market Revenue Million Forecast, by Import Market Analysis (Value & Volume) 2020 & 2033
- Table 22: Global mPOS Terminals Market Revenue Million Forecast, by Export Market Analysis (Value & Volume) 2020 & 2033
- Table 23: Global mPOS Terminals Market Revenue Million Forecast, by Price Trend Analysis 2020 & 2033
- Table 24: Global mPOS Terminals Market Revenue Million Forecast, by Country 2020 & 2033
- Table 25: Global mPOS Terminals Market Revenue Million Forecast, by Production Analysis 2020 & 2033
- Table 26: Global mPOS Terminals Market Revenue Million Forecast, by Consumption Analysis 2020 & 2033
- Table 27: Global mPOS Terminals Market Revenue Million Forecast, by Import Market Analysis (Value & Volume) 2020 & 2033
- Table 28: Global mPOS Terminals Market Revenue Million Forecast, by Export Market Analysis (Value & Volume) 2020 & 2033
- Table 29: Global mPOS Terminals Market Revenue Million Forecast, by Price Trend Analysis 2020 & 2033
- Table 30: Global mPOS Terminals Market Revenue Million Forecast, by Country 2020 & 2033
- Table 31: Global mPOS Terminals Market Revenue Million Forecast, by Production Analysis 2020 & 2033
- Table 32: Global mPOS Terminals Market Revenue Million Forecast, by Consumption Analysis 2020 & 2033
- Table 33: Global mPOS Terminals Market Revenue Million Forecast, by Import Market Analysis (Value & Volume) 2020 & 2033
- Table 34: Global mPOS Terminals Market Revenue Million Forecast, by Export Market Analysis (Value & Volume) 2020 & 2033
- Table 35: Global mPOS Terminals Market Revenue Million Forecast, by Price Trend Analysis 2020 & 2033
- Table 36: Global mPOS Terminals Market Revenue Million Forecast, by Country 2020 & 2033
Frequently Asked Questions
1. What is the projected Compound Annual Growth Rate (CAGR) of the mPOS Terminals Market?
The projected CAGR is approximately 12.73%.
2. Which companies are prominent players in the mPOS Terminals Market?
Key companies in the market include Posiflex Technology Inc, Fiserv Inc, HP Development Company L P, NEC Corporation, VeriFone Inc *List Not Exhaustive, SPECTRA Technologies, SAMSUNG ELECTRONICS, PAX Technology, Panasonic Corporation, Ingenico.
3. What are the main segments of the mPOS Terminals Market?
The market segments include Production Analysis, Consumption Analysis, Import Market Analysis (Value & Volume), Export Market Analysis (Value & Volume), Price Trend Analysis.
4. Can you provide details about the market size?
The market size is estimated to be USD 44.26 Million as of 2022.
5. What are some drivers contributing to market growth?
Reduced Cost of overall payment process and inventory management; Increase in Adoption of Card and Online payment.
6. What are the notable trends driving market growth?
Increase in Adoption of Card and Online payment.
7. Are there any restraints impacting market growth?
Security of Data Stored with Third Party (Cloud).
8. Can you provide examples of recent developments in the market?
May 2023: CaixaBank announced the launch of a new app that allows contactless payments via Android devices in Spain. With the application launch, the bank has become the first Spanish bank that allows the service, which negates the need for a supplementary device.
9. What pricing options are available for accessing the report?
Pricing options include single-user, multi-user, and enterprise licenses priced at USD 4750, USD 5250, and USD 8750 respectively.
10. Is the market size provided in terms of value or volume?
The market size is provided in terms of value, measured in Million.
11. Are there any specific market keywords associated with the report?
Yes, the market keyword associated with the report is "mPOS Terminals Market," which aids in identifying and referencing the specific market segment covered.
12. How do I determine which pricing option suits my needs best?
The pricing options vary based on user requirements and access needs. Individual users may opt for single-user licenses, while businesses requiring broader access may choose multi-user or enterprise licenses for cost-effective access to the report.
13. Are there any additional resources or data provided in the mPOS Terminals Market report?
While the report offers comprehensive insights, it's advisable to review the specific contents or supplementary materials provided to ascertain if additional resources or data are available.
14. How can I stay updated on further developments or reports in the mPOS Terminals Market?
To stay informed about further developments, trends, and reports in the mPOS Terminals Market, consider subscribing to industry newsletters, following relevant companies and organizations, or regularly checking reputable industry news sources and publications.
Methodology
Step 1 - Identification of Relevant Samples Size from Population Database


Step 2 - Approaches for Defining Global Market Size (Value, Volume* & Price*)

Note*: In applicable scenarios
Step 3 - Data Sources
Primary Research
- Web Analytics
- Survey Reports
- Research Institute
- Latest Research Reports
- Opinion Leaders
Secondary Research
- Annual Reports
- White Paper
- Latest Press Release
- Industry Association
- Paid Database
- Investor Presentations

Step 4 - Data Triangulation
Involves using different sources of information in order to increase the validity of a study
These sources are likely to be stakeholders in a program - participants, other researchers, program staff, other community members, and so on.
Then we put all data in single framework & apply various statistical tools to find out the dynamic on the market.
During the analysis stage, feedback from the stakeholder groups would be compared to determine areas of agreement as well as areas of divergence