

Key Insights
The North American liquid hand soap market is poised for sustained expansion, with a projected Compound Annual Growth Rate (CAGR) of 6.7%. This robust growth is underpinned by increasing consumer emphasis on hygiene and sanitation, a trend amplified by recent global health events. The market is segmented by packaging, including pump dispensers, refill bottles/containers, and refill pouches, and by distribution channel, encompassing supermarkets/hypermarkets, convenience stores, and online retailers. Pump dispensers currently lead due to convenience and hygiene, while eco-friendly refill options are gaining significant traction. Key market players, such as Unilever, Henkel, and Reckitt Benckiser, are capitalizing on their established networks and brand equity. Emerging niche brands, focusing on natural and sustainable ingredients, are also capturing a growing segment of environmentally conscious consumers. The market's trajectory is further influenced by rising disposable incomes, evolving consumer preferences for premium and specialized products (e.g., antibacterial, moisturizing, scented), and the expanding e-commerce landscape.
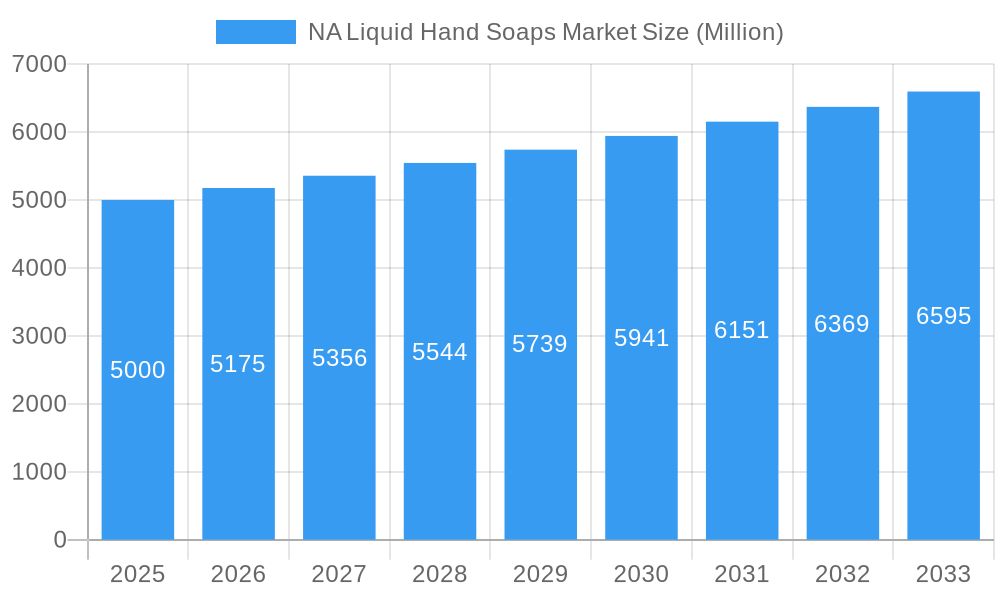
NA Liquid Hand Soaps Market Market Size (In Billion)
The North American liquid hand soap market, estimated at 25.3 billion in the base year 2025, is expected to exhibit steady growth. Key drivers include continuous product innovation, such as advanced antimicrobial formulations and enhanced fragrances, a persistent demand for convenient packaging solutions, and a notable shift towards online purchasing channels. Regional variations are anticipated, with urban centers and densely populated areas likely to experience accelerated growth. Intense competition prevails, with established brands vying for market share through competitive pricing, brand recognition, and product differentiation. The market's future success will depend on its agility in adapting to evolving consumer demands, particularly the growing preference for sustainable and ethically sourced ingredients and packaging. Opportunities for future growth are concentrated in expanding into niche market segments, pioneering innovative product formulations, and effectively leveraging digital marketing strategies to broaden brand reach and awareness.
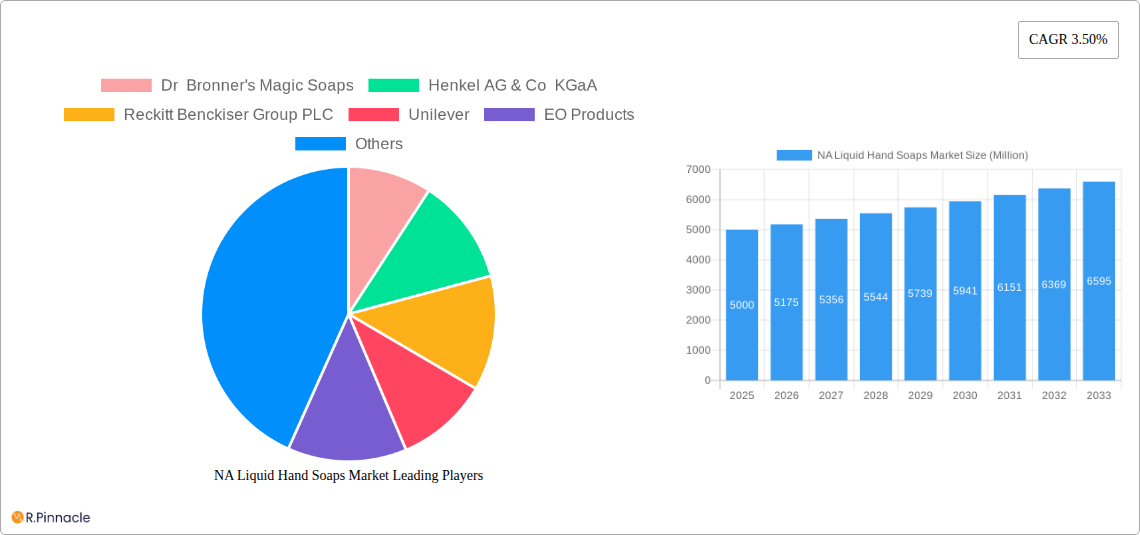
NA Liquid Hand Soaps Market Company Market Share
North America Liquid Hand Soaps Market Report: 2019-2033
This comprehensive report provides an in-depth analysis of the North America liquid hand soaps market, offering invaluable insights for industry professionals, investors, and strategic decision-makers. Covering the period from 2019 to 2033, with a focus on 2025, this report unveils the market's structure, dynamics, dominant segments, and future outlook. The study encompasses key players like Dr. Bronner's Magic Soaps, Henkel AG & Co KGaA, Reckitt Benckiser Group PLC, Unilever, EO Products, The Hain Celestial Group Inc, Colgate-Palmolive Company, S C Johnson & Son Inc, Kao Corporation, and The J R Watkins Co, among others. This report is crucial for understanding the current market landscape and formulating successful strategies for growth.
NA Liquid Hand Soaps Market Market Structure & Innovation Trends
The North America liquid hand soap market exhibits a moderately concentrated structure, with a few major players holding significant market share. However, the presence of numerous smaller brands and private labels fosters competition. Innovation is driven by consumer demand for natural, sustainable, and effective products, leading to the development of specialized formulas catering to sensitive skin, antimicrobial properties, and eco-friendly packaging. Stringent regulatory frameworks concerning ingredient safety and labeling influence product formulations and marketing claims. Product substitutes, such as bar soaps and hand sanitizers, exert competitive pressure. The end-user demographic is broad, encompassing households, commercial establishments, and healthcare facilities. M&A activities in the sector are relatively frequent, with deal values ranging from xx Million to xx Million, primarily driven by expansion strategies and access to new technologies or market segments. Key metrics like market share and M&A deal values are thoroughly analyzed within the report to provide a comprehensive understanding of market dynamics.
NA Liquid Hand Soaps Market Market Dynamics & Trends
The North American liquid hand soaps market is experiencing robust growth, driven primarily by increasing health awareness and hygiene practices. The CAGR from 2025 to 2033 is projected to be xx%. Market penetration is high, particularly in households, but further growth is anticipated from increased adoption in commercial settings. Technological advancements, such as the incorporation of advanced antimicrobial agents and eco-friendly packaging materials, are influencing consumer preferences. Competitive dynamics are shaped by brand loyalty, pricing strategies, and product differentiation. The market is witnessing a notable shift towards natural and organic products, reflecting growing consumer preference for sustainable and ethically sourced ingredients. The increasing adoption of online retail channels is also transforming distribution patterns and providing new avenues for growth.
Dominant Regions & Segments in NA Liquid Hand Soaps Market
The report identifies the [Specific Region - e.g., Northeast] region of North America as the leading market for liquid hand soaps, driven by [Specific reasons – e.g., higher population density, strong consumer spending]. Country-level dominance is further analyzed within the report.
By Packaging Type:
- Pump Dispensers: This segment holds the largest market share due to convenience and hygiene. Key drivers include ease of use, cost-effectiveness for manufacturers, and consumer preference for controlled dispensing.
- Bottles/Containers (Refill): This segment is experiencing growth driven by consumer focus on sustainability and cost savings associated with refilling.
- Pouches (Refill): The growth of this segment is comparatively slower, largely limited by logistical complexities and consumer perception.
By Distribution Channel:
- Supermarkets/Hypermarkets: This remains the dominant distribution channel due to wide reach and established retail infrastructure.
- Convenience Stores: This channel offers convenience and accessibility, contributing to significant market share, especially for smaller packages.
- Online Retailers: This channel is experiencing rapid growth, driven by increased online shopping and convenience.
- Other Distribution Channels: This includes specialized retailers, institutional sales, etc., and contributes to overall market size.
NA Liquid Hand Soaps Market Product Innovations
Recent product innovations focus on incorporating natural and sustainable ingredients, antimicrobial technologies, and improved dispensing mechanisms. Formulations are being tailored to address specific consumer needs, such as sensitive skin or specific scents. The integration of smart packaging, such as refill systems and sustainable materials, is gaining traction as consumers demonstrate increased environmental awareness. These innovations aim to enhance both product performance and overall consumer experience, aligning with current market demands and trends.
Report Scope & Segmentation Analysis
This report analyzes the North American liquid hand soaps market across various segments:
By Packaging Type: Pump Dispensers, Bottles/Containers (Refill), Pouches (Refill). Each segment's growth projections, market sizes, and competitive dynamics are detailed within the report.
By Distribution Channel: Supermarkets/Hypermarkets, Convenience Stores, Online Retailers, Other Distribution Channels. Detailed analysis of each channel’s contribution to market growth is provided.
Each segment's market size, growth projection, and competitive landscape are meticulously examined to provide a complete view of the market segmentation.
Key Drivers of NA Liquid Hand Soaps Market Growth
The market's growth is fueled by factors such as increasing awareness of hygiene and sanitation, rising disposable incomes leading to increased consumer spending, and the growing demand for natural and sustainable products. Government regulations promoting hand hygiene also play a significant role. The shift towards convenient and eco-friendly packaging further propels market growth.
Challenges in the NA Liquid Hand Soaps Market Sector
The market faces challenges such as fluctuating raw material prices, intense competition from established and emerging players, and increasing regulatory scrutiny regarding ingredient safety. Supply chain disruptions can also impact production and availability. These factors can influence pricing strategies and profit margins for market players.
Emerging Opportunities in NA Liquid Hand Soaps Market
Emerging opportunities include the growing demand for specialized liquid hand soaps targeting niche consumer groups, such as those with sensitive skin or specific allergies. The increasing adoption of innovative packaging solutions and the expansion into e-commerce platforms also offer significant potential for market growth. The development of sustainable and eco-friendly products remains a key area of opportunity.
Leading Players in the NA Liquid Hand Soaps Market Market
- Dr. Bronner's Magic Soaps
- Henkel AG & Co KGaA
- Reckitt Benckiser Group PLC
- Unilever
- EO Products
- The Hain Celestial Group Inc
- Colgate-Palmolive Company
- S C Johnson & Son Inc
- Kao Corporation
- The J R Watkins Co
Key Developments in NA Liquid Hand Soaps Market Industry
- January 2023: Unilever launched a new line of sustainable hand soaps.
- March 2022: Henkel acquired a smaller hand soap manufacturer, expanding its market reach.
- [Add more key developments with year/month and a brief description of their impact.]
Future Outlook for NA Liquid Hand Soaps Market Market
The North American liquid hand soaps market is poised for sustained growth, driven by ongoing demand for hygiene products and the increasing adoption of sustainable and innovative solutions. Strategic partnerships, product diversification, and expansion into new market segments will be crucial for success. The market's future potential is significant, with further opportunities for growth across various segments and channels.
NA Liquid Hand Soaps Market Segmentation
-
1. Packaging Type
- 1.1. Pump Dispensers
- 1.2. Bottles/Containers (Refill)
- 1.3. Pouches (Refill)
-
2. Distribution Channel
- 2.1. Supermarkets/Hypermarkets
- 2.2. Convenience Stores
- 2.3. Online Retailers
- 2.4. Other Distribution Channels
-
3. Geography
- 3.1. United States
- 3.2. Canada
- 3.3. Mexico
- 3.4. Rest of North America
NA Liquid Hand Soaps Market Segmentation By Geography
- 1. United States
- 2. Canada
- 3. Mexico
- 4. Rest of North America
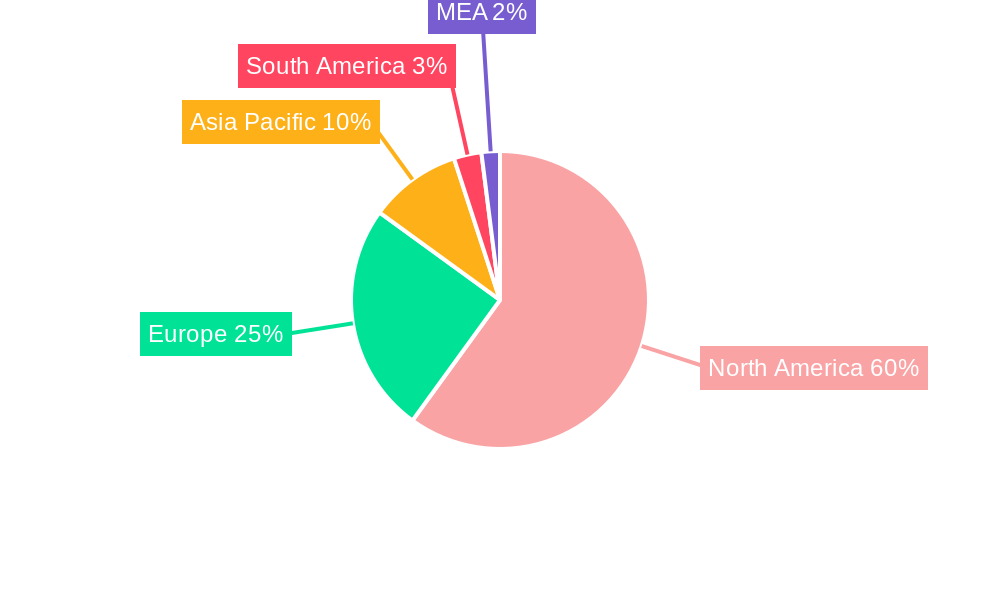
NA Liquid Hand Soaps Market Regional Market Share
Geographic Coverage of NA Liquid Hand Soaps Market
NA Liquid Hand Soaps Market REPORT HIGHLIGHTS
| Aspects | Details |
|---|---|
| Study Period | 2020-2034 |
| Base Year | 2025 |
| Estimated Year | 2026 |
| Forecast Period | 2026-2034 |
| Historical Period | 2020-2025 |
| Growth Rate | CAGR of 6.7% from 2020-2034 |
| Segmentation |
|
Table of Contents
- 1. Introduction
- 1.1. Research Scope
- 1.2. Market Segmentation
- 1.3. Research Objective
- 1.4. Definitions and Assumptions
- 2. Executive Summary
- 2.1. Market Snapshot
- 3. Market Dynamics
- 3.1. Market Drivers
- 3.2. Market Restrains
- 3.3. Market Trends
- 3.4. Market Opportunities
- 4. Market Factor Analysis
- 4.1. Porters Five Forces
- 4.1.1. Bargaining Power of Suppliers
- 4.1.2. Bargaining Power of Buyers
- 4.1.3. Threat of New Entrants
- 4.1.4. Threat of Substitutes
- 4.1.5. Competitive Rivalry
- 4.2. PESTEL analysis
- 4.3. BCG Analysis
- 4.3.1. Stars (High Growth, High Market Share)
- 4.3.2. Cash Cows (Low Growth, High Market Share)
- 4.3.3. Question Mark (High Growth, Low Market Share)
- 4.3.4. Dogs (Low Growth, Low Market Share)
- 4.4. Ansoff Matrix Analysis
- 4.5. Supply Chain Analysis
- 4.6. Regulatory Landscape
- 4.7. Current Market Potential and Opportunity Assessment (TAM–SAM–SOM Framework)
- 4.8. PRI Analyst Note
- 4.1. Porters Five Forces
- 5. Market Analysis, Insights and Forecast 2021-2033
- 5.1. Market Analysis, Insights and Forecast - by Packaging Type
- 5.1.1. Pump Dispensers
- 5.1.2. Bottles/Containers (Refill)
- 5.1.3. Pouches (Refill)
- 5.2. Market Analysis, Insights and Forecast - by Distribution Channel
- 5.2.1. Supermarkets/Hypermarkets
- 5.2.2. Convenience Stores
- 5.2.3. Online Retailers
- 5.2.4. Other Distribution Channels
- 5.3. Market Analysis, Insights and Forecast - by Geography
- 5.3.1. United States
- 5.3.2. Canada
- 5.3.3. Mexico
- 5.3.4. Rest of North America
- 5.4. Market Analysis, Insights and Forecast - by Region
- 5.4.1. United States
- 5.4.2. Canada
- 5.4.3. Mexico
- 5.4.4. Rest of North America
- 5.1. Market Analysis, Insights and Forecast - by Packaging Type
- 6. Global NA Liquid Hand Soaps Market Analysis, Insights and Forecast, 2021-2033
- 6.1. Market Analysis, Insights and Forecast - by Packaging Type
- 6.1.1. Pump Dispensers
- 6.1.2. Bottles/Containers (Refill)
- 6.1.3. Pouches (Refill)
- 6.2. Market Analysis, Insights and Forecast - by Distribution Channel
- 6.2.1. Supermarkets/Hypermarkets
- 6.2.2. Convenience Stores
- 6.2.3. Online Retailers
- 6.2.4. Other Distribution Channels
- 6.3. Market Analysis, Insights and Forecast - by Geography
- 6.3.1. United States
- 6.3.2. Canada
- 6.3.3. Mexico
- 6.3.4. Rest of North America
- 6.1. Market Analysis, Insights and Forecast - by Packaging Type
- 7. United States NA Liquid Hand Soaps Market Analysis, Insights and Forecast, 2020-2032
- 7.1. Market Analysis, Insights and Forecast - by Packaging Type
- 7.1.1. Pump Dispensers
- 7.1.2. Bottles/Containers (Refill)
- 7.1.3. Pouches (Refill)
- 7.2. Market Analysis, Insights and Forecast - by Distribution Channel
- 7.2.1. Supermarkets/Hypermarkets
- 7.2.2. Convenience Stores
- 7.2.3. Online Retailers
- 7.2.4. Other Distribution Channels
- 7.3. Market Analysis, Insights and Forecast - by Geography
- 7.3.1. United States
- 7.3.2. Canada
- 7.3.3. Mexico
- 7.3.4. Rest of North America
- 7.1. Market Analysis, Insights and Forecast - by Packaging Type
- 8. Canada NA Liquid Hand Soaps Market Analysis, Insights and Forecast, 2020-2032
- 8.1. Market Analysis, Insights and Forecast - by Packaging Type
- 8.1.1. Pump Dispensers
- 8.1.2. Bottles/Containers (Refill)
- 8.1.3. Pouches (Refill)
- 8.2. Market Analysis, Insights and Forecast - by Distribution Channel
- 8.2.1. Supermarkets/Hypermarkets
- 8.2.2. Convenience Stores
- 8.2.3. Online Retailers
- 8.2.4. Other Distribution Channels
- 8.3. Market Analysis, Insights and Forecast - by Geography
- 8.3.1. United States
- 8.3.2. Canada
- 8.3.3. Mexico
- 8.3.4. Rest of North America
- 8.1. Market Analysis, Insights and Forecast - by Packaging Type
- 9. Mexico NA Liquid Hand Soaps Market Analysis, Insights and Forecast, 2020-2032
- 9.1. Market Analysis, Insights and Forecast - by Packaging Type
- 9.1.1. Pump Dispensers
- 9.1.2. Bottles/Containers (Refill)
- 9.1.3. Pouches (Refill)
- 9.2. Market Analysis, Insights and Forecast - by Distribution Channel
- 9.2.1. Supermarkets/Hypermarkets
- 9.2.2. Convenience Stores
- 9.2.3. Online Retailers
- 9.2.4. Other Distribution Channels
- 9.3. Market Analysis, Insights and Forecast - by Geography
- 9.3.1. United States
- 9.3.2. Canada
- 9.3.3. Mexico
- 9.3.4. Rest of North America
- 9.1. Market Analysis, Insights and Forecast - by Packaging Type
- 10. Rest of North America NA Liquid Hand Soaps Market Analysis, Insights and Forecast, 2020-2032
- 10.1. Market Analysis, Insights and Forecast - by Packaging Type
- 10.1.1. Pump Dispensers
- 10.1.2. Bottles/Containers (Refill)
- 10.1.3. Pouches (Refill)
- 10.2. Market Analysis, Insights and Forecast - by Distribution Channel
- 10.2.1. Supermarkets/Hypermarkets
- 10.2.2. Convenience Stores
- 10.2.3. Online Retailers
- 10.2.4. Other Distribution Channels
- 10.3. Market Analysis, Insights and Forecast - by Geography
- 10.3.1. United States
- 10.3.2. Canada
- 10.3.3. Mexico
- 10.3.4. Rest of North America
- 10.1. Market Analysis, Insights and Forecast - by Packaging Type
- 11. Competitive Analysis
- 11.1. Company Profiles
- 11.1.1 Dr Bronner's Magic Soaps
- 11.1.1.1. Company Overview
- 11.1.1.2. Products
- 11.1.1.3. Company Financials
- 11.1.1.4. SWOT Analysis
- 11.1.2 Henkel AG & Co KGaA
- 11.1.2.1. Company Overview
- 11.1.2.2. Products
- 11.1.2.3. Company Financials
- 11.1.2.4. SWOT Analysis
- 11.1.3 Reckitt Benckiser Group PLC
- 11.1.3.1. Company Overview
- 11.1.3.2. Products
- 11.1.3.3. Company Financials
- 11.1.3.4. SWOT Analysis
- 11.1.4 Unilever
- 11.1.4.1. Company Overview
- 11.1.4.2. Products
- 11.1.4.3. Company Financials
- 11.1.4.4. SWOT Analysis
- 11.1.5 EO Products
- 11.1.5.1. Company Overview
- 11.1.5.2. Products
- 11.1.5.3. Company Financials
- 11.1.5.4. SWOT Analysis
- 11.1.6 The Hain Celestial Group Inc *List Not Exhaustive
- 11.1.6.1. Company Overview
- 11.1.6.2. Products
- 11.1.6.3. Company Financials
- 11.1.6.4. SWOT Analysis
- 11.1.7 Colgate-Palmolive Company
- 11.1.7.1. Company Overview
- 11.1.7.2. Products
- 11.1.7.3. Company Financials
- 11.1.7.4. SWOT Analysis
- 11.1.8 S C Johnson & Son Inc
- 11.1.8.1. Company Overview
- 11.1.8.2. Products
- 11.1.8.3. Company Financials
- 11.1.8.4. SWOT Analysis
- 11.1.9 Kao Corporation
- 11.1.9.1. Company Overview
- 11.1.9.2. Products
- 11.1.9.3. Company Financials
- 11.1.9.4. SWOT Analysis
- 11.1.10 The J R Watkins Co
- 11.1.10.1. Company Overview
- 11.1.10.2. Products
- 11.1.10.3. Company Financials
- 11.1.10.4. SWOT Analysis
- 11.1.1 Dr Bronner's Magic Soaps
- 11.2. Market Entropy
- 11.2.1 Company's Key Areas Served
- 11.2.2 Recent Developments
- 11.3. Company Market Share Analysis 2025
- 11.3.1 Top 5 Companies Market Share Analysis
- 11.3.2 Top 3 Companies Market Share Analysis
- 11.4. List of Potential Customers
- 12. Research Methodology
List of Figures
- Figure 1: Global NA Liquid Hand Soaps Market Revenue Breakdown (billion, %) by Region 2025 & 2033
- Figure 2: Global NA Liquid Hand Soaps Market Volume Breakdown (K Units, %) by Region 2025 & 2033
- Figure 3: United States NA Liquid Hand Soaps Market Revenue (billion), by Packaging Type 2025 & 2033
- Figure 4: United States NA Liquid Hand Soaps Market Volume (K Units), by Packaging Type 2025 & 2033
- Figure 5: United States NA Liquid Hand Soaps Market Revenue Share (%), by Packaging Type 2025 & 2033
- Figure 6: United States NA Liquid Hand Soaps Market Volume Share (%), by Packaging Type 2025 & 2033
- Figure 7: United States NA Liquid Hand Soaps Market Revenue (billion), by Distribution Channel 2025 & 2033
- Figure 8: United States NA Liquid Hand Soaps Market Volume (K Units), by Distribution Channel 2025 & 2033
- Figure 9: United States NA Liquid Hand Soaps Market Revenue Share (%), by Distribution Channel 2025 & 2033
- Figure 10: United States NA Liquid Hand Soaps Market Volume Share (%), by Distribution Channel 2025 & 2033
- Figure 11: United States NA Liquid Hand Soaps Market Revenue (billion), by Geography 2025 & 2033
- Figure 12: United States NA Liquid Hand Soaps Market Volume (K Units), by Geography 2025 & 2033
- Figure 13: United States NA Liquid Hand Soaps Market Revenue Share (%), by Geography 2025 & 2033
- Figure 14: United States NA Liquid Hand Soaps Market Volume Share (%), by Geography 2025 & 2033
- Figure 15: United States NA Liquid Hand Soaps Market Revenue (billion), by Country 2025 & 2033
- Figure 16: United States NA Liquid Hand Soaps Market Volume (K Units), by Country 2025 & 2033
- Figure 17: United States NA Liquid Hand Soaps Market Revenue Share (%), by Country 2025 & 2033
- Figure 18: United States NA Liquid Hand Soaps Market Volume Share (%), by Country 2025 & 2033
- Figure 19: Canada NA Liquid Hand Soaps Market Revenue (billion), by Packaging Type 2025 & 2033
- Figure 20: Canada NA Liquid Hand Soaps Market Volume (K Units), by Packaging Type 2025 & 2033
- Figure 21: Canada NA Liquid Hand Soaps Market Revenue Share (%), by Packaging Type 2025 & 2033
- Figure 22: Canada NA Liquid Hand Soaps Market Volume Share (%), by Packaging Type 2025 & 2033
- Figure 23: Canada NA Liquid Hand Soaps Market Revenue (billion), by Distribution Channel 2025 & 2033
- Figure 24: Canada NA Liquid Hand Soaps Market Volume (K Units), by Distribution Channel 2025 & 2033
- Figure 25: Canada NA Liquid Hand Soaps Market Revenue Share (%), by Distribution Channel 2025 & 2033
- Figure 26: Canada NA Liquid Hand Soaps Market Volume Share (%), by Distribution Channel 2025 & 2033
- Figure 27: Canada NA Liquid Hand Soaps Market Revenue (billion), by Geography 2025 & 2033
- Figure 28: Canada NA Liquid Hand Soaps Market Volume (K Units), by Geography 2025 & 2033
- Figure 29: Canada NA Liquid Hand Soaps Market Revenue Share (%), by Geography 2025 & 2033
- Figure 30: Canada NA Liquid Hand Soaps Market Volume Share (%), by Geography 2025 & 2033
- Figure 31: Canada NA Liquid Hand Soaps Market Revenue (billion), by Country 2025 & 2033
- Figure 32: Canada NA Liquid Hand Soaps Market Volume (K Units), by Country 2025 & 2033
- Figure 33: Canada NA Liquid Hand Soaps Market Revenue Share (%), by Country 2025 & 2033
- Figure 34: Canada NA Liquid Hand Soaps Market Volume Share (%), by Country 2025 & 2033
- Figure 35: Mexico NA Liquid Hand Soaps Market Revenue (billion), by Packaging Type 2025 & 2033
- Figure 36: Mexico NA Liquid Hand Soaps Market Volume (K Units), by Packaging Type 2025 & 2033
- Figure 37: Mexico NA Liquid Hand Soaps Market Revenue Share (%), by Packaging Type 2025 & 2033
- Figure 38: Mexico NA Liquid Hand Soaps Market Volume Share (%), by Packaging Type 2025 & 2033
- Figure 39: Mexico NA Liquid Hand Soaps Market Revenue (billion), by Distribution Channel 2025 & 2033
- Figure 40: Mexico NA Liquid Hand Soaps Market Volume (K Units), by Distribution Channel 2025 & 2033
- Figure 41: Mexico NA Liquid Hand Soaps Market Revenue Share (%), by Distribution Channel 2025 & 2033
- Figure 42: Mexico NA Liquid Hand Soaps Market Volume Share (%), by Distribution Channel 2025 & 2033
- Figure 43: Mexico NA Liquid Hand Soaps Market Revenue (billion), by Geography 2025 & 2033
- Figure 44: Mexico NA Liquid Hand Soaps Market Volume (K Units), by Geography 2025 & 2033
- Figure 45: Mexico NA Liquid Hand Soaps Market Revenue Share (%), by Geography 2025 & 2033
- Figure 46: Mexico NA Liquid Hand Soaps Market Volume Share (%), by Geography 2025 & 2033
- Figure 47: Mexico NA Liquid Hand Soaps Market Revenue (billion), by Country 2025 & 2033
- Figure 48: Mexico NA Liquid Hand Soaps Market Volume (K Units), by Country 2025 & 2033
- Figure 49: Mexico NA Liquid Hand Soaps Market Revenue Share (%), by Country 2025 & 2033
- Figure 50: Mexico NA Liquid Hand Soaps Market Volume Share (%), by Country 2025 & 2033
- Figure 51: Rest of North America NA Liquid Hand Soaps Market Revenue (billion), by Packaging Type 2025 & 2033
- Figure 52: Rest of North America NA Liquid Hand Soaps Market Volume (K Units), by Packaging Type 2025 & 2033
- Figure 53: Rest of North America NA Liquid Hand Soaps Market Revenue Share (%), by Packaging Type 2025 & 2033
- Figure 54: Rest of North America NA Liquid Hand Soaps Market Volume Share (%), by Packaging Type 2025 & 2033
- Figure 55: Rest of North America NA Liquid Hand Soaps Market Revenue (billion), by Distribution Channel 2025 & 2033
- Figure 56: Rest of North America NA Liquid Hand Soaps Market Volume (K Units), by Distribution Channel 2025 & 2033
- Figure 57: Rest of North America NA Liquid Hand Soaps Market Revenue Share (%), by Distribution Channel 2025 & 2033
- Figure 58: Rest of North America NA Liquid Hand Soaps Market Volume Share (%), by Distribution Channel 2025 & 2033
- Figure 59: Rest of North America NA Liquid Hand Soaps Market Revenue (billion), by Geography 2025 & 2033
- Figure 60: Rest of North America NA Liquid Hand Soaps Market Volume (K Units), by Geography 2025 & 2033
- Figure 61: Rest of North America NA Liquid Hand Soaps Market Revenue Share (%), by Geography 2025 & 2033
- Figure 62: Rest of North America NA Liquid Hand Soaps Market Volume Share (%), by Geography 2025 & 2033
- Figure 63: Rest of North America NA Liquid Hand Soaps Market Revenue (billion), by Country 2025 & 2033
- Figure 64: Rest of North America NA Liquid Hand Soaps Market Volume (K Units), by Country 2025 & 2033
- Figure 65: Rest of North America NA Liquid Hand Soaps Market Revenue Share (%), by Country 2025 & 2033
- Figure 66: Rest of North America NA Liquid Hand Soaps Market Volume Share (%), by Country 2025 & 2033
List of Tables
- Table 1: Global NA Liquid Hand Soaps Market Revenue billion Forecast, by Packaging Type 2020 & 2033
- Table 2: Global NA Liquid Hand Soaps Market Volume K Units Forecast, by Packaging Type 2020 & 2033
- Table 3: Global NA Liquid Hand Soaps Market Revenue billion Forecast, by Distribution Channel 2020 & 2033
- Table 4: Global NA Liquid Hand Soaps Market Volume K Units Forecast, by Distribution Channel 2020 & 2033
- Table 5: Global NA Liquid Hand Soaps Market Revenue billion Forecast, by Geography 2020 & 2033
- Table 6: Global NA Liquid Hand Soaps Market Volume K Units Forecast, by Geography 2020 & 2033
- Table 7: Global NA Liquid Hand Soaps Market Revenue billion Forecast, by Region 2020 & 2033
- Table 8: Global NA Liquid Hand Soaps Market Volume K Units Forecast, by Region 2020 & 2033
- Table 9: Global NA Liquid Hand Soaps Market Revenue billion Forecast, by Packaging Type 2020 & 2033
- Table 10: Global NA Liquid Hand Soaps Market Volume K Units Forecast, by Packaging Type 2020 & 2033
- Table 11: Global NA Liquid Hand Soaps Market Revenue billion Forecast, by Distribution Channel 2020 & 2033
- Table 12: Global NA Liquid Hand Soaps Market Volume K Units Forecast, by Distribution Channel 2020 & 2033
- Table 13: Global NA Liquid Hand Soaps Market Revenue billion Forecast, by Geography 2020 & 2033
- Table 14: Global NA Liquid Hand Soaps Market Volume K Units Forecast, by Geography 2020 & 2033
- Table 15: Global NA Liquid Hand Soaps Market Revenue billion Forecast, by Country 2020 & 2033
- Table 16: Global NA Liquid Hand Soaps Market Volume K Units Forecast, by Country 2020 & 2033
- Table 17: Global NA Liquid Hand Soaps Market Revenue billion Forecast, by Packaging Type 2020 & 2033
- Table 18: Global NA Liquid Hand Soaps Market Volume K Units Forecast, by Packaging Type 2020 & 2033
- Table 19: Global NA Liquid Hand Soaps Market Revenue billion Forecast, by Distribution Channel 2020 & 2033
- Table 20: Global NA Liquid Hand Soaps Market Volume K Units Forecast, by Distribution Channel 2020 & 2033
- Table 21: Global NA Liquid Hand Soaps Market Revenue billion Forecast, by Geography 2020 & 2033
- Table 22: Global NA Liquid Hand Soaps Market Volume K Units Forecast, by Geography 2020 & 2033
- Table 23: Global NA Liquid Hand Soaps Market Revenue billion Forecast, by Country 2020 & 2033
- Table 24: Global NA Liquid Hand Soaps Market Volume K Units Forecast, by Country 2020 & 2033
- Table 25: Global NA Liquid Hand Soaps Market Revenue billion Forecast, by Packaging Type 2020 & 2033
- Table 26: Global NA Liquid Hand Soaps Market Volume K Units Forecast, by Packaging Type 2020 & 2033
- Table 27: Global NA Liquid Hand Soaps Market Revenue billion Forecast, by Distribution Channel 2020 & 2033
- Table 28: Global NA Liquid Hand Soaps Market Volume K Units Forecast, by Distribution Channel 2020 & 2033
- Table 29: Global NA Liquid Hand Soaps Market Revenue billion Forecast, by Geography 2020 & 2033
- Table 30: Global NA Liquid Hand Soaps Market Volume K Units Forecast, by Geography 2020 & 2033
- Table 31: Global NA Liquid Hand Soaps Market Revenue billion Forecast, by Country 2020 & 2033
- Table 32: Global NA Liquid Hand Soaps Market Volume K Units Forecast, by Country 2020 & 2033
- Table 33: Global NA Liquid Hand Soaps Market Revenue billion Forecast, by Packaging Type 2020 & 2033
- Table 34: Global NA Liquid Hand Soaps Market Volume K Units Forecast, by Packaging Type 2020 & 2033
- Table 35: Global NA Liquid Hand Soaps Market Revenue billion Forecast, by Distribution Channel 2020 & 2033
- Table 36: Global NA Liquid Hand Soaps Market Volume K Units Forecast, by Distribution Channel 2020 & 2033
- Table 37: Global NA Liquid Hand Soaps Market Revenue billion Forecast, by Geography 2020 & 2033
- Table 38: Global NA Liquid Hand Soaps Market Volume K Units Forecast, by Geography 2020 & 2033
- Table 39: Global NA Liquid Hand Soaps Market Revenue billion Forecast, by Country 2020 & 2033
- Table 40: Global NA Liquid Hand Soaps Market Volume K Units Forecast, by Country 2020 & 2033
Frequently Asked Questions
1. What is the projected Compound Annual Growth Rate (CAGR) of the NA Liquid Hand Soaps Market?
The projected CAGR is approximately 6.7%.
2. Which companies are prominent players in the NA Liquid Hand Soaps Market?
Key companies in the market include Dr Bronner's Magic Soaps, Henkel AG & Co KGaA, Reckitt Benckiser Group PLC, Unilever, EO Products, The Hain Celestial Group Inc *List Not Exhaustive, Colgate-Palmolive Company, S C Johnson & Son Inc, Kao Corporation, The J R Watkins Co.
3. What are the main segments of the NA Liquid Hand Soaps Market?
The market segments include Packaging Type, Distribution Channel, Geography.
4. Can you provide details about the market size?
The market size is estimated to be USD 25.3 billion as of 2022.
5. What are some drivers contributing to market growth?
Evolving Consumer Perception Toward Oral Hygiene Routines; Increased Focus on Marketing Activities & Distribution Network.
6. What are the notable trends driving market growth?
Consumer Inclination Toward Personal Hygiene Coupled with Government Initiatives.
7. Are there any restraints impacting market growth?
Adverse Effects of Synthetic Chemicals Used in Mouth Washes.
8. Can you provide examples of recent developments in the market?
N/A
9. What pricing options are available for accessing the report?
Pricing options include single-user, multi-user, and enterprise licenses priced at USD 4750, USD 5250, and USD 8750 respectively.
10. Is the market size provided in terms of value or volume?
The market size is provided in terms of value, measured in billion and volume, measured in K Units.
11. Are there any specific market keywords associated with the report?
Yes, the market keyword associated with the report is "NA Liquid Hand Soaps Market," which aids in identifying and referencing the specific market segment covered.
12. How do I determine which pricing option suits my needs best?
The pricing options vary based on user requirements and access needs. Individual users may opt for single-user licenses, while businesses requiring broader access may choose multi-user or enterprise licenses for cost-effective access to the report.
13. Are there any additional resources or data provided in the NA Liquid Hand Soaps Market report?
While the report offers comprehensive insights, it's advisable to review the specific contents or supplementary materials provided to ascertain if additional resources or data are available.
14. How can I stay updated on further developments or reports in the NA Liquid Hand Soaps Market?
To stay informed about further developments, trends, and reports in the NA Liquid Hand Soaps Market, consider subscribing to industry newsletters, following relevant companies and organizations, or regularly checking reputable industry news sources and publications.
Methodology
Step 1 - Identification of Relevant Samples Size from Population Database


Step 2 - Approaches for Defining Global Market Size (Value, Volume* & Price*)

Note*: In applicable scenarios
Step 3 - Data Sources
Primary Research
- Web Analytics
- Survey Reports
- Research Institute
- Latest Research Reports
- Opinion Leaders
Secondary Research
- Annual Reports
- White Paper
- Latest Press Release
- Industry Association
- Paid Database
- Investor Presentations

Step 4 - Data Triangulation
Involves using different sources of information in order to increase the validity of a study
These sources are likely to be stakeholders in a program - participants, other researchers, program staff, other community members, and so on.
Then we put all data in single framework & apply various statistical tools to find out the dynamic on the market.
During the analysis stage, feedback from the stakeholder groups would be compared to determine areas of agreement as well as areas of divergence