


Key Insights
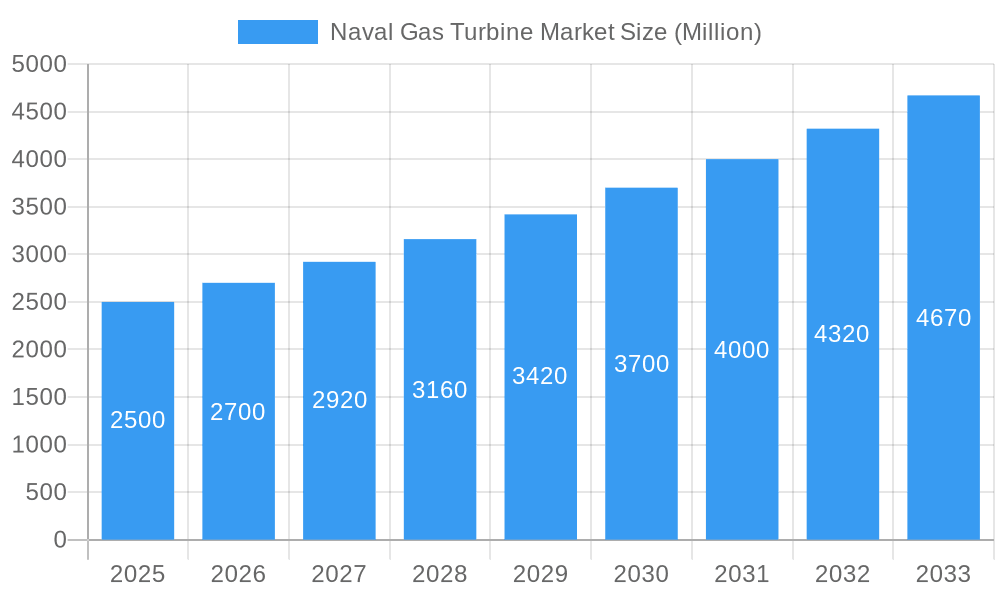
The global naval gas turbine market, estimated at 585.96 million in 2025, is poised for significant expansion, projecting a Compound Annual Growth Rate (CAGR) of 4.7% from 2025 to 2033. This growth is propelled by increasing global demand for advanced naval vessels, driven by major naval powers and emerging nations requiring high-performance propulsion and power generation solutions. Technological advancements, including enhanced fuel efficiency, power output, and durability, are further boosting the adoption of gas turbines in naval applications. Heightened geopolitical tensions and the imperative for modernized naval fleets also contribute to market expansion. Main gas turbines are expected to lead market share due to their critical role in propulsion, with naval carriers and destroyers representing the largest vessel segments. Leading companies such as General Electric, Rolls-Royce, and Mitsubishi Heavy Industries command substantial market share through their expertise and product offerings. Challenges include high initial investment and maintenance costs, alongside volatile raw material prices.

Naval Gas Turbine Market Market Size (In Million)

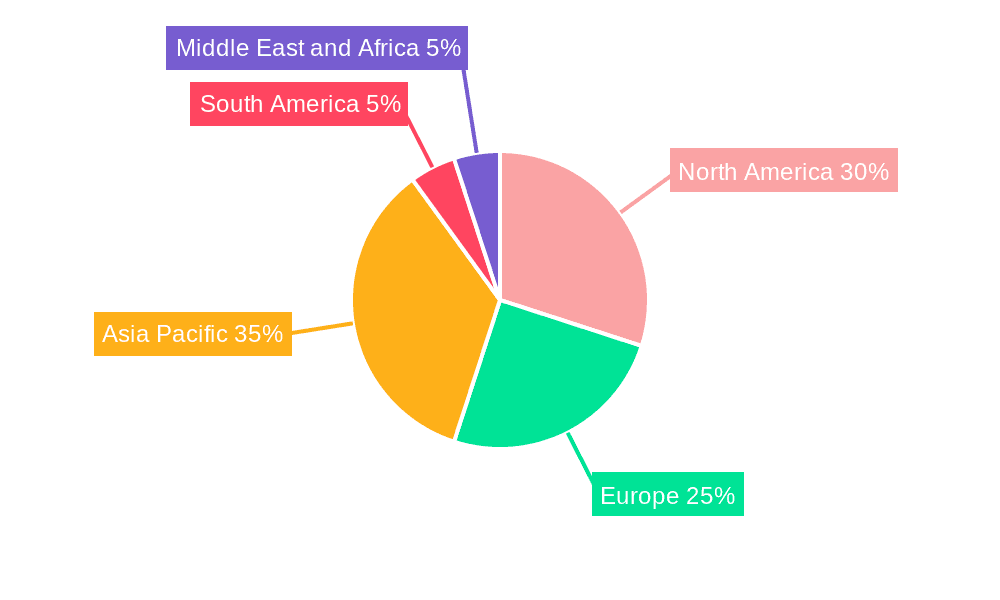
The Asia-Pacific region, particularly China, India, and Japan, is anticipated to lead market growth, fueled by substantial investments in naval modernization. North America and Europe, currently holding significant market share, are expected to experience moderate growth. This regional growth differential is influenced by varying levels of naval investment and technological adoption. The competitive landscape remains dynamic, with established players focusing on innovation and strategic collaborations, while smaller firms target niche opportunities. The forecast period of 2025-2033 anticipates a consistent increase in market value, driven by the ongoing modernization of global naval capabilities and technological progress.
Naval Gas Turbine Market Company Market Share
Naval Gas Turbine Market: A Comprehensive Report (2019-2033)
This in-depth report provides a comprehensive analysis of the Naval Gas Turbine Market, offering valuable insights for industry professionals, investors, and strategic decision-makers. Covering the period from 2019 to 2033, with a base year of 2025 and a forecast period from 2025 to 2033, this report meticulously examines market dynamics, technological advancements, and competitive landscapes. The report is structured to provide actionable insights and includes detailed segmentation by application and vessel type, along with an analysis of key players and future market outlook.
Naval Gas Turbine Market Structure & Innovation Trends
This section analyzes the market concentration, highlighting the leading players and their respective market shares. We explore the key innovation drivers shaping the industry, including advancements in materials science, propulsion technologies, and digitalization. The report examines the regulatory landscape and its influence on market growth, analyzes the impact of product substitutes, delves into end-user demographics and their evolving needs, and reviews significant M&A activities within the sector, providing insights into deal values and their strategic implications. The competitive intensity will be assessed through metrics such as the Herfindahl-Hirschman Index (HHI), and the report will identify potential future M&A targets based on market positioning and technology portfolios. Market share data will be presented for key players like General Electric, Rolls Royce, and Mitsubishi Heavy Industries, along with an overview of the overall market concentration. Estimated M&A deal values for the period 2019-2024 will be provided, with projections for 2025-2033.
Naval Gas Turbine Market Dynamics & Trends
This section provides a detailed examination of the key factors driving market growth. We analyze the impact of increasing defense budgets globally, the rising demand for advanced naval capabilities, and the technological advancements leading to improved fuel efficiency and performance. The report will also explore challenges such as geopolitical instability, fluctuating fuel prices, and the evolving technological landscape. We will evaluate the market's Compound Annual Growth Rate (CAGR) during the historical period (2019-2024) and project the CAGR for the forecast period (2025-2033). Market penetration rates for various gas turbine technologies across different naval vessel types will be examined. Further, the impact of consumer preferences (e.g., demand for enhanced operational capabilities and reduced environmental footprint) on market dynamics will be assessed, along with a competitive analysis focusing on strategies employed by key players.
Dominant Regions & Segments in Naval Gas Turbine Market
This section identifies the dominant regions and segments within the Naval Gas Turbine Market. We analyze market performance by application (Gas Turbine Generators, Main Gas Turbines) and vessel type (Naval Carriers, Destroyers, Frigates, Other Vessel Types). We will highlight the key drivers influencing growth within these segments and regions.
- Leading Region/Country: [Name of leading region/country - xx]
- Dominant Segment (Application): [Dominant Application Segment - xx with justification]
- Dominant Segment (Vessel Type): [Dominant Vessel Type Segment - xx with justification]
The analysis will encompass macroeconomic factors (e.g., economic growth, defense spending), geopolitical factors, and technological advancements influencing market dominance in each region and segment. For instance, the high defense budget of a particular country may drive significant demand for naval gas turbines, while technological advancements in a specific application may lead to its increased adoption.
Naval Gas Turbine Market Product Innovations
This section summarizes recent product developments and technological advancements within the naval gas turbine market. We focus on innovations enhancing fuel efficiency, reducing emissions, improving reliability, and augmenting power output. The discussion will include an evaluation of the market fit of these innovations and their competitive advantages. Key technological trends, such as the integration of advanced materials and digital technologies, will be highlighted.
Report Scope & Segmentation Analysis
This report provides a detailed segmentation of the Naval Gas Turbine Market based on application and vessel type.
By Application:
- Gas Turbine Generators: This segment’s analysis includes market size, growth projections, competitive dynamics, and key players.
- Main Gas Turbines: This segment’s analysis includes market size, growth projections, competitive dynamics, and key players.
By Vessel Type:
- Naval Carriers: This segment’s analysis includes market size, growth projections, competitive dynamics, and key players.
- Destroyers: This segment’s analysis includes market size, growth projections, competitive dynamics, and key players.
- Frigates: This segment’s analysis includes market size, growth projections, competitive dynamics, and key players.
- Other Vessel Types (Patrol Boats, Corvette, and Cruisers): This segment’s analysis includes market size, growth projections, competitive dynamics, and key players.
Key Drivers of Naval Gas Turbine Market Growth
The growth of the naval gas turbine market is driven by several factors. Increased defense budgets globally are a primary driver, alongside the growing demand for advanced naval capabilities and modernization of existing fleets. Technological advancements leading to more fuel-efficient and powerful gas turbines further stimulate market growth. Stringent emission regulations also push for the adoption of cleaner technologies.
Challenges in the Naval Gas Turbine Market Sector
The Naval Gas Turbine Market faces several challenges, including fluctuating fuel prices, which can impact operational costs. Supply chain disruptions can also affect production and delivery schedules. The intense competition among established players and the emergence of new entrants pose a significant challenge. Moreover, stringent regulatory requirements for emissions and safety necessitate significant investments in R&D and compliance.
Emerging Opportunities in Naval Gas Turbine Market
Emerging opportunities lie in the development and adoption of advanced technologies such as hybrid propulsion systems and the integration of digital technologies for enhanced operational efficiency and predictive maintenance. Growth is also expected in the development of smaller, more efficient turbines for use in smaller naval vessels. Expanding into new markets, particularly in developing nations with growing naval forces, presents significant potential.
Leading Players in the Naval Gas Turbine Market Market
- General Electric
- Rolls Royce
- Mitsubishi Heavy Industries
- OPRA Turbine
- BHEL (Bharat Heavy Electronics Limited)
- Solar Turbines
- Vericor Power Systems
- Siemens Energy
- Kawasaki Heavy Industries Ltd
- IHI Power Systems Co Ltd
Key Developments in Naval Gas Turbine Market Industry
- [Month, Year]: [Development 1 - e.g., General Electric launches new gas turbine model]
- [Month, Year]: [Development 2 - e.g., Rolls Royce secures a major contract for naval gas turbines]
- [Month, Year]: [Development 3 - e.g., Merger between two smaller players]
- [Month, Year]: [Development 4 - e.g., New emission regulations implemented in [Region]]
Future Outlook for Naval Gas Turbine Market Market
The Naval Gas Turbine Market is poised for continued growth, driven by increasing global defense spending, technological advancements, and the need for modernized naval fleets. Strategic partnerships, investments in R&D, and expansion into new markets will be critical for success. The focus on fuel efficiency, reduced emissions, and enhanced performance will continue to shape the market's future. The market is projected to reach xx Million by 2033.
Naval Gas Turbine Market Segmentation
-
1. Vessel Type
- 1.1. Naval Carriers
- 1.2. Destroyers
- 1.3. Frigates
- 1.4. Other Ve
-
2. Application
- 2.1. Gas Turbine Generators
- 2.2. Main Gas Turbines
Naval Gas Turbine Market Segmentation By Geography
-
1. North America
- 1.1. United States
- 1.2. Canada
-
2. Europe
- 2.1. Germany
- 2.2. United Kingdom
- 2.3. France
- 2.4. Russia
- 2.5. Rest of Europe
-
3. Asia Pacific
- 3.1. India
- 3.2. China
- 3.3. Japan
- 3.4. Rest of Asia Pacific
-
4. Latin America
- 4.1. Brazil
- 4.2. Rest of Latin America
-
5. Middle East and Africa
- 5.1. United Arab Emirates
- 5.2. Saudi Arabia
- 5.3. Rest of Middle East and Africa
Naval Gas Turbine Market Regional Market Share
Geographic Coverage of Naval Gas Turbine Market
Naval Gas Turbine Market REPORT HIGHLIGHTS
| Aspects | Details |
|---|---|
| Study Period | 2020-2034 |
| Base Year | 2025 |
| Estimated Year | 2026 |
| Forecast Period | 2026-2034 |
| Historical Period | 2020-2025 |
| Growth Rate | CAGR of 4.7% from 2020-2034 |
| Segmentation |
|
Table of Contents
- 1. Introduction
- 1.1. Research Scope
- 1.2. Market Segmentation
- 1.3. Research Methodology
- 1.4. Definitions and Assumptions
- 2. Executive Summary
- 2.1. Introduction
- 3. Market Dynamics
- 3.1. Introduction
- 3.2. Market Drivers
- 3.3. Market Restrains
- 3.4. Market Trends
- 3.4.1. Destroyers Is Expected To Witness Significant Growth During The Forecast Period
- 4. Market Factor Analysis
- 4.1. Porters Five Forces
- 4.2. Supply/Value Chain
- 4.3. PESTEL analysis
- 4.4. Market Entropy
- 4.5. Patent/Trademark Analysis
- 5. Global Naval Gas Turbine Market Analysis, Insights and Forecast, 2020-2032
- 5.1. Market Analysis, Insights and Forecast - by Vessel Type
- 5.1.1. Naval Carriers
- 5.1.2. Destroyers
- 5.1.3. Frigates
- 5.1.4. Other Ve
- 5.2. Market Analysis, Insights and Forecast - by Application
- 5.2.1. Gas Turbine Generators
- 5.2.2. Main Gas Turbines
- 5.3. Market Analysis, Insights and Forecast - by Region
- 5.3.1. North America
- 5.3.2. Europe
- 5.3.3. Asia Pacific
- 5.3.4. Latin America
- 5.3.5. Middle East and Africa
- 5.1. Market Analysis, Insights and Forecast - by Vessel Type
- 6. North America Naval Gas Turbine Market Analysis, Insights and Forecast, 2020-2032
- 6.1. Market Analysis, Insights and Forecast - by Vessel Type
- 6.1.1. Naval Carriers
- 6.1.2. Destroyers
- 6.1.3. Frigates
- 6.1.4. Other Ve
- 6.2. Market Analysis, Insights and Forecast - by Application
- 6.2.1. Gas Turbine Generators
- 6.2.2. Main Gas Turbines
- 6.1. Market Analysis, Insights and Forecast - by Vessel Type
- 7. Europe Naval Gas Turbine Market Analysis, Insights and Forecast, 2020-2032
- 7.1. Market Analysis, Insights and Forecast - by Vessel Type
- 7.1.1. Naval Carriers
- 7.1.2. Destroyers
- 7.1.3. Frigates
- 7.1.4. Other Ve
- 7.2. Market Analysis, Insights and Forecast - by Application
- 7.2.1. Gas Turbine Generators
- 7.2.2. Main Gas Turbines
- 7.1. Market Analysis, Insights and Forecast - by Vessel Type
- 8. Asia Pacific Naval Gas Turbine Market Analysis, Insights and Forecast, 2020-2032
- 8.1. Market Analysis, Insights and Forecast - by Vessel Type
- 8.1.1. Naval Carriers
- 8.1.2. Destroyers
- 8.1.3. Frigates
- 8.1.4. Other Ve
- 8.2. Market Analysis, Insights and Forecast - by Application
- 8.2.1. Gas Turbine Generators
- 8.2.2. Main Gas Turbines
- 8.1. Market Analysis, Insights and Forecast - by Vessel Type
- 9. Latin America Naval Gas Turbine Market Analysis, Insights and Forecast, 2020-2032
- 9.1. Market Analysis, Insights and Forecast - by Vessel Type
- 9.1.1. Naval Carriers
- 9.1.2. Destroyers
- 9.1.3. Frigates
- 9.1.4. Other Ve
- 9.2. Market Analysis, Insights and Forecast - by Application
- 9.2.1. Gas Turbine Generators
- 9.2.2. Main Gas Turbines
- 9.1. Market Analysis, Insights and Forecast - by Vessel Type
- 10. Middle East and Africa Naval Gas Turbine Market Analysis, Insights and Forecast, 2020-2032
- 10.1. Market Analysis, Insights and Forecast - by Vessel Type
- 10.1.1. Naval Carriers
- 10.1.2. Destroyers
- 10.1.3. Frigates
- 10.1.4. Other Ve
- 10.2. Market Analysis, Insights and Forecast - by Application
- 10.2.1. Gas Turbine Generators
- 10.2.2. Main Gas Turbines
- 10.1. Market Analysis, Insights and Forecast - by Vessel Type
- 11. Competitive Analysis
- 11.1. Global Market Share Analysis 2025
- 11.2. Company Profiles
- 11.2.1 General Electric
- 11.2.1.1. Overview
- 11.2.1.2. Products
- 11.2.1.3. SWOT Analysis
- 11.2.1.4. Recent Developments
- 11.2.1.5. Financials (Based on Availability)
- 11.2.2 Rolls Royce
- 11.2.2.1. Overview
- 11.2.2.2. Products
- 11.2.2.3. SWOT Analysis
- 11.2.2.4. Recent Developments
- 11.2.2.5. Financials (Based on Availability)
- 11.2.3 Mitsubishi Heavy Industries
- 11.2.3.1. Overview
- 11.2.3.2. Products
- 11.2.3.3. SWOT Analysis
- 11.2.3.4. Recent Developments
- 11.2.3.5. Financials (Based on Availability)
- 11.2.4 OPRA Turbine
- 11.2.4.1. Overview
- 11.2.4.2. Products
- 11.2.4.3. SWOT Analysis
- 11.2.4.4. Recent Developments
- 11.2.4.5. Financials (Based on Availability)
- 11.2.5 BHEL (Bharat Heavy Electronics Limited)
- 11.2.5.1. Overview
- 11.2.5.2. Products
- 11.2.5.3. SWOT Analysis
- 11.2.5.4. Recent Developments
- 11.2.5.5. Financials (Based on Availability)
- 11.2.6 Solar Turbines
- 11.2.6.1. Overview
- 11.2.6.2. Products
- 11.2.6.3. SWOT Analysis
- 11.2.6.4. Recent Developments
- 11.2.6.5. Financials (Based on Availability)
- 11.2.7 Vericor Power Systems*List Not Exhaustive
- 11.2.7.1. Overview
- 11.2.7.2. Products
- 11.2.7.3. SWOT Analysis
- 11.2.7.4. Recent Developments
- 11.2.7.5. Financials (Based on Availability)
- 11.2.8 Siemens Energy
- 11.2.8.1. Overview
- 11.2.8.2. Products
- 11.2.8.3. SWOT Analysis
- 11.2.8.4. Recent Developments
- 11.2.8.5. Financials (Based on Availability)
- 11.2.9 Kawasaki Heavy Industries Ltd
- 11.2.9.1. Overview
- 11.2.9.2. Products
- 11.2.9.3. SWOT Analysis
- 11.2.9.4. Recent Developments
- 11.2.9.5. Financials (Based on Availability)
- 11.2.10 IHI Power Systems Co Ltd
- 11.2.10.1. Overview
- 11.2.10.2. Products
- 11.2.10.3. SWOT Analysis
- 11.2.10.4. Recent Developments
- 11.2.10.5. Financials (Based on Availability)
- 11.2.1 General Electric
List of Figures
- Figure 1: Global Naval Gas Turbine Market Revenue Breakdown (million, %) by Region 2025 & 2033
- Figure 2: North America Naval Gas Turbine Market Revenue (million), by Vessel Type 2025 & 2033
- Figure 3: North America Naval Gas Turbine Market Revenue Share (%), by Vessel Type 2025 & 2033
- Figure 4: North America Naval Gas Turbine Market Revenue (million), by Application 2025 & 2033
- Figure 5: North America Naval Gas Turbine Market Revenue Share (%), by Application 2025 & 2033
- Figure 6: North America Naval Gas Turbine Market Revenue (million), by Country 2025 & 2033
- Figure 7: North America Naval Gas Turbine Market Revenue Share (%), by Country 2025 & 2033
- Figure 8: Europe Naval Gas Turbine Market Revenue (million), by Vessel Type 2025 & 2033
- Figure 9: Europe Naval Gas Turbine Market Revenue Share (%), by Vessel Type 2025 & 2033
- Figure 10: Europe Naval Gas Turbine Market Revenue (million), by Application 2025 & 2033
- Figure 11: Europe Naval Gas Turbine Market Revenue Share (%), by Application 2025 & 2033
- Figure 12: Europe Naval Gas Turbine Market Revenue (million), by Country 2025 & 2033
- Figure 13: Europe Naval Gas Turbine Market Revenue Share (%), by Country 2025 & 2033
- Figure 14: Asia Pacific Naval Gas Turbine Market Revenue (million), by Vessel Type 2025 & 2033
- Figure 15: Asia Pacific Naval Gas Turbine Market Revenue Share (%), by Vessel Type 2025 & 2033
- Figure 16: Asia Pacific Naval Gas Turbine Market Revenue (million), by Application 2025 & 2033
- Figure 17: Asia Pacific Naval Gas Turbine Market Revenue Share (%), by Application 2025 & 2033
- Figure 18: Asia Pacific Naval Gas Turbine Market Revenue (million), by Country 2025 & 2033
- Figure 19: Asia Pacific Naval Gas Turbine Market Revenue Share (%), by Country 2025 & 2033
- Figure 20: Latin America Naval Gas Turbine Market Revenue (million), by Vessel Type 2025 & 2033
- Figure 21: Latin America Naval Gas Turbine Market Revenue Share (%), by Vessel Type 2025 & 2033
- Figure 22: Latin America Naval Gas Turbine Market Revenue (million), by Application 2025 & 2033
- Figure 23: Latin America Naval Gas Turbine Market Revenue Share (%), by Application 2025 & 2033
- Figure 24: Latin America Naval Gas Turbine Market Revenue (million), by Country 2025 & 2033
- Figure 25: Latin America Naval Gas Turbine Market Revenue Share (%), by Country 2025 & 2033
- Figure 26: Middle East and Africa Naval Gas Turbine Market Revenue (million), by Vessel Type 2025 & 2033
- Figure 27: Middle East and Africa Naval Gas Turbine Market Revenue Share (%), by Vessel Type 2025 & 2033
- Figure 28: Middle East and Africa Naval Gas Turbine Market Revenue (million), by Application 2025 & 2033
- Figure 29: Middle East and Africa Naval Gas Turbine Market Revenue Share (%), by Application 2025 & 2033
- Figure 30: Middle East and Africa Naval Gas Turbine Market Revenue (million), by Country 2025 & 2033
- Figure 31: Middle East and Africa Naval Gas Turbine Market Revenue Share (%), by Country 2025 & 2033
List of Tables
- Table 1: Global Naval Gas Turbine Market Revenue million Forecast, by Vessel Type 2020 & 2033
- Table 2: Global Naval Gas Turbine Market Revenue million Forecast, by Application 2020 & 2033
- Table 3: Global Naval Gas Turbine Market Revenue million Forecast, by Region 2020 & 2033
- Table 4: Global Naval Gas Turbine Market Revenue million Forecast, by Vessel Type 2020 & 2033
- Table 5: Global Naval Gas Turbine Market Revenue million Forecast, by Application 2020 & 2033
- Table 6: Global Naval Gas Turbine Market Revenue million Forecast, by Country 2020 & 2033
- Table 7: United States Naval Gas Turbine Market Revenue (million) Forecast, by Application 2020 & 2033
- Table 8: Canada Naval Gas Turbine Market Revenue (million) Forecast, by Application 2020 & 2033
- Table 9: Global Naval Gas Turbine Market Revenue million Forecast, by Vessel Type 2020 & 2033
- Table 10: Global Naval Gas Turbine Market Revenue million Forecast, by Application 2020 & 2033
- Table 11: Global Naval Gas Turbine Market Revenue million Forecast, by Country 2020 & 2033
- Table 12: Germany Naval Gas Turbine Market Revenue (million) Forecast, by Application 2020 & 2033
- Table 13: United Kingdom Naval Gas Turbine Market Revenue (million) Forecast, by Application 2020 & 2033
- Table 14: France Naval Gas Turbine Market Revenue (million) Forecast, by Application 2020 & 2033
- Table 15: Russia Naval Gas Turbine Market Revenue (million) Forecast, by Application 2020 & 2033
- Table 16: Rest of Europe Naval Gas Turbine Market Revenue (million) Forecast, by Application 2020 & 2033
- Table 17: Global Naval Gas Turbine Market Revenue million Forecast, by Vessel Type 2020 & 2033
- Table 18: Global Naval Gas Turbine Market Revenue million Forecast, by Application 2020 & 2033
- Table 19: Global Naval Gas Turbine Market Revenue million Forecast, by Country 2020 & 2033
- Table 20: India Naval Gas Turbine Market Revenue (million) Forecast, by Application 2020 & 2033
- Table 21: China Naval Gas Turbine Market Revenue (million) Forecast, by Application 2020 & 2033
- Table 22: Japan Naval Gas Turbine Market Revenue (million) Forecast, by Application 2020 & 2033
- Table 23: Rest of Asia Pacific Naval Gas Turbine Market Revenue (million) Forecast, by Application 2020 & 2033
- Table 24: Global Naval Gas Turbine Market Revenue million Forecast, by Vessel Type 2020 & 2033
- Table 25: Global Naval Gas Turbine Market Revenue million Forecast, by Application 2020 & 2033
- Table 26: Global Naval Gas Turbine Market Revenue million Forecast, by Country 2020 & 2033
- Table 27: Brazil Naval Gas Turbine Market Revenue (million) Forecast, by Application 2020 & 2033
- Table 28: Rest of Latin America Naval Gas Turbine Market Revenue (million) Forecast, by Application 2020 & 2033
- Table 29: Global Naval Gas Turbine Market Revenue million Forecast, by Vessel Type 2020 & 2033
- Table 30: Global Naval Gas Turbine Market Revenue million Forecast, by Application 2020 & 2033
- Table 31: Global Naval Gas Turbine Market Revenue million Forecast, by Country 2020 & 2033
- Table 32: United Arab Emirates Naval Gas Turbine Market Revenue (million) Forecast, by Application 2020 & 2033
- Table 33: Saudi Arabia Naval Gas Turbine Market Revenue (million) Forecast, by Application 2020 & 2033
- Table 34: Rest of Middle East and Africa Naval Gas Turbine Market Revenue (million) Forecast, by Application 2020 & 2033
Frequently Asked Questions
1. What is the projected Compound Annual Growth Rate (CAGR) of the Naval Gas Turbine Market?
The projected CAGR is approximately 4.7%.
2. Which companies are prominent players in the Naval Gas Turbine Market?
Key companies in the market include General Electric, Rolls Royce, Mitsubishi Heavy Industries, OPRA Turbine, BHEL (Bharat Heavy Electronics Limited), Solar Turbines, Vericor Power Systems*List Not Exhaustive, Siemens Energy, Kawasaki Heavy Industries Ltd, IHI Power Systems Co Ltd.
3. What are the main segments of the Naval Gas Turbine Market?
The market segments include Vessel Type, Application.
4. Can you provide details about the market size?
The market size is estimated to be USD 585.96 million as of 2022.
5. What are some drivers contributing to market growth?
N/A
6. What are the notable trends driving market growth?
Destroyers Is Expected To Witness Significant Growth During The Forecast Period.
7. Are there any restraints impacting market growth?
N/A
8. Can you provide examples of recent developments in the market?
N/A
9. What pricing options are available for accessing the report?
Pricing options include single-user, multi-user, and enterprise licenses priced at USD 4750, USD 5250, and USD 8750 respectively.
10. Is the market size provided in terms of value or volume?
The market size is provided in terms of value, measured in million.
11. Are there any specific market keywords associated with the report?
Yes, the market keyword associated with the report is "Naval Gas Turbine Market," which aids in identifying and referencing the specific market segment covered.
12. How do I determine which pricing option suits my needs best?
The pricing options vary based on user requirements and access needs. Individual users may opt for single-user licenses, while businesses requiring broader access may choose multi-user or enterprise licenses for cost-effective access to the report.
13. Are there any additional resources or data provided in the Naval Gas Turbine Market report?
While the report offers comprehensive insights, it's advisable to review the specific contents or supplementary materials provided to ascertain if additional resources or data are available.
14. How can I stay updated on further developments or reports in the Naval Gas Turbine Market?
To stay informed about further developments, trends, and reports in the Naval Gas Turbine Market, consider subscribing to industry newsletters, following relevant companies and organizations, or regularly checking reputable industry news sources and publications.
Methodology
Step 1 - Identification of Relevant Samples Size from Population Database


Step 2 - Approaches for Defining Global Market Size (Value, Volume* & Price*)

Note*: In applicable scenarios
Step 3 - Data Sources
Primary Research
- Web Analytics
- Survey Reports
- Research Institute
- Latest Research Reports
- Opinion Leaders
Secondary Research
- Annual Reports
- White Paper
- Latest Press Release
- Industry Association
- Paid Database
- Investor Presentations

Step 4 - Data Triangulation
Involves using different sources of information in order to increase the validity of a study
These sources are likely to be stakeholders in a program - participants, other researchers, program staff, other community members, and so on.
Then we put all data in single framework & apply various statistical tools to find out the dynamic on the market.
During the analysis stage, feedback from the stakeholder groups would be compared to determine areas of agreement as well as areas of divergence