

Key Insights
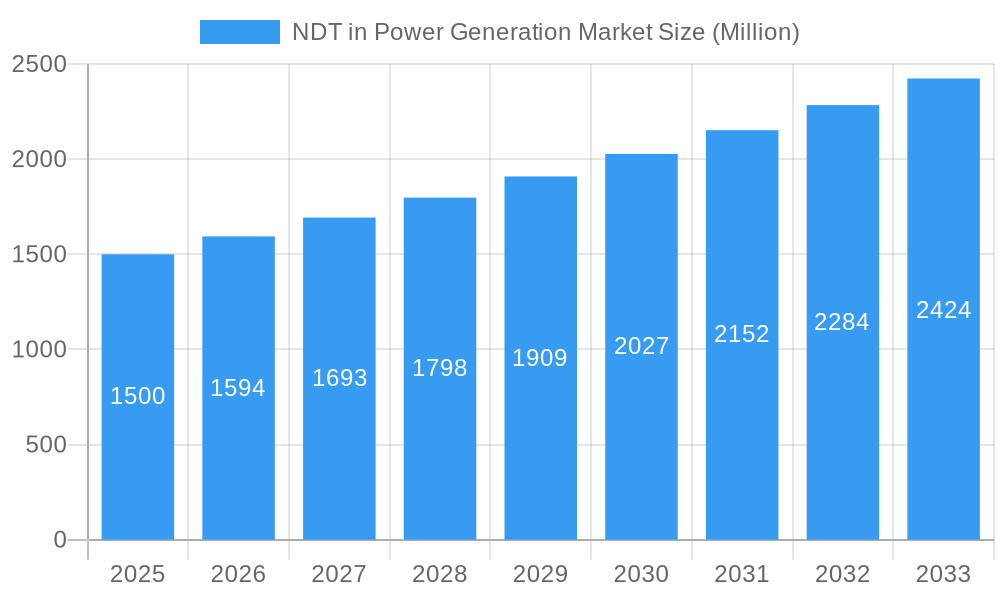
The Non-Destructive Testing (NDT) market for power generation is poised for significant expansion, driven by stringent safety mandates, the aging infrastructure of global power plants requiring enhanced inspection frequencies, and the escalating demand for reliable, efficient energy solutions. This market is projected to grow at a Compound Annual Growth Rate (CAGR) of 6.24% from a base year of 2025. The market size was valued at $4.18 billion in the base year and is expected to witness substantial growth by 2033. Key growth catalysts include the imperative for regular NDT to prevent operational failures in aging power infrastructure, technological advancements offering more precise inspection methods, and the increasing adoption of predictive maintenance strategies within the sector.
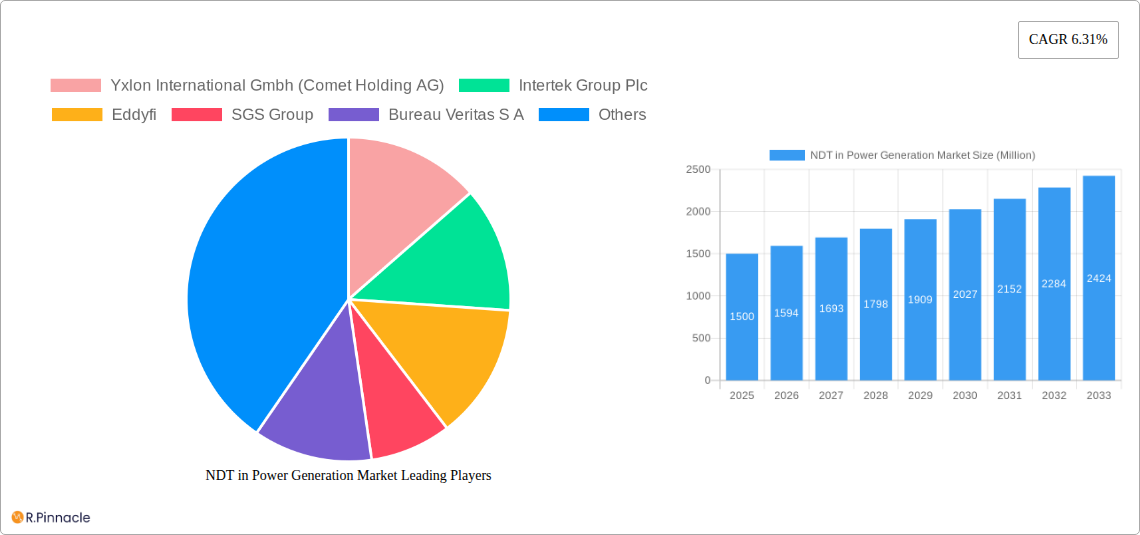
NDT in Power Generation Market Market Size (In Billion)
Market growth is moderated by factors such as the substantial upfront investment in NDT equipment and the requirement for specialized technical expertise, which can pose entry barriers. Regional regulatory disparities also present complexities for market standardization. The market is segmented into NDT services and equipment, with testing technologies including radiography, ultrasonic, visual, and eddy current methods. The services segment is anticipated to lead market share due to increasing outsourcing by power generation entities. Prominent market participants like Yxlon International GmbH, Intertek, Eddyfi, SGS Group, and Bureau Veritas are actively enhancing their service portfolios and technological offerings. Geographic expansion is expected across North America, Europe, Asia-Pacific, Latin America, and the Middle East & Africa, with regions characterized by older infrastructure and substantial power generation capacity experiencing accelerated market penetration.
NDT in Power Generation Market Company Market Share
NDT in Power Generation Market: A Comprehensive Report (2019-2033)
This in-depth report provides a comprehensive analysis of the Non-Destructive Testing (NDT) market within the power generation sector, covering the period from 2019 to 2033. The report offers actionable insights for industry professionals, investors, and stakeholders seeking to understand the market's structure, dynamics, and future potential. With a focus on key players like Yxlon International Gmbh (Comet Holding AG), Intertek Group Plc, Eddyfi, SGS Group, Bureau Veritas S A, Fujifilm Corporation, Mistras Group Inc, Zetec Inc, Applus+ Services Technologies S L, Baker Hughes Company, Team Inc, and Olympus Corporation (list not exhaustive), this report provides a detailed view of the competitive landscape and future trends. The estimated market size in 2025 is valued at xx Million and is projected to experience significant growth during the forecast period (2025-2033).
NDT in Power Generation Market Market Structure & Innovation Trends
The NDT market in power generation exhibits a moderately concentrated structure, with several large multinational corporations holding significant market share. However, smaller specialized firms and emerging players also contribute to the overall market dynamics. Innovation in NDT is driven by the need for improved inspection efficiency, enhanced accuracy, and the adoption of advanced technologies. Strict regulatory frameworks, particularly within the nuclear power sector, play a significant role in shaping market practices and driving demand for sophisticated NDT solutions. Product substitutes are limited, primarily focusing on advancements within existing technologies rather than entirely new inspection methods. The end-user demographics consist primarily of power generation companies, including utilities, independent power producers (IPPs), and original equipment manufacturers (OEMs).
- Market Concentration: The top 5 companies collectively hold an estimated xx% market share in 2025.
- M&A Activity: Significant M&A activity has been observed, with deals valued at xx Million in the last five years, primarily driven by the desire for expansion into new markets and technological capabilities. Examples include Applus+'s acquisition of Inecosa and Adícora in 2021.
- Innovation Drivers: Increased demand for higher inspection efficiency, improved accuracy, and the integration of AI and automation are key drivers of innovation.
- Regulatory Framework: Stringent regulations in various regions, especially for nuclear power plants, mandate the use of NDT and drive demand for compliant technologies.
NDT in Power Generation Market Market Dynamics & Trends
The NDT market in power generation is projected to experience a Compound Annual Growth Rate (CAGR) of xx% during the forecast period (2025-2033), driven by factors such as aging power infrastructure requiring increased inspection, the rising adoption of renewable energy sources, and stringent safety regulations. Technological disruptions, particularly the integration of AI and automation in NDT technologies, are transforming inspection processes, improving efficiency, and reducing costs. Market penetration of advanced NDT techniques like AI-powered ultrasonic testing is steadily increasing, currently at approximately xx% in 2025. This growth is further fueled by increasing consumer preference for improved reliability, reduced downtime, and enhanced safety. Competitive dynamics are characterized by continuous product innovation, strategic partnerships, and acquisitions.
Dominant Regions & Segments in NDT in Power Generation Market
North America currently dominates the NDT market in power generation, driven by substantial investments in infrastructure upgrades and stringent safety regulations. Within the market segmentation:
Type:
- Services: The services segment holds the largest share, driven by the outsourcing of inspection needs by power generation companies.
- Equipment: The equipment segment shows moderate growth, driven by the increasing demand for advanced NDT equipment.
Testing Technology:
- Ultrasonic Testing: Remains the dominant testing technology due to its versatility and effectiveness in detecting various flaws.
- Radiography Testing: Holds a significant market share, particularly in applications requiring high-resolution imaging.
- Eddy Current Testing: Shows substantial growth potential due to its suitability for detecting surface and near-surface flaws.
- Visual Inspection Testing: While a more traditional method, it maintains a significant presence, particularly for initial assessments.
- Other Testing Technologies: This segment encompasses emerging technologies and niche applications showing promising growth.
Key Drivers:
- Strong economic growth in North America.
- Stringent safety regulations.
- High investments in infrastructure upgrades and maintenance.
- Extensive R&D activity in advanced NDT technologies.
NDT in Power Generation Market Product Innovations
Recent product developments focus on the integration of AI and machine learning algorithms into NDT systems. These advancements offer improved accuracy, automated defect recognition, and reduced inspection time. New applications are emerging in the inspection of renewable energy assets, such as wind turbines and solar farms, driven by the growing need for reliable and efficient inspections in these sectors. Competitive advantages stem from enhanced accuracy, increased efficiency, ease of use, and the integration of advanced data analysis capabilities.
Report Scope & Segmentation Analysis
This report segments the NDT in power generation market by Type (Services, Equipment) and Testing Technology (Radiography Testing, Ultrasonic Testing, Visual Inspection Testing, Eddy Current Testing, Other Testing Technologies). Each segment is analyzed based on its historical performance, current market size, projected growth, and competitive dynamics. The report projects significant growth across all segments, with Ultrasonic and Eddy Current Testing expected to witness the fastest growth rates during the forecast period.
Key Drivers of NDT in Power Generation Market Growth
Several key factors drive the growth of the NDT market in power generation. Aging infrastructure necessitates regular and thorough inspections. The increasing adoption of renewable energy sources introduces new inspection requirements for wind turbines, solar panels, and other technologies. Stringent safety regulations and standards mandate regular NDT inspections, particularly in nuclear power plants, further driving market growth. Finally, advancements in NDT technology, such as AI-powered systems, improve inspection efficiency and accuracy, leading to wider adoption.
Challenges in the NDT in Power Generation Market Sector
The NDT market faces challenges such as high initial investment costs for advanced equipment, the need for skilled technicians, and potential supply chain disruptions impacting the availability of specialized components. Furthermore, stringent regulatory compliance requirements can pose hurdles for smaller companies entering the market. Competitive pressure from established players with established market positions and extensive technological capabilities adds to these challenges. These factors collectively impact the market's overall growth, although the predicted CAGR remains positive.
Emerging Opportunities in NDT in Power Generation Market
Emerging opportunities include the expansion of NDT services into new sectors, such as offshore wind power and hydrogen energy. The adoption of robotics and automation in NDT inspections offers further efficiency gains. Developing countries' increasing investments in power generation infrastructure create substantial growth potential. Finally, advancements in data analytics and cloud computing enhance the value proposition of NDT data, unlocking new opportunities for predictive maintenance and optimized asset management.
Leading Players in the NDT in Power Generation Market Market
Key Developments in NDT in Power Generation Market Industry
- June 2022: ALEIA, Omexom NDT Engineering & Services, and LAUM UMR CNRS launch the AUTEND project, utilizing AI to accelerate nuclear power plant inspections using eddy current and ultrasonic testing methods. This signifies a major shift towards AI-driven NDT.
- April 2021: IR Supplies and Services partner with Creative Electron, expanding their NDT service offerings in Canada and improving inspection standards for power generation organizations. This enhances the availability of high-quality NDT services in the region.
- March 2021: Applus+ acquires Inecosa and Adícora, strengthening its position in the power generation market and expanding its capabilities in renewable energy. This acquisition demonstrates the consolidation within the industry and increased focus on renewables.
Future Outlook for NDT in Power Generation Market Market
The future outlook for the NDT market in power generation is highly positive, driven by continuous technological advancements, stringent regulatory compliance needs, and the increasing focus on renewable energy sources. The integration of AI and machine learning will further enhance the efficiency and accuracy of NDT inspections. Strategic partnerships and M&A activities will continue to shape the market landscape. The market is poised for significant growth, fueled by both technological innovation and the growing demand for reliable and efficient power generation infrastructure.
NDT in Power Generation Market Segmentation
-
1. Type
- 1.1. Services
- 1.2. Equipment
-
2. Testing Technology
- 2.1. Radiography Testing
- 2.2. Ultrasonic Testing
- 2.3. Visual Inspection Testing
- 2.4. Eddy Current Testing
- 2.5. Other Testing Technologies
NDT in Power Generation Market Segmentation By Geography
-
1. North America
- 1.1. United States
- 1.2. Canada
-
2. Europe
- 2.1. United Kingdom
- 2.2. Germany
- 2.3. France
- 2.4. Rest of Europe
-
3. Asia Pacific
- 3.1. China
- 3.2. Japan
- 3.3. India
- 3.4. Rest of Asia Pacific
- 4. Latin America
- 5. Middle East and Africa
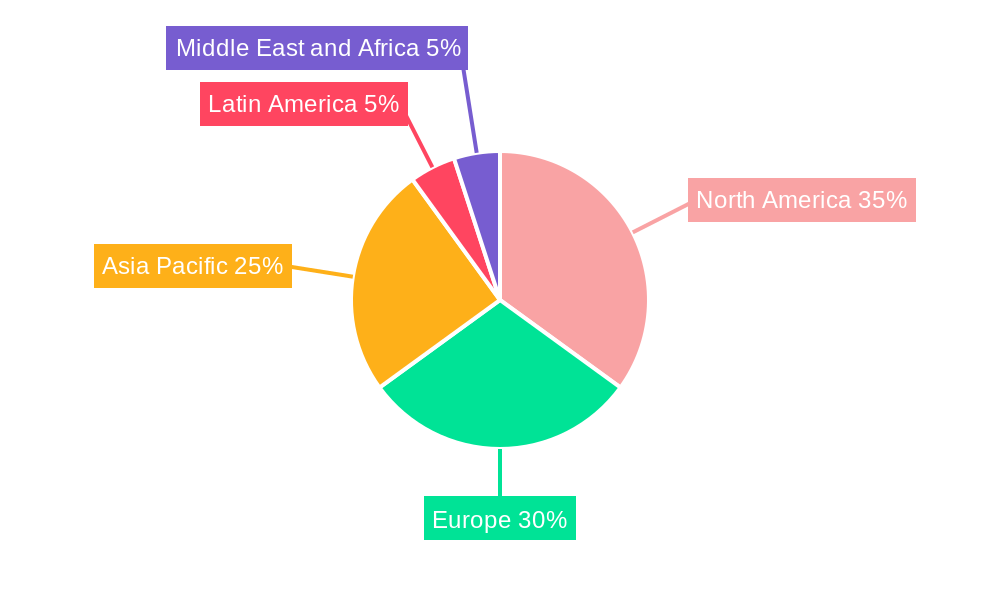
NDT in Power Generation Market Regional Market Share
Geographic Coverage of NDT in Power Generation Market
NDT in Power Generation Market REPORT HIGHLIGHTS
| Aspects | Details |
|---|---|
| Study Period | 2020-2034 |
| Base Year | 2025 |
| Estimated Year | 2026 |
| Forecast Period | 2026-2034 |
| Historical Period | 2020-2025 |
| Growth Rate | CAGR of 6.24% from 2020-2034 |
| Segmentation |
|
Table of Contents
- 1. Introduction
- 1.1. Research Scope
- 1.2. Market Segmentation
- 1.3. Research Objective
- 1.4. Definitions and Assumptions
- 2. Executive Summary
- 2.1. Market Snapshot
- 3. Market Dynamics
- 3.1. Market Drivers
- 3.2. Market Restrains
- 3.3. Market Trends
- 3.4. Market Opportunities
- 4. Market Factor Analysis
- 4.1. Porters Five Forces
- 4.1.1. Bargaining Power of Suppliers
- 4.1.2. Bargaining Power of Buyers
- 4.1.3. Threat of New Entrants
- 4.1.4. Threat of Substitutes
- 4.1.5. Competitive Rivalry
- 4.2. PESTEL analysis
- 4.3. BCG Analysis
- 4.3.1. Stars (High Growth, High Market Share)
- 4.3.2. Cash Cows (Low Growth, High Market Share)
- 4.3.3. Question Mark (High Growth, Low Market Share)
- 4.3.4. Dogs (Low Growth, Low Market Share)
- 4.4. Ansoff Matrix Analysis
- 4.5. Supply Chain Analysis
- 4.6. Regulatory Landscape
- 4.7. Current Market Potential and Opportunity Assessment (TAM–SAM–SOM Framework)
- 4.8. PRI Analyst Note
- 4.1. Porters Five Forces
- 5. Market Analysis, Insights and Forecast 2021-2033
- 5.1. Market Analysis, Insights and Forecast - by Type
- 5.1.1. Services
- 5.1.2. Equipment
- 5.2. Market Analysis, Insights and Forecast - by Testing Technology
- 5.2.1. Radiography Testing
- 5.2.2. Ultrasonic Testing
- 5.2.3. Visual Inspection Testing
- 5.2.4. Eddy Current Testing
- 5.2.5. Other Testing Technologies
- 5.3. Market Analysis, Insights and Forecast - by Region
- 5.3.1. North America
- 5.3.2. Europe
- 5.3.3. Asia Pacific
- 5.3.4. Latin America
- 5.3.5. Middle East and Africa
- 5.1. Market Analysis, Insights and Forecast - by Type
- 6. Global NDT in Power Generation Market Analysis, Insights and Forecast, 2021-2033
- 6.1. Market Analysis, Insights and Forecast - by Type
- 6.1.1. Services
- 6.1.2. Equipment
- 6.2. Market Analysis, Insights and Forecast - by Testing Technology
- 6.2.1. Radiography Testing
- 6.2.2. Ultrasonic Testing
- 6.2.3. Visual Inspection Testing
- 6.2.4. Eddy Current Testing
- 6.2.5. Other Testing Technologies
- 6.1. Market Analysis, Insights and Forecast - by Type
- 7. North America NDT in Power Generation Market Analysis, Insights and Forecast, 2020-2032
- 7.1. Market Analysis, Insights and Forecast - by Type
- 7.1.1. Services
- 7.1.2. Equipment
- 7.2. Market Analysis, Insights and Forecast - by Testing Technology
- 7.2.1. Radiography Testing
- 7.2.2. Ultrasonic Testing
- 7.2.3. Visual Inspection Testing
- 7.2.4. Eddy Current Testing
- 7.2.5. Other Testing Technologies
- 7.1. Market Analysis, Insights and Forecast - by Type
- 8. Europe NDT in Power Generation Market Analysis, Insights and Forecast, 2020-2032
- 8.1. Market Analysis, Insights and Forecast - by Type
- 8.1.1. Services
- 8.1.2. Equipment
- 8.2. Market Analysis, Insights and Forecast - by Testing Technology
- 8.2.1. Radiography Testing
- 8.2.2. Ultrasonic Testing
- 8.2.3. Visual Inspection Testing
- 8.2.4. Eddy Current Testing
- 8.2.5. Other Testing Technologies
- 8.1. Market Analysis, Insights and Forecast - by Type
- 9. Asia Pacific NDT in Power Generation Market Analysis, Insights and Forecast, 2020-2032
- 9.1. Market Analysis, Insights and Forecast - by Type
- 9.1.1. Services
- 9.1.2. Equipment
- 9.2. Market Analysis, Insights and Forecast - by Testing Technology
- 9.2.1. Radiography Testing
- 9.2.2. Ultrasonic Testing
- 9.2.3. Visual Inspection Testing
- 9.2.4. Eddy Current Testing
- 9.2.5. Other Testing Technologies
- 9.1. Market Analysis, Insights and Forecast - by Type
- 10. Latin America NDT in Power Generation Market Analysis, Insights and Forecast, 2020-2032
- 10.1. Market Analysis, Insights and Forecast - by Type
- 10.1.1. Services
- 10.1.2. Equipment
- 10.2. Market Analysis, Insights and Forecast - by Testing Technology
- 10.2.1. Radiography Testing
- 10.2.2. Ultrasonic Testing
- 10.2.3. Visual Inspection Testing
- 10.2.4. Eddy Current Testing
- 10.2.5. Other Testing Technologies
- 10.1. Market Analysis, Insights and Forecast - by Type
- 11. Middle East and Africa NDT in Power Generation Market Analysis, Insights and Forecast, 2020-2032
- 11.1. Market Analysis, Insights and Forecast - by Type
- 11.1.1. Services
- 11.1.2. Equipment
- 11.2. Market Analysis, Insights and Forecast - by Testing Technology
- 11.2.1. Radiography Testing
- 11.2.2. Ultrasonic Testing
- 11.2.3. Visual Inspection Testing
- 11.2.4. Eddy Current Testing
- 11.2.5. Other Testing Technologies
- 11.1. Market Analysis, Insights and Forecast - by Type
- 12. Competitive Analysis
- 12.1. Company Profiles
- 12.1.1 Yxlon International Gmbh (Comet Holding AG)
- 12.1.1.1. Company Overview
- 12.1.1.2. Products
- 12.1.1.3. Company Financials
- 12.1.1.4. SWOT Analysis
- 12.1.2 Intertek Group Plc
- 12.1.2.1. Company Overview
- 12.1.2.2. Products
- 12.1.2.3. Company Financials
- 12.1.2.4. SWOT Analysis
- 12.1.3 Eddyfi
- 12.1.3.1. Company Overview
- 12.1.3.2. Products
- 12.1.3.3. Company Financials
- 12.1.3.4. SWOT Analysis
- 12.1.4 SGS Group
- 12.1.4.1. Company Overview
- 12.1.4.2. Products
- 12.1.4.3. Company Financials
- 12.1.4.4. SWOT Analysis
- 12.1.5 Bureau Veritas S A
- 12.1.5.1. Company Overview
- 12.1.5.2. Products
- 12.1.5.3. Company Financials
- 12.1.5.4. SWOT Analysis
- 12.1.6 Fujifilm Corporation
- 12.1.6.1. Company Overview
- 12.1.6.2. Products
- 12.1.6.3. Company Financials
- 12.1.6.4. SWOT Analysis
- 12.1.7 Mistras Group Inc
- 12.1.7.1. Company Overview
- 12.1.7.2. Products
- 12.1.7.3. Company Financials
- 12.1.7.4. SWOT Analysis
- 12.1.8 Zetec Inc
- 12.1.8.1. Company Overview
- 12.1.8.2. Products
- 12.1.8.3. Company Financials
- 12.1.8.4. SWOT Analysis
- 12.1.9 Applus+ Services Technologies S L
- 12.1.9.1. Company Overview
- 12.1.9.2. Products
- 12.1.9.3. Company Financials
- 12.1.9.4. SWOT Analysis
- 12.1.10 Baker Hughes Company
- 12.1.10.1. Company Overview
- 12.1.10.2. Products
- 12.1.10.3. Company Financials
- 12.1.10.4. SWOT Analysis
- 12.1.11 Team Inc *List Not Exhaustive
- 12.1.11.1. Company Overview
- 12.1.11.2. Products
- 12.1.11.3. Company Financials
- 12.1.11.4. SWOT Analysis
- 12.1.12 Olympus Corporation
- 12.1.12.1. Company Overview
- 12.1.12.2. Products
- 12.1.12.3. Company Financials
- 12.1.12.4. SWOT Analysis
- 12.1.1 Yxlon International Gmbh (Comet Holding AG)
- 12.2. Market Entropy
- 12.2.1 Company's Key Areas Served
- 12.2.2 Recent Developments
- 12.3. Company Market Share Analysis 2025
- 12.3.1 Top 5 Companies Market Share Analysis
- 12.3.2 Top 3 Companies Market Share Analysis
- 12.4. List of Potential Customers
- 13. Research Methodology
List of Figures
- Figure 1: Global NDT in Power Generation Market Revenue Breakdown (billion, %) by Region 2025 & 2033
- Figure 2: North America NDT in Power Generation Market Revenue (billion), by Type 2025 & 2033
- Figure 3: North America NDT in Power Generation Market Revenue Share (%), by Type 2025 & 2033
- Figure 4: North America NDT in Power Generation Market Revenue (billion), by Testing Technology 2025 & 2033
- Figure 5: North America NDT in Power Generation Market Revenue Share (%), by Testing Technology 2025 & 2033
- Figure 6: North America NDT in Power Generation Market Revenue (billion), by Country 2025 & 2033
- Figure 7: North America NDT in Power Generation Market Revenue Share (%), by Country 2025 & 2033
- Figure 8: Europe NDT in Power Generation Market Revenue (billion), by Type 2025 & 2033
- Figure 9: Europe NDT in Power Generation Market Revenue Share (%), by Type 2025 & 2033
- Figure 10: Europe NDT in Power Generation Market Revenue (billion), by Testing Technology 2025 & 2033
- Figure 11: Europe NDT in Power Generation Market Revenue Share (%), by Testing Technology 2025 & 2033
- Figure 12: Europe NDT in Power Generation Market Revenue (billion), by Country 2025 & 2033
- Figure 13: Europe NDT in Power Generation Market Revenue Share (%), by Country 2025 & 2033
- Figure 14: Asia Pacific NDT in Power Generation Market Revenue (billion), by Type 2025 & 2033
- Figure 15: Asia Pacific NDT in Power Generation Market Revenue Share (%), by Type 2025 & 2033
- Figure 16: Asia Pacific NDT in Power Generation Market Revenue (billion), by Testing Technology 2025 & 2033
- Figure 17: Asia Pacific NDT in Power Generation Market Revenue Share (%), by Testing Technology 2025 & 2033
- Figure 18: Asia Pacific NDT in Power Generation Market Revenue (billion), by Country 2025 & 2033
- Figure 19: Asia Pacific NDT in Power Generation Market Revenue Share (%), by Country 2025 & 2033
- Figure 20: Latin America NDT in Power Generation Market Revenue (billion), by Type 2025 & 2033
- Figure 21: Latin America NDT in Power Generation Market Revenue Share (%), by Type 2025 & 2033
- Figure 22: Latin America NDT in Power Generation Market Revenue (billion), by Testing Technology 2025 & 2033
- Figure 23: Latin America NDT in Power Generation Market Revenue Share (%), by Testing Technology 2025 & 2033
- Figure 24: Latin America NDT in Power Generation Market Revenue (billion), by Country 2025 & 2033
- Figure 25: Latin America NDT in Power Generation Market Revenue Share (%), by Country 2025 & 2033
- Figure 26: Middle East and Africa NDT in Power Generation Market Revenue (billion), by Type 2025 & 2033
- Figure 27: Middle East and Africa NDT in Power Generation Market Revenue Share (%), by Type 2025 & 2033
- Figure 28: Middle East and Africa NDT in Power Generation Market Revenue (billion), by Testing Technology 2025 & 2033
- Figure 29: Middle East and Africa NDT in Power Generation Market Revenue Share (%), by Testing Technology 2025 & 2033
- Figure 30: Middle East and Africa NDT in Power Generation Market Revenue (billion), by Country 2025 & 2033
- Figure 31: Middle East and Africa NDT in Power Generation Market Revenue Share (%), by Country 2025 & 2033
List of Tables
- Table 1: Global NDT in Power Generation Market Revenue billion Forecast, by Type 2020 & 2033
- Table 2: Global NDT in Power Generation Market Revenue billion Forecast, by Testing Technology 2020 & 2033
- Table 3: Global NDT in Power Generation Market Revenue billion Forecast, by Region 2020 & 2033
- Table 4: Global NDT in Power Generation Market Revenue billion Forecast, by Type 2020 & 2033
- Table 5: Global NDT in Power Generation Market Revenue billion Forecast, by Testing Technology 2020 & 2033
- Table 6: Global NDT in Power Generation Market Revenue billion Forecast, by Country 2020 & 2033
- Table 7: United States NDT in Power Generation Market Revenue (billion) Forecast, by Application 2020 & 2033
- Table 8: Canada NDT in Power Generation Market Revenue (billion) Forecast, by Application 2020 & 2033
- Table 9: Global NDT in Power Generation Market Revenue billion Forecast, by Type 2020 & 2033
- Table 10: Global NDT in Power Generation Market Revenue billion Forecast, by Testing Technology 2020 & 2033
- Table 11: Global NDT in Power Generation Market Revenue billion Forecast, by Country 2020 & 2033
- Table 12: United Kingdom NDT in Power Generation Market Revenue (billion) Forecast, by Application 2020 & 2033
- Table 13: Germany NDT in Power Generation Market Revenue (billion) Forecast, by Application 2020 & 2033
- Table 14: France NDT in Power Generation Market Revenue (billion) Forecast, by Application 2020 & 2033
- Table 15: Rest of Europe NDT in Power Generation Market Revenue (billion) Forecast, by Application 2020 & 2033
- Table 16: Global NDT in Power Generation Market Revenue billion Forecast, by Type 2020 & 2033
- Table 17: Global NDT in Power Generation Market Revenue billion Forecast, by Testing Technology 2020 & 2033
- Table 18: Global NDT in Power Generation Market Revenue billion Forecast, by Country 2020 & 2033
- Table 19: China NDT in Power Generation Market Revenue (billion) Forecast, by Application 2020 & 2033
- Table 20: Japan NDT in Power Generation Market Revenue (billion) Forecast, by Application 2020 & 2033
- Table 21: India NDT in Power Generation Market Revenue (billion) Forecast, by Application 2020 & 2033
- Table 22: Rest of Asia Pacific NDT in Power Generation Market Revenue (billion) Forecast, by Application 2020 & 2033
- Table 23: Global NDT in Power Generation Market Revenue billion Forecast, by Type 2020 & 2033
- Table 24: Global NDT in Power Generation Market Revenue billion Forecast, by Testing Technology 2020 & 2033
- Table 25: Global NDT in Power Generation Market Revenue billion Forecast, by Country 2020 & 2033
- Table 26: Global NDT in Power Generation Market Revenue billion Forecast, by Type 2020 & 2033
- Table 27: Global NDT in Power Generation Market Revenue billion Forecast, by Testing Technology 2020 & 2033
- Table 28: Global NDT in Power Generation Market Revenue billion Forecast, by Country 2020 & 2033
Frequently Asked Questions
1. What is the projected Compound Annual Growth Rate (CAGR) of the NDT in Power Generation Market?
The projected CAGR is approximately 6.24%.
2. Which companies are prominent players in the NDT in Power Generation Market?
Key companies in the market include Yxlon International Gmbh (Comet Holding AG), Intertek Group Plc, Eddyfi, SGS Group, Bureau Veritas S A, Fujifilm Corporation, Mistras Group Inc, Zetec Inc, Applus+ Services Technologies S L, Baker Hughes Company, Team Inc *List Not Exhaustive, Olympus Corporation.
3. What are the main segments of the NDT in Power Generation Market?
The market segments include Type, Testing Technology.
4. Can you provide details about the market size?
The market size is estimated to be USD 4.18 billion as of 2022.
5. What are some drivers contributing to market growth?
Stringent Regulations Mandating Safety Standards; Increase in Demand for Flaw Detection to Reduce Repair Cost; Aging Infrastructure and Increasing Need for Maintenance.
6. What are the notable trends driving market growth?
Visual Inspection Testing is Expected to Witness a Significant Growth.
7. Are there any restraints impacting market growth?
Lack of Skilled Workforce and Training Regulations.
8. Can you provide examples of recent developments in the market?
June 2022 - ALEIA, a startup specializing in AI, and Omexom NDT Engineering & Services, in collaboration with the Laboratoire d'Acoustique de l'Université du Mans (LAUM) UMR CNRS, have announced the deployment of the AUTEND project. The project is aimed to accelerate the inspection of nuclear power plants through AI. Moreover, the project is presently focusing on Non-Destructive Testing, which is an inspection process for nuclear infrastructures using eddy current or ultrasonic testing methods.
9. What pricing options are available for accessing the report?
Pricing options include single-user, multi-user, and enterprise licenses priced at USD 4750, USD 5250, and USD 8750 respectively.
10. Is the market size provided in terms of value or volume?
The market size is provided in terms of value, measured in billion.
11. Are there any specific market keywords associated with the report?
Yes, the market keyword associated with the report is "NDT in Power Generation Market," which aids in identifying and referencing the specific market segment covered.
12. How do I determine which pricing option suits my needs best?
The pricing options vary based on user requirements and access needs. Individual users may opt for single-user licenses, while businesses requiring broader access may choose multi-user or enterprise licenses for cost-effective access to the report.
13. Are there any additional resources or data provided in the NDT in Power Generation Market report?
While the report offers comprehensive insights, it's advisable to review the specific contents or supplementary materials provided to ascertain if additional resources or data are available.
14. How can I stay updated on further developments or reports in the NDT in Power Generation Market?
To stay informed about further developments, trends, and reports in the NDT in Power Generation Market, consider subscribing to industry newsletters, following relevant companies and organizations, or regularly checking reputable industry news sources and publications.
Methodology
Step 1 - Identification of Relevant Samples Size from Population Database


Step 2 - Approaches for Defining Global Market Size (Value, Volume* & Price*)

Note*: In applicable scenarios
Step 3 - Data Sources
Primary Research
- Web Analytics
- Survey Reports
- Research Institute
- Latest Research Reports
- Opinion Leaders
Secondary Research
- Annual Reports
- White Paper
- Latest Press Release
- Industry Association
- Paid Database
- Investor Presentations

Step 4 - Data Triangulation
Involves using different sources of information in order to increase the validity of a study
These sources are likely to be stakeholders in a program - participants, other researchers, program staff, other community members, and so on.
Then we put all data in single framework & apply various statistical tools to find out the dynamic on the market.
During the analysis stage, feedback from the stakeholder groups would be compared to determine areas of agreement as well as areas of divergence