

Key Insights
The North America Amusement Park Market is poised for substantial expansion, projected to reach $33.3 billion by 2033, with a Compound Annual Growth Rate (CAGR) of 29.8% from the base year 2025. This robust growth is primarily driven by rising disposable incomes among key demographics, especially 19-35 year-olds, and an escalating consumer demand for unique leisure and entertainment experiences. Technological innovation in rides, immersive themed attractions, and engaging visitor experiences are attracting a broad spectrum of age groups, significantly contributing to market expansion. Revenue streams are predominantly generated from ticket sales, followed by food and beverage, and merchandise. The United States holds the largest market share, with Canada and Mexico demonstrating promising growth potential, particularly Mexico due to its expanding tourism sector. Key market restraints include escalating operational expenditures, potential economic downturns affecting discretionary spending, and intensifying competition from alternative entertainment offerings. Strategic investments in infrastructure, customer service excellence, and targeted marketing are crucial for sustained market leadership.
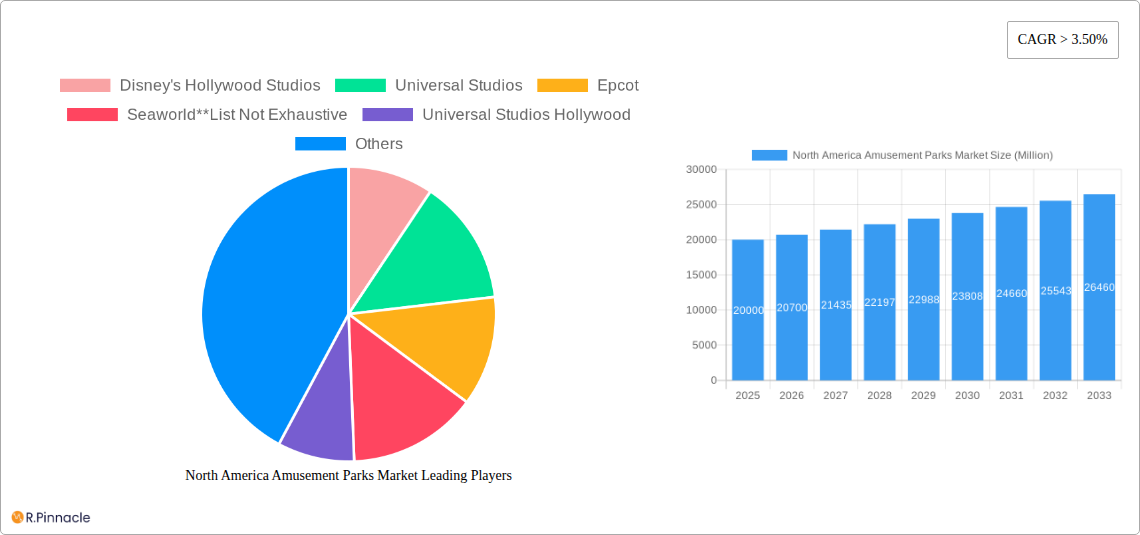
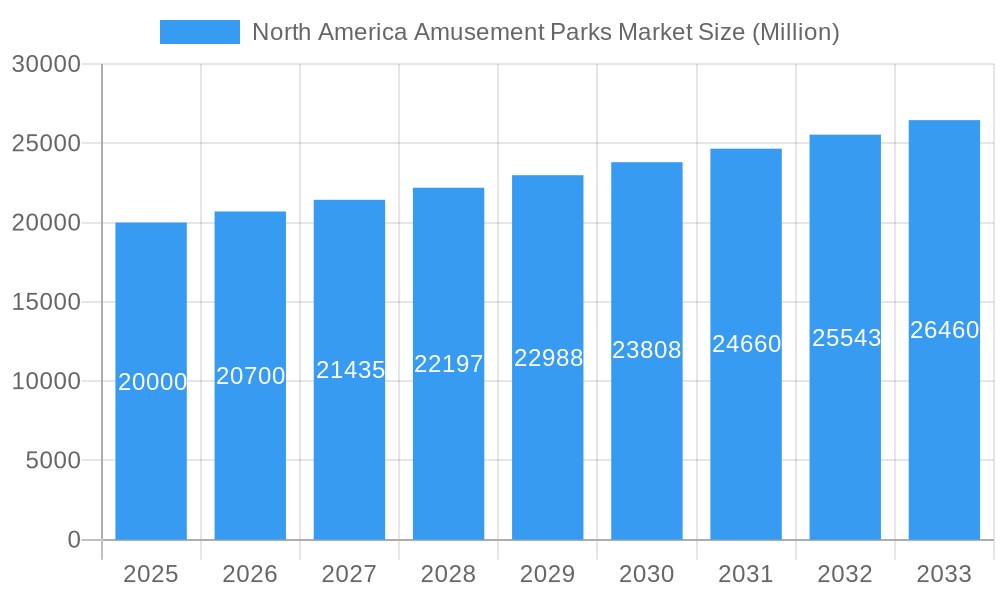
North America Amusement Parks Market Market Size (In Billion)
The competitive arena is characterized by major players like Disney, Universal Studios, and SeaWorld, who are consistently innovating with new attractions and enhancements to secure market dominance and broaden their customer base. Leveraging data analytics for personalized experiences, optimized pricing, and operational efficiency is becoming paramount. A significant market segment comprises visitors aged 19-35, emphasizing the necessity for marketing strategies tailored to this demographic. To seize future growth opportunities, amusement park operators must integrate advanced technologies, champion sustainability, and implement stringent safety protocols to ensure consumer trust and foster long-term success. The forecast indicates a continued upward trajectory, predicting a highly lucrative market by 2033.
North America Amusement Parks Market Company Market Share
North America Amusement Parks Market Report: 2019-2033
This comprehensive report provides a detailed analysis of the North America amusement parks market, covering the period from 2019 to 2033. It offers actionable insights for industry professionals, investors, and stakeholders seeking to understand the market's structure, dynamics, and future potential. The report leverages extensive data and analysis to provide a clear picture of this dynamic sector, encompassing key players such as Disney's Hollywood Studios, Universal Studios, Epcot, SeaWorld, Universal Studios Hollywood, Magic Kingdom, Disney's Animal Kingdom, Disney's California Adventure, Islands of Adventure, and Disneyland (list not exhaustive). The report utilizes a robust methodology, encompassing historical data (2019-2024), a base year (2025), and a forecast period (2025-2033), to deliver accurate and reliable projections. With a market size predicted at xx Million in 2025, this report is an invaluable resource for navigating the complexities of this exciting industry.
North America Amusement Parks Market Structure & Innovation Trends
This section analyzes the market's competitive landscape, innovation drivers, and regulatory environment. The North American amusement park market is characterized by a high degree of concentration, with major players holding significant market share. Disney, Universal Studios, and SeaWorld, for instance, dominate specific segments, creating a complex competitive dynamic. Market share data reveals xx% controlled by the top 5 players in 2024, expected to slightly decrease to xx% by 2033 due to increased competition from smaller independent parks.
- Market Concentration: High, with major players controlling significant market share.
- Innovation Drivers: Technological advancements in rides and attractions, immersive experiences, and personalized guest services.
- Regulatory Frameworks: Safety regulations, environmental concerns, and accessibility standards significantly impact operations.
- Product Substitutes: Other forms of entertainment, such as video games, virtual reality experiences, and home entertainment options, pose a competitive threat.
- End-User Demographics: The market caters to a broad demographic, with distinct preferences across age groups, influencing ride design and overall park experience.
- M&A Activities: Recent mergers and acquisitions, such as the Delaware North acquisition of Best Western Premier Grand Canyon Squire Inn (January 2023) and Five Star Parks & Attractions' acquisition of Malibu Jack's Indoor Theme Parks (July 2022), totaling an estimated xx Million in deal value in 2022-2023, reflect industry consolidation and expansion. Further acquisitions are anticipated in the forecast period, potentially driving market consolidation.
North America Amusement Parks Market Dynamics & Trends
The North America amusement park market is experiencing robust growth, driven by increasing disposable incomes, rising tourism, and technological advancements creating immersive and unique experiences. The market is estimated to register a CAGR of xx% during the forecast period (2025-2033). This growth is further fueled by the evolving preferences of consumers, who now seek unique, personalized, and technology-driven entertainment. Technological disruption, including virtual and augmented reality integrations, and personalized mobile applications enhancing the guest experience, is reshaping the industry. Competitive dynamics are marked by intense competition among established players, fostering innovation and driving pricing strategies. Market penetration of advanced technologies within parks is also expected to increase substantially from xx% in 2025 to xx% by 2033.
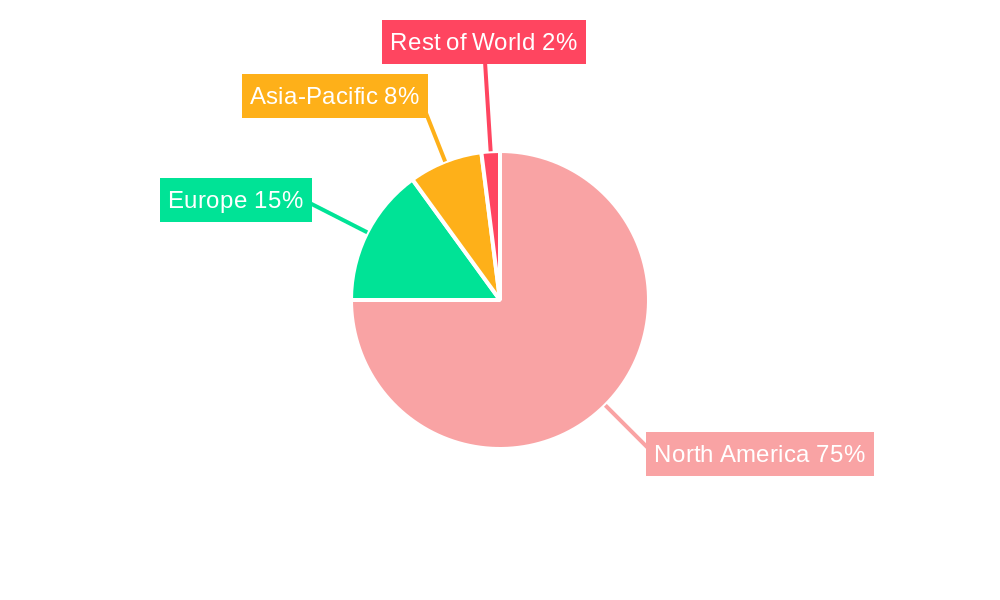
Dominant Regions & Segments in North America Amusement Parks Market
The United States is the dominant market within North America, accounting for xx% of the total revenue in 2024. This dominance is attributed to a large population, high tourist influx, and the presence of major theme park operators. Canada and Mexico also hold significant shares, representing xx% and xx% respectively, while the Rest of North America contributes xx%.
By Rides: Mechanical rides constitute the largest segment, driven by their enduring appeal across demographics. Water rides represent a substantial portion, and other rides continue to diversify the market, influencing the overall market size.
By Age: The 19-35 age group shows the highest spending potential, influencing the design of rides and services. Families with children (up to 18) also constitute a significant segment, contributing xx Million in revenue.
By Revenue: Ticket sales continue to dominate revenue streams, contributing approximately xx Million. Food & beverage, merchandise, and hotels/resorts generate substantial additional revenue.
- Key Drivers (United States): Strong tourism, robust economy, favorable government policies supporting the hospitality industry, and well-developed infrastructure.
- Key Drivers (Canada): Growing tourism sector, investment in infrastructure, and favorable regulatory environment.
- Key Drivers (Mexico): Increasing disposable incomes, rising domestic tourism, and strategic investments in infrastructure.
North America Amusement Parks Market Product Innovations
Recent innovations focus on immersive technologies, virtual and augmented reality integrations, and interactive experiences. These enhance guest engagement and create unique selling propositions for parks. The integration of mobile applications for personalized experiences, virtual queue systems, and mobile ordering are significantly impacting the customer experience. This trend is expected to continue, with a focus on sustainability and enhancing the overall park experience.
Report Scope & Segmentation Analysis
This report provides a granular segmentation of the North America amusement parks market based on rides (mechanical, water, other), age group (upto 18, 19-35, 36-50, 51-65, >65), revenue streams (tickets, food & beverages, merchandise, hotels/resorts, other), and country (United States, Canada, Mexico, Rest of North America). Each segment's growth trajectory, market size, and competitive dynamics are extensively analyzed, providing insights into the sector's nuanced structure. Growth projections for individual segments vary, depending on factors like consumer preferences, technological advancements and economic conditions.
Key Drivers of North America Amusement Parks Market Growth
The market's growth is propelled by several key factors. Increasing disposable incomes and rising tourism contribute significantly to higher spending on leisure and entertainment. Technological advancements, particularly the integration of VR/AR, enhance the appeal of amusement parks. Furthermore, favorable government policies supporting tourism and infrastructure development create a favorable environment for market expansion.
Challenges in the North America Amusement Parks Market Sector
The industry faces challenges such as increasing operational costs, stringent safety regulations, and intense competition, putting pressure on margins and profit. Supply chain disruptions can impact the availability of equipment and materials, potentially affecting park operations and maintenance. Seasonal variations in tourist traffic also impact revenue streams, requiring effective strategies for managing capacity and visitor flows.
Emerging Opportunities in North America Amusement Parks Market
Emerging opportunities include the development of hyper-personalized experiences, leveraging data analytics to enhance guest services and drive engagement. The incorporation of sustainable practices to meet environmental concerns also presents significant opportunities for differentiation. Expansion into new markets and the creation of unique, niche-themed parks hold potential for growth.
Leading Players in the North America Amusement Parks Market Market
- Disney's Hollywood Studios
- Universal Studios
- Epcot
- SeaWorld
- Universal Studios Hollywood
- Magic Kingdom
- Disney's Animal Kingdom
- Disney's California Adventure
- Islands of Adventure
- Disneyland
Key Developments in North America Amusement Parks Market Industry
- July 2022: Five Star Parks & Attractions acquired three Malibu Jack's Indoor Theme Parks, expanding its footprint and market share.
- January 2023: Delaware North's acquisition of Best Western Premier Grand Canyon Squire Inn signals expansion in the parks and lodging sector.
Future Outlook for North America Amusement Parks Market Market
The North America amusement parks market is poised for continued growth, driven by technological innovation, evolving consumer preferences, and the expansion of existing players. Strategic investments in immersive technologies, sustainable practices, and personalized guest experiences will be key to success in this competitive market. The development of unique thematic experiences and strategic acquisitions will further shape the industry's trajectory.
North America Amusement Parks Market Segmentation
-
1. Rides
- 1.1. Mechanical Rides
- 1.2. Water Rides
- 1.3. Other Rides
-
2. Age
- 2.1. Upto 18 years
- 2.2. 19 to 35 years
- 2.3. 36 to 50 years
- 2.4. 51 to 65 years
- 2.5. More than 65 years
-
3. Revenue
- 3.1. Tickets
- 3.2. Food & Beverages
- 3.3. Merchandise
- 3.4. Hotels/Resorts
- 3.5. Other Revenues
North America Amusement Parks Market Segmentation By Geography
-
1. North America
- 1.1. United States
- 1.2. Canada
- 1.3. Mexico
North America Amusement Parks Market Regional Market Share
Geographic Coverage of North America Amusement Parks Market
North America Amusement Parks Market REPORT HIGHLIGHTS
| Aspects | Details |
|---|---|
| Study Period | 2020-2034 |
| Base Year | 2025 |
| Estimated Year | 2026 |
| Forecast Period | 2026-2034 |
| Historical Period | 2020-2025 |
| Growth Rate | CAGR of 29.8% from 2020-2034 |
| Segmentation |
|
Table of Contents
- 1. Introduction
- 1.1. Research Scope
- 1.2. Market Segmentation
- 1.3. Research Objective
- 1.4. Definitions and Assumptions
- 2. Executive Summary
- 2.1. Market Snapshot
- 3. Market Dynamics
- 3.1. Market Drivers
- 3.2. Market Restrains
- 3.3. Market Trends
- 3.4. Market Opportunities
- 4. Market Factor Analysis
- 4.1. Porters Five Forces
- 4.1.1. Bargaining Power of Suppliers
- 4.1.2. Bargaining Power of Buyers
- 4.1.3. Threat of New Entrants
- 4.1.4. Threat of Substitutes
- 4.1.5. Competitive Rivalry
- 4.2. PESTEL analysis
- 4.3. BCG Analysis
- 4.3.1. Stars (High Growth, High Market Share)
- 4.3.2. Cash Cows (Low Growth, High Market Share)
- 4.3.3. Question Mark (High Growth, Low Market Share)
- 4.3.4. Dogs (Low Growth, Low Market Share)
- 4.4. Ansoff Matrix Analysis
- 4.5. Supply Chain Analysis
- 4.6. Regulatory Landscape
- 4.7. Current Market Potential and Opportunity Assessment (TAM–SAM–SOM Framework)
- 4.8. PRI Analyst Note
- 4.1. Porters Five Forces
- 5. Market Analysis, Insights and Forecast 2021-2033
- 5.1. Market Analysis, Insights and Forecast - by Rides
- 5.1.1. Mechanical Rides
- 5.1.2. Water Rides
- 5.1.3. Other Rides
- 5.2. Market Analysis, Insights and Forecast - by Age
- 5.2.1. Upto 18 years
- 5.2.2. 19 to 35 years
- 5.2.3. 36 to 50 years
- 5.2.4. 51 to 65 years
- 5.2.5. More than 65 years
- 5.3. Market Analysis, Insights and Forecast - by Revenue
- 5.3.1. Tickets
- 5.3.2. Food & Beverages
- 5.3.3. Merchandise
- 5.3.4. Hotels/Resorts
- 5.3.5. Other Revenues
- 5.4. Market Analysis, Insights and Forecast - by Region
- 5.4.1. North America
- 5.1. Market Analysis, Insights and Forecast - by Rides
- 6. North America Amusement Parks Market Analysis, Insights and Forecast, 2021-2033
- 6.1. Market Analysis, Insights and Forecast - by Rides
- 6.1.1. Mechanical Rides
- 6.1.2. Water Rides
- 6.1.3. Other Rides
- 6.2. Market Analysis, Insights and Forecast - by Age
- 6.2.1. Upto 18 years
- 6.2.2. 19 to 35 years
- 6.2.3. 36 to 50 years
- 6.2.4. 51 to 65 years
- 6.2.5. More than 65 years
- 6.3. Market Analysis, Insights and Forecast - by Revenue
- 6.3.1. Tickets
- 6.3.2. Food & Beverages
- 6.3.3. Merchandise
- 6.3.4. Hotels/Resorts
- 6.3.5. Other Revenues
- 6.1. Market Analysis, Insights and Forecast - by Rides
- 7. Competitive Analysis
- 7.1. Company Profiles
- 7.1.1 Disney's Hollywood Studios
- 7.1.1.1. Company Overview
- 7.1.1.2. Products
- 7.1.1.3. Company Financials
- 7.1.1.4. SWOT Analysis
- 7.1.2 Universal Studios
- 7.1.2.1. Company Overview
- 7.1.2.2. Products
- 7.1.2.3. Company Financials
- 7.1.2.4. SWOT Analysis
- 7.1.3 Epcot
- 7.1.3.1. Company Overview
- 7.1.3.2. Products
- 7.1.3.3. Company Financials
- 7.1.3.4. SWOT Analysis
- 7.1.4 Seaworld**List Not Exhaustive
- 7.1.4.1. Company Overview
- 7.1.4.2. Products
- 7.1.4.3. Company Financials
- 7.1.4.4. SWOT Analysis
- 7.1.5 Universal Studios Hollywood
- 7.1.5.1. Company Overview
- 7.1.5.2. Products
- 7.1.5.3. Company Financials
- 7.1.5.4. SWOT Analysis
- 7.1.6 Magic Kingdom
- 7.1.6.1. Company Overview
- 7.1.6.2. Products
- 7.1.6.3. Company Financials
- 7.1.6.4. SWOT Analysis
- 7.1.7 Disney's Animal Kingdom
- 7.1.7.1. Company Overview
- 7.1.7.2. Products
- 7.1.7.3. Company Financials
- 7.1.7.4. SWOT Analysis
- 7.1.8 Disney's California Adventure
- 7.1.8.1. Company Overview
- 7.1.8.2. Products
- 7.1.8.3. Company Financials
- 7.1.8.4. SWOT Analysis
- 7.1.9 Islands of Adventure
- 7.1.9.1. Company Overview
- 7.1.9.2. Products
- 7.1.9.3. Company Financials
- 7.1.9.4. SWOT Analysis
- 7.1.10 Disneyland
- 7.1.10.1. Company Overview
- 7.1.10.2. Products
- 7.1.10.3. Company Financials
- 7.1.10.4. SWOT Analysis
- 7.1.1 Disney's Hollywood Studios
- 7.2. Market Entropy
- 7.2.1 Company's Key Areas Served
- 7.2.2 Recent Developments
- 7.3. Company Market Share Analysis 2025
- 7.3.1 Top 5 Companies Market Share Analysis
- 7.3.2 Top 3 Companies Market Share Analysis
- 7.4. List of Potential Customers
- 8. Research Methodology
List of Figures
- Figure 1: North America Amusement Parks Market Revenue Breakdown (billion, %) by Product 2025 & 2033
- Figure 2: North America Amusement Parks Market Share (%) by Company 2025
List of Tables
- Table 1: North America Amusement Parks Market Revenue billion Forecast, by Rides 2020 & 2033
- Table 2: North America Amusement Parks Market Revenue billion Forecast, by Age 2020 & 2033
- Table 3: North America Amusement Parks Market Revenue billion Forecast, by Revenue 2020 & 2033
- Table 4: North America Amusement Parks Market Revenue billion Forecast, by Region 2020 & 2033
- Table 5: North America Amusement Parks Market Revenue billion Forecast, by Rides 2020 & 2033
- Table 6: North America Amusement Parks Market Revenue billion Forecast, by Age 2020 & 2033
- Table 7: North America Amusement Parks Market Revenue billion Forecast, by Revenue 2020 & 2033
- Table 8: North America Amusement Parks Market Revenue billion Forecast, by Country 2020 & 2033
- Table 9: United States North America Amusement Parks Market Revenue (billion) Forecast, by Application 2020 & 2033
- Table 10: Canada North America Amusement Parks Market Revenue (billion) Forecast, by Application 2020 & 2033
- Table 11: Mexico North America Amusement Parks Market Revenue (billion) Forecast, by Application 2020 & 2033
Frequently Asked Questions
1. What is the projected Compound Annual Growth Rate (CAGR) of the North America Amusement Parks Market?
The projected CAGR is approximately 29.8%.
2. Which companies are prominent players in the North America Amusement Parks Market?
Key companies in the market include Disney's Hollywood Studios, Universal Studios, Epcot, Seaworld**List Not Exhaustive, Universal Studios Hollywood, Magic Kingdom, Disney's Animal Kingdom, Disney's California Adventure, Islands of Adventure, Disneyland.
3. What are the main segments of the North America Amusement Parks Market?
The market segments include Rides, Age, Revenue.
4. Can you provide details about the market size?
The market size is estimated to be USD 33.3 billion as of 2022.
5. What are some drivers contributing to market growth?
Rise in the Number of Visitors to Museums is Driving the Market; Digitalization is Driving the Market.
6. What are the notable trends driving market growth?
Mechanical Rides Powering North America's Amusement Park Industry.
7. Are there any restraints impacting market growth?
Maintenance and Preservation Costs; Changing Visitor Preferences.
8. Can you provide examples of recent developments in the market?
January 2023: Global hospitality and entertainment company Delaware North announced its continued expansion in the parks and lodging sector through the acquisition of the Best Western Premier Grand Canyon Squire Inn.
9. What pricing options are available for accessing the report?
Pricing options include single-user, multi-user, and enterprise licenses priced at USD 4750, USD 4950, and USD 6800 respectively.
10. Is the market size provided in terms of value or volume?
The market size is provided in terms of value, measured in billion.
11. Are there any specific market keywords associated with the report?
Yes, the market keyword associated with the report is "North America Amusement Parks Market," which aids in identifying and referencing the specific market segment covered.
12. How do I determine which pricing option suits my needs best?
The pricing options vary based on user requirements and access needs. Individual users may opt for single-user licenses, while businesses requiring broader access may choose multi-user or enterprise licenses for cost-effective access to the report.
13. Are there any additional resources or data provided in the North America Amusement Parks Market report?
While the report offers comprehensive insights, it's advisable to review the specific contents or supplementary materials provided to ascertain if additional resources or data are available.
14. How can I stay updated on further developments or reports in the North America Amusement Parks Market?
To stay informed about further developments, trends, and reports in the North America Amusement Parks Market, consider subscribing to industry newsletters, following relevant companies and organizations, or regularly checking reputable industry news sources and publications.
Methodology
Step 1 - Identification of Relevant Samples Size from Population Database


Step 2 - Approaches for Defining Global Market Size (Value, Volume* & Price*)

Note*: In applicable scenarios
Step 3 - Data Sources
Primary Research
- Web Analytics
- Survey Reports
- Research Institute
- Latest Research Reports
- Opinion Leaders
Secondary Research
- Annual Reports
- White Paper
- Latest Press Release
- Industry Association
- Paid Database
- Investor Presentations

Step 4 - Data Triangulation
Involves using different sources of information in order to increase the validity of a study
These sources are likely to be stakeholders in a program - participants, other researchers, program staff, other community members, and so on.
Then we put all data in single framework & apply various statistical tools to find out the dynamic on the market.
During the analysis stage, feedback from the stakeholder groups would be compared to determine areas of agreement as well as areas of divergence