

Key Insights
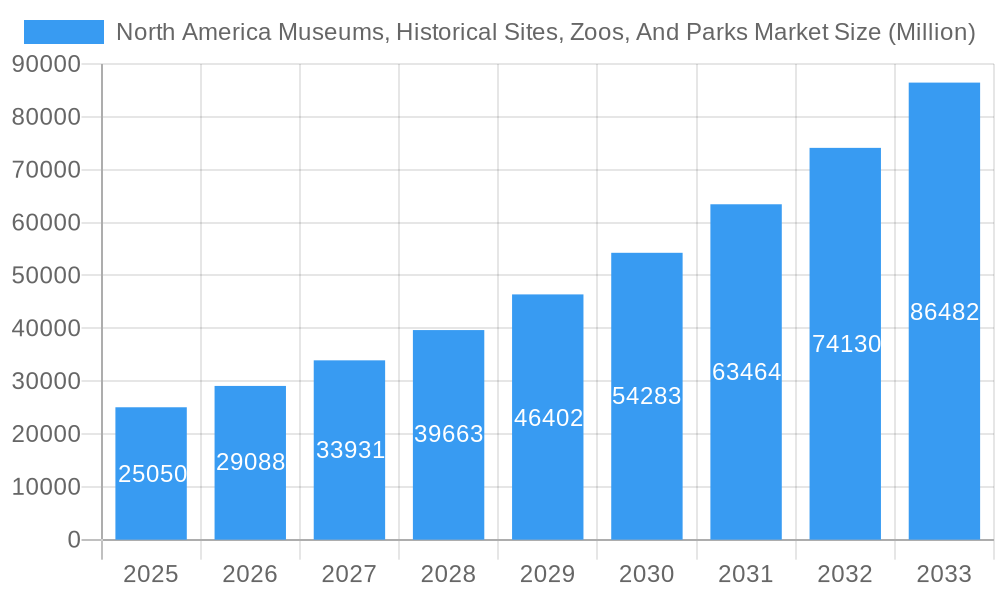
The North American Museums, Historical Sites, Zoos, and Parks market is experiencing robust growth, projected to reach $25.05 billion in 2025 and exhibiting a Compound Annual Growth Rate (CAGR) of 16.08% from 2025 to 2033. This expansion is fueled by several key drivers. Firstly, increasing disposable incomes and a growing preference for experiential tourism are boosting visitor numbers. Secondly, innovative marketing strategies, including immersive experiences and digital engagement, are attracting a broader audience across age groups. Thirdly, the sector's continuous investment in infrastructure improvements, new exhibits, and enhanced visitor amenities contributes to a positive visitor experience and repeat business. Finally, a rising interest in education and cultural preservation further supports market growth. However, challenges remain. Seasonal variations in visitor numbers, dependence on tourism trends, and the need for sustainable practices pose potential restraints.
North America Museums, Historical Sites, Zoos, And Parks Market Market Size (In Billion)
Segment analysis reveals the significant contribution of revenue sources beyond ticket sales. Food and beverage offerings, as well as merchandise sales and other ancillary services, significantly contribute to overall profitability. Within the market segments, museums and historical sites represent a substantial share, followed by zoos and botanical gardens, with nature parks contributing significantly to overall growth. The geographical concentration within North America, specifically the United States, Canada, and Mexico, reflects the developed tourism infrastructure and strong domestic and international visitor demand. This regional dominance is further enhanced by the presence of iconic attractions like Yellowstone National Park, the Statue of Liberty, and numerous renowned museums, driving tourism revenue and shaping the market's trajectory. The continued focus on diversification of revenue streams, technological advancements, and commitment to sustainable operations will be crucial to ensure continued market expansion in the coming years.
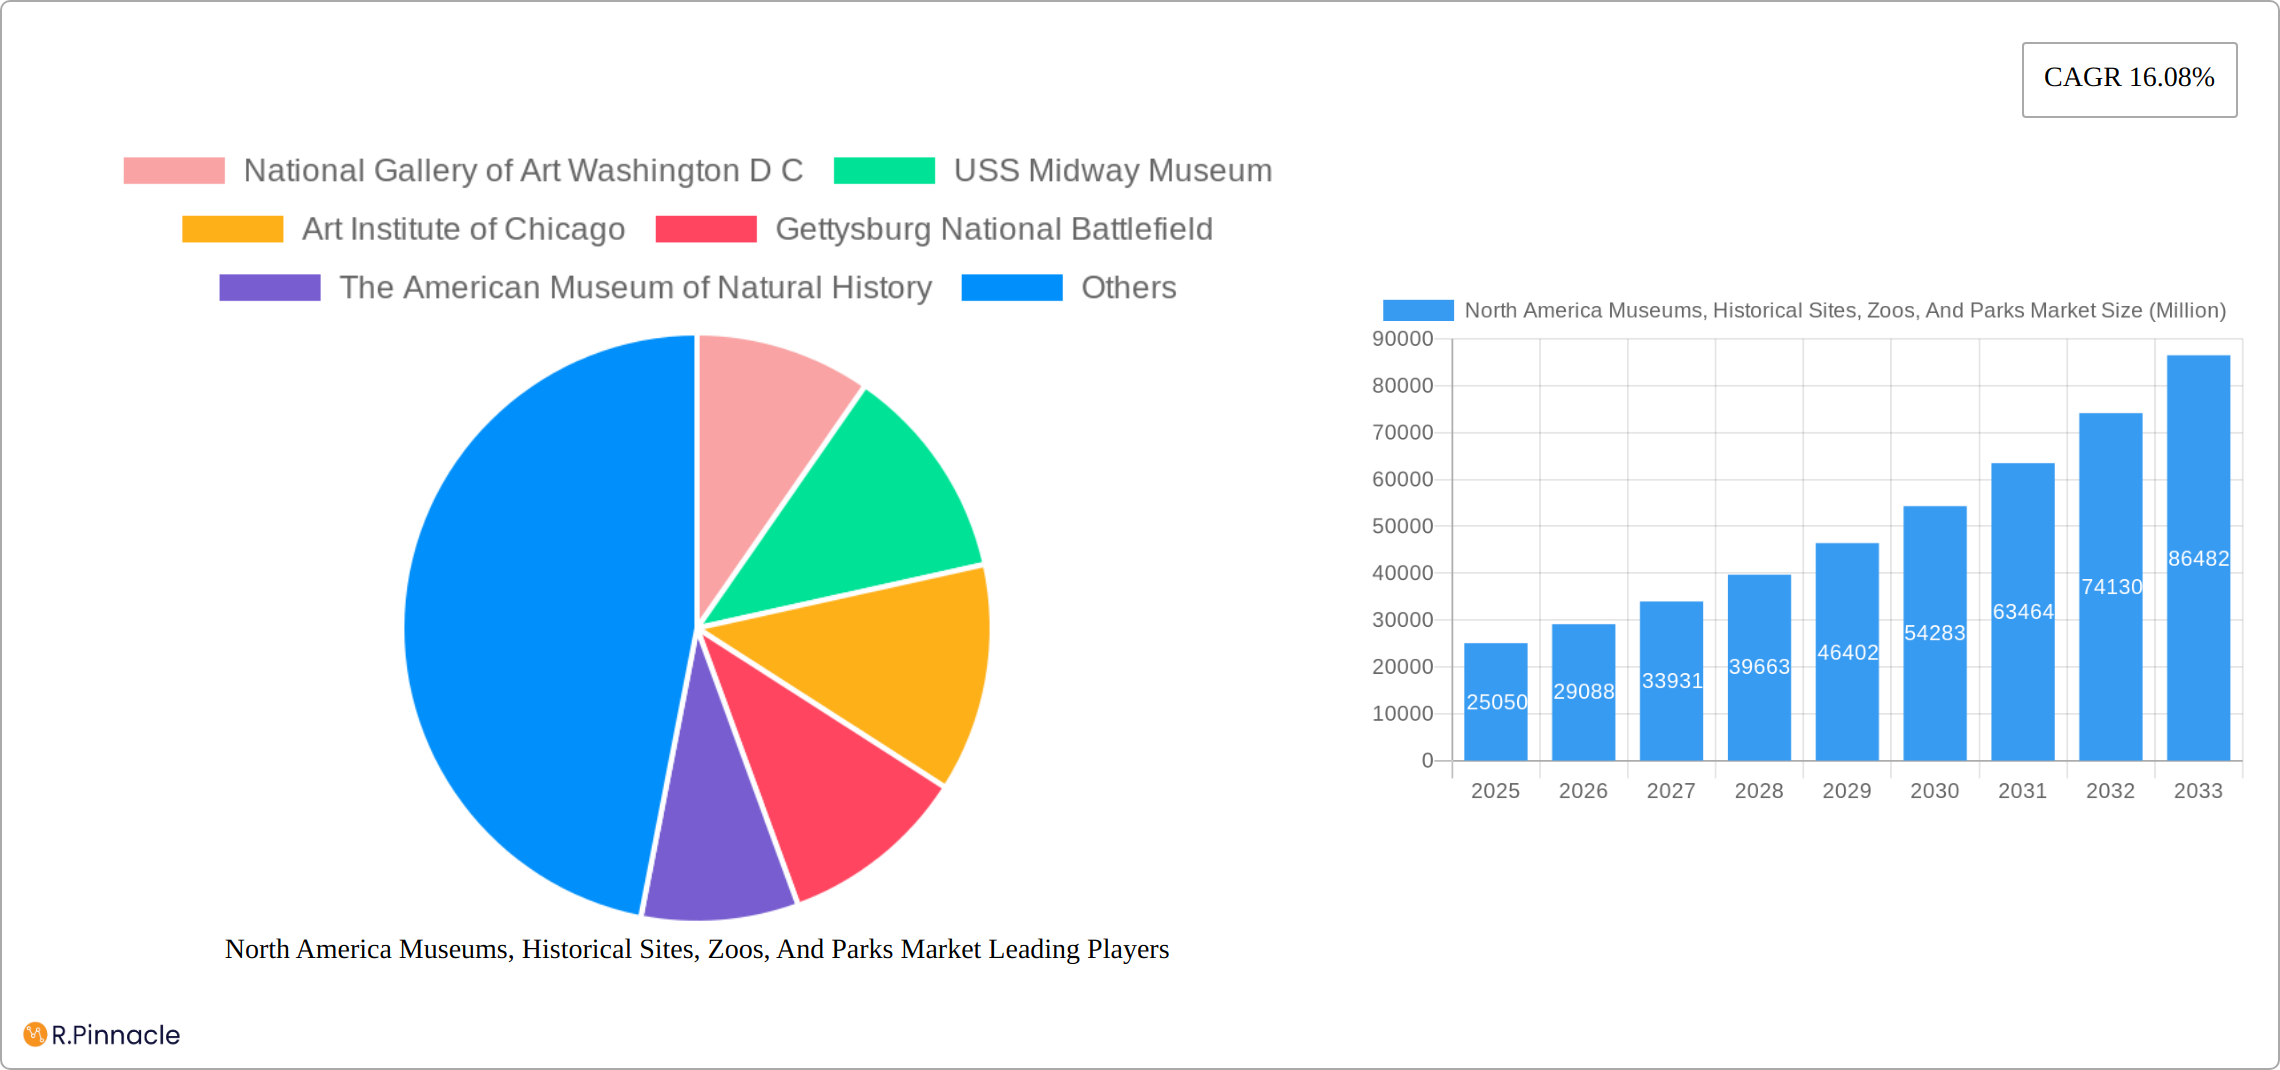
North America Museums, Historical Sites, Zoos, And Parks Market Company Market Share
North America Museums, Historical Sites, Zoos, and Parks Market Report: 2019-2033
This comprehensive report provides an in-depth analysis of the North American museums, historical sites, zoos, and parks market, offering crucial insights for industry professionals and investors. Covering the period from 2019 to 2033, with a focus on 2025, this report unveils market dynamics, growth drivers, challenges, and future opportunities. The study incorporates data from key players like the National Gallery of Art, USS Midway Museum, and Yellowstone National Park, among others, providing a holistic view of this multifaceted sector.
North America Museums, Historical Sites, Zoos, And Parks Market Market Structure & Innovation Trends
This section analyzes the North American museums, historical sites, zoos, and parks market's competitive landscape, highlighting key structural elements and innovative trends shaping its future. The market exhibits a moderately concentrated structure, with a few large institutions holding significant market share alongside numerous smaller players contributing to overall diversity. For instance, while the National Gallery of Art commands substantial market share in the art museum segment, numerous smaller, specialized museums cater to niche interests, creating a vibrant and multifaceted ecosystem.
Market Concentration Metrics (2025 Projections):
- The top 10 players account for approximately [Insert Percentage]% of the total market revenue.
- The market exhibits a Herfindahl-Hirschman Index (HHI) of [Insert HHI Value], indicating a moderately concentrated market.
Innovation Drivers and Emerging Trends:
- Technological Advancements: Digital ticketing systems, virtual and augmented reality tours, interactive exhibits, and personalized mobile applications enhance visitor engagement and operational efficiency.
- Sustainability and Ecotourism: Growing environmental consciousness drives sustainable operational practices, eco-friendly infrastructure development, and educational initiatives promoting conservation and responsible tourism.
- Immersive Experiences: A focus on creating memorable and engaging experiences through innovative exhibition design, storytelling techniques, and interactive displays is shaping the visitor journey.
- Data-Driven Decision Making: The increasing use of data analytics to understand visitor preferences, optimize operations, and personalize marketing efforts is transforming the sector.
Regulatory Frameworks, M&A Activities, and Competitive Landscape:
- Regulatory Landscape: Varying regional regulations impact operational costs and expansion strategies, necessitating adaptive compliance measures.
- Mergers and Acquisitions (M&A): Moderate M&A activity, with deal values averaging [Insert Average Deal Value] Million in recent years, primarily involves larger institutions consolidating smaller players to increase operational efficiency and expand geographic reach.
- Competitive Pressures: Alternative forms of entertainment and leisure, particularly the rise of digital entertainment platforms, present competition for visitor attention and revenue generation, requiring innovative strategies to maintain market share.
- Diverse Visitor Demographics: Catering to families, tourists, students, researchers, and diverse community groups requires targeted marketing strategies and diversified programming to broaden appeal and accessibility.
North America Museums, Historical Sites, Zoos, And Parks Market Market Dynamics & Trends
The North American museums, historical sites, zoos, and parks market exhibits robust growth, driven by various factors. Increased disposable incomes, a growing preference for experiential tourism, and government initiatives supporting cultural and conservation efforts are key contributors. Technological advancements, including interactive exhibits and virtual reality experiences, enhance visitor engagement and drive market penetration. However, competitive pressures from alternative forms of entertainment and the impact of economic downturns pose significant challenges.
- The market is projected to grow at a CAGR of xx% during the forecast period (2025-2033).
- Market penetration is expected to reach xx% by 2033, driven by increased visitation and new offerings.
- Consumer preferences show a clear shift towards immersive and interactive experiences, impacting investment in technology and exhibit design.
- Competitive dynamics involve intensified competition for visitors, leading to innovative offerings and improved visitor experiences.
Dominant Regions & Segments in North America Museums, Historical Sites, Zoos, And Parks Market
The report identifies key geographic regions and market segments exhibiting strong performance within the North American Museums, Historical Sites, Zoos, and Parks Market. The Northeastern and Western United States, along with specific provinces in Canada (particularly Ontario), consistently demonstrate high visitation rates and revenue generation.
Dominant Segments (2025 Projections):
- By Revenue Source: Ticket sales remain a primary revenue stream, accounting for [Insert Percentage]% of total revenue. Food and beverage sales contribute [Insert Percentage]%, while other revenue sources (merchandise, memberships, grants, educational programs, etc.) comprise [Insert Percentage]%.
- By Type: Museums (including art, science, history, and specialized museums) and nature parks represent the most significant market segments, accounting for [Insert Percentage]% and [Insert Percentage]%, respectively. Zoos and historical sites also hold substantial market share.
Key Drivers of Regional Dominance:
- Northeastern US: High population density, well-established tourism infrastructure, a rich history and cultural heritage, and a concentration of world-renowned institutions.
- Western US: Iconic national parks, diverse natural landscapes, a strong tourism industry, and appeal to outdoor recreation enthusiasts.
- Ontario, Canada: Significant investments in cultural institutions, proximity to major metropolitan areas, and a strong focus on tourism development.
Detailed Dominance Analysis: The dominance of these regions is attributed to a combination of factors including strong tourism infrastructure, rich cultural heritage, established marketing strategies, and the presence of numerous world-renowned institutions attracting significant visitation and revenue.
North America Museums, Historical Sites, Zoos, And Parks Market Product Innovations
The market witnesses continuous product innovation, with a focus on enhancing visitor experience and operational efficiency. Interactive exhibits utilizing augmented reality and virtual reality technologies are gaining popularity. Sustainable practices and green technologies are increasingly incorporated into building design and operational protocols. Digital ticketing and online booking systems improve convenience and streamline operations. These innovations offer competitive advantages by enhancing visitor engagement and improving operational efficiency, directly impacting customer satisfaction and financial performance.
Report Scope & Segmentation Analysis
This report segments the North American museums, historical sites, zoos, and parks market by revenue source (tickets, food and beverages, other revenue sources) and by type (museums, historical sites, zoos and botanical gardens, nature parks, other similar institutions). Each segment's growth projections, market size, and competitive dynamics are analyzed. The forecasts consider factors like economic conditions, tourism trends, and technological advancements. For instance, the zoos and botanical gardens segment is expected to witness robust growth driven by an increased focus on conservation initiatives and enhanced visitor experiences.
Key Drivers of North America Museums, Historical Sites, Zoos, And Parks Market Growth
Several factors fuel the market's growth. A rising global tourism sector fuels visitation, while technological advancements improve visitor experience and operational efficiency. Government support for cultural preservation and conservation initiatives incentivizes investment and development. Increasing disposable incomes and changing leisure preferences contribute to greater demand for engaging experiences.
Challenges in the North America Museums, Historical Sites, Zoos, And Parks Market Sector
The sector faces several challenges, including economic downturns impacting visitor spending, intense competition from alternative entertainment options, and escalating operational costs, particularly for infrastructure maintenance and restoration. Meeting evolving safety standards and ensuring regulatory compliance add to operational complexities. Attracting and retaining skilled staff is also a growing concern.
Emerging Opportunities in North America Museums, Historical Sites, Zoos, And Parks Market
Emerging opportunities include leveraging technological advancements for enhanced engagement and educational experiences, capitalizing on the growth of sustainable and experiential tourism, and focusing on specialized niche markets. Expansion into new geographic areas and strategic partnerships can further unlock growth potential.
Leading Players in the North America Museums, Historical Sites, Zoos, And Parks Market Market
- National Gallery of Art Washington D C
- USS Midway Museum
- Art Institute of Chicago
- Gettysburg National Battlefield
- The American Museum of Natural History
- The Montreal Museum of Fine Arts
- Art Gallery of Ontario
- Independence Hall
- Museum of Anthropology at UBC
- Houston Zoo
- Jamestown Settlement
- Cincinnati Zoo & Botanical Garden
- Yellowstone National Park
- The Statue of Liberty
Key Developments in North America Museums, Historical Sites, Zoos, And Parks Market Industry
- January 2023: The Houston Zoo's $150 Million "Keeping Our World Wild" campaign, featuring a new Galápagos Islands exhibit, significantly enhanced visitor appeal and revenue generation.
- March 2023: The Columbus Zoo and Aquarium's $32.5 Million capital spending program focused on animal well-being, guest experience improvements, and new lodging demonstrated significant investment in infrastructure and visitor experience.
- [Add other recent key developments with dates and brief descriptions]
Future Outlook for North America Museums, Historical Sites, Zoos, And Parks Market Market
The market anticipates sustained growth driven by continuous innovation, a thriving global tourism sector, and increased investment in infrastructure and visitor experience. Strategic partnerships, targeted marketing campaigns leveraging digital channels, and the adoption of innovative technologies will be crucial for maximizing future growth potential. A continued focus on sustainability, enhancing visitor experiences, and community engagement will shape the industry's trajectory in the coming years.
North America Museums, Historical Sites, Zoos, And Parks Market Segmentation
-
1. Type
- 1.1. Museums
- 1.2. Historical Sites
- 1.3. Zoos And Botanical Gardens
- 1.4. Nature Parks
- 1.5. Other Similar Institutions
-
2. Revenue Source
- 2.1. Tickets
- 2.2. Food And Beverages
- 2.3. Other Revenue Souces
-
3. Geography
- 3.1. USA
- 3.2. Canada
- 3.3. Rest of North America
North America Museums, Historical Sites, Zoos, And Parks Market Segmentation By Geography
- 1. USA
- 2. Canada
- 3. Rest of North America
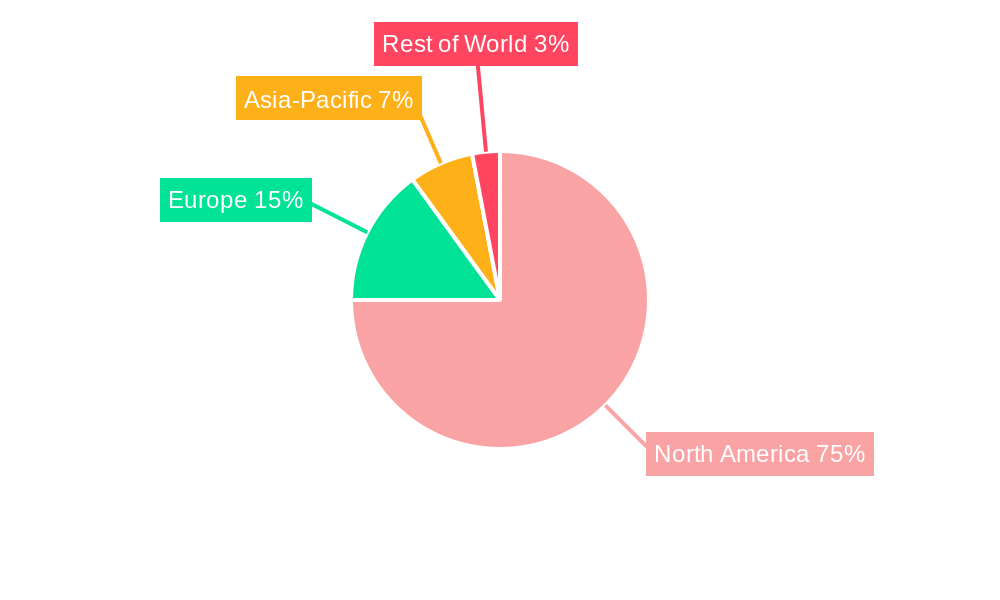
North America Museums, Historical Sites, Zoos, And Parks Market Regional Market Share
Geographic Coverage of North America Museums, Historical Sites, Zoos, And Parks Market
North America Museums, Historical Sites, Zoos, And Parks Market REPORT HIGHLIGHTS
| Aspects | Details |
|---|---|
| Study Period | 2020-2034 |
| Base Year | 2025 |
| Estimated Year | 2026 |
| Forecast Period | 2026-2034 |
| Historical Period | 2020-2025 |
| Growth Rate | CAGR of 16.08% from 2020-2034 |
| Segmentation |
|
Table of Contents
- 1. Introduction
- 1.1. Research Scope
- 1.2. Market Segmentation
- 1.3. Research Objective
- 1.4. Definitions and Assumptions
- 2. Executive Summary
- 2.1. Market Snapshot
- 3. Market Dynamics
- 3.1. Market Drivers
- 3.2. Market Restrains
- 3.3. Market Trends
- 3.4. Market Opportunities
- 4. Market Factor Analysis
- 4.1. Porters Five Forces
- 4.1.1. Bargaining Power of Suppliers
- 4.1.2. Bargaining Power of Buyers
- 4.1.3. Threat of New Entrants
- 4.1.4. Threat of Substitutes
- 4.1.5. Competitive Rivalry
- 4.2. PESTEL analysis
- 4.3. BCG Analysis
- 4.3.1. Stars (High Growth, High Market Share)
- 4.3.2. Cash Cows (Low Growth, High Market Share)
- 4.3.3. Question Mark (High Growth, Low Market Share)
- 4.3.4. Dogs (Low Growth, Low Market Share)
- 4.4. Ansoff Matrix Analysis
- 4.5. Supply Chain Analysis
- 4.6. Regulatory Landscape
- 4.7. Current Market Potential and Opportunity Assessment (TAM–SAM–SOM Framework)
- 4.8. PRI Analyst Note
- 4.1. Porters Five Forces
- 5. Market Analysis, Insights and Forecast 2021-2033
- 5.1. Market Analysis, Insights and Forecast - by Type
- 5.1.1. Museums
- 5.1.2. Historical Sites
- 5.1.3. Zoos And Botanical Gardens
- 5.1.4. Nature Parks
- 5.1.5. Other Similar Institutions
- 5.2. Market Analysis, Insights and Forecast - by Revenue Source
- 5.2.1. Tickets
- 5.2.2. Food And Beverages
- 5.2.3. Other Revenue Souces
- 5.3. Market Analysis, Insights and Forecast - by Geography
- 5.3.1. USA
- 5.3.2. Canada
- 5.3.3. Rest of North America
- 5.4. Market Analysis, Insights and Forecast - by Region
- 5.4.1. USA
- 5.4.2. Canada
- 5.4.3. Rest of North America
- 5.1. Market Analysis, Insights and Forecast - by Type
- 6. North America Museums, Historical Sites, Zoos, And Parks Market Analysis, Insights and Forecast, 2021-2033
- 6.1. Market Analysis, Insights and Forecast - by Type
- 6.1.1. Museums
- 6.1.2. Historical Sites
- 6.1.3. Zoos And Botanical Gardens
- 6.1.4. Nature Parks
- 6.1.5. Other Similar Institutions
- 6.2. Market Analysis, Insights and Forecast - by Revenue Source
- 6.2.1. Tickets
- 6.2.2. Food And Beverages
- 6.2.3. Other Revenue Souces
- 6.3. Market Analysis, Insights and Forecast - by Geography
- 6.3.1. USA
- 6.3.2. Canada
- 6.3.3. Rest of North America
- 6.1. Market Analysis, Insights and Forecast - by Type
- 7. USA North America Museums, Historical Sites, Zoos, And Parks Market Analysis, Insights and Forecast, 2020-2032
- 7.1. Market Analysis, Insights and Forecast - by Type
- 7.1.1. Museums
- 7.1.2. Historical Sites
- 7.1.3. Zoos And Botanical Gardens
- 7.1.4. Nature Parks
- 7.1.5. Other Similar Institutions
- 7.2. Market Analysis, Insights and Forecast - by Revenue Source
- 7.2.1. Tickets
- 7.2.2. Food And Beverages
- 7.2.3. Other Revenue Souces
- 7.3. Market Analysis, Insights and Forecast - by Geography
- 7.3.1. USA
- 7.3.2. Canada
- 7.3.3. Rest of North America
- 7.1. Market Analysis, Insights and Forecast - by Type
- 8. Canada North America Museums, Historical Sites, Zoos, And Parks Market Analysis, Insights and Forecast, 2020-2032
- 8.1. Market Analysis, Insights and Forecast - by Type
- 8.1.1. Museums
- 8.1.2. Historical Sites
- 8.1.3. Zoos And Botanical Gardens
- 8.1.4. Nature Parks
- 8.1.5. Other Similar Institutions
- 8.2. Market Analysis, Insights and Forecast - by Revenue Source
- 8.2.1. Tickets
- 8.2.2. Food And Beverages
- 8.2.3. Other Revenue Souces
- 8.3. Market Analysis, Insights and Forecast - by Geography
- 8.3.1. USA
- 8.3.2. Canada
- 8.3.3. Rest of North America
- 8.1. Market Analysis, Insights and Forecast - by Type
- 9. Rest of North America North America Museums, Historical Sites, Zoos, And Parks Market Analysis, Insights and Forecast, 2020-2032
- 9.1. Market Analysis, Insights and Forecast - by Type
- 9.1.1. Museums
- 9.1.2. Historical Sites
- 9.1.3. Zoos And Botanical Gardens
- 9.1.4. Nature Parks
- 9.1.5. Other Similar Institutions
- 9.2. Market Analysis, Insights and Forecast - by Revenue Source
- 9.2.1. Tickets
- 9.2.2. Food And Beverages
- 9.2.3. Other Revenue Souces
- 9.3. Market Analysis, Insights and Forecast - by Geography
- 9.3.1. USA
- 9.3.2. Canada
- 9.3.3. Rest of North America
- 9.1. Market Analysis, Insights and Forecast - by Type
- 10. Competitive Analysis
- 10.1. Company Profiles
- 10.1.1 National Gallery of Art Washington D C
- 10.1.1.1. Company Overview
- 10.1.1.2. Products
- 10.1.1.3. Company Financials
- 10.1.1.4. SWOT Analysis
- 10.1.2 USS Midway Museum
- 10.1.2.1. Company Overview
- 10.1.2.2. Products
- 10.1.2.3. Company Financials
- 10.1.2.4. SWOT Analysis
- 10.1.3 Art Institute of Chicago
- 10.1.3.1. Company Overview
- 10.1.3.2. Products
- 10.1.3.3. Company Financials
- 10.1.3.4. SWOT Analysis
- 10.1.4 Gettysburg National Battlefield
- 10.1.4.1. Company Overview
- 10.1.4.2. Products
- 10.1.4.3. Company Financials
- 10.1.4.4. SWOT Analysis
- 10.1.5 The American Museum of Natural History
- 10.1.5.1. Company Overview
- 10.1.5.2. Products
- 10.1.5.3. Company Financials
- 10.1.5.4. SWOT Analysis
- 10.1.6 The Montreal Museum of Fine Arts
- 10.1.6.1. Company Overview
- 10.1.6.2. Products
- 10.1.6.3. Company Financials
- 10.1.6.4. SWOT Analysis
- 10.1.7 Art Gallery of Ontario
- 10.1.7.1. Company Overview
- 10.1.7.2. Products
- 10.1.7.3. Company Financials
- 10.1.7.4. SWOT Analysis
- 10.1.8 Independence Hall
- 10.1.8.1. Company Overview
- 10.1.8.2. Products
- 10.1.8.3. Company Financials
- 10.1.8.4. SWOT Analysis
- 10.1.9 Museum of Anthropology at UBC
- 10.1.9.1. Company Overview
- 10.1.9.2. Products
- 10.1.9.3. Company Financials
- 10.1.9.4. SWOT Analysis
- 10.1.10 Houston Zoo
- 10.1.10.1. Company Overview
- 10.1.10.2. Products
- 10.1.10.3. Company Financials
- 10.1.10.4. SWOT Analysis
- 10.1.11 Jamestown Settlement
- 10.1.11.1. Company Overview
- 10.1.11.2. Products
- 10.1.11.3. Company Financials
- 10.1.11.4. SWOT Analysis
- 10.1.12 Cincinnati Zoo & Botanical Garden
- 10.1.12.1. Company Overview
- 10.1.12.2. Products
- 10.1.12.3. Company Financials
- 10.1.12.4. SWOT Analysis
- 10.1.13 Yellowstone National Park**List Not Exhaustive
- 10.1.13.1. Company Overview
- 10.1.13.2. Products
- 10.1.13.3. Company Financials
- 10.1.13.4. SWOT Analysis
- 10.1.14 The Statue of Liberty
- 10.1.14.1. Company Overview
- 10.1.14.2. Products
- 10.1.14.3. Company Financials
- 10.1.14.4. SWOT Analysis
- 10.1.1 National Gallery of Art Washington D C
- 10.2. Market Entropy
- 10.2.1 Company's Key Areas Served
- 10.2.2 Recent Developments
- 10.3. Company Market Share Analysis 2025
- 10.3.1 Top 5 Companies Market Share Analysis
- 10.3.2 Top 3 Companies Market Share Analysis
- 10.4. List of Potential Customers
- 11. Research Methodology
List of Figures
- Figure 1: North America Museums, Historical Sites, Zoos, And Parks Market Revenue Breakdown (Million, %) by Product 2025 & 2033
- Figure 2: North America Museums, Historical Sites, Zoos, And Parks Market Share (%) by Company 2025
List of Tables
- Table 1: North America Museums, Historical Sites, Zoos, And Parks Market Revenue Million Forecast, by Type 2020 & 2033
- Table 2: North America Museums, Historical Sites, Zoos, And Parks Market Revenue Million Forecast, by Revenue Source 2020 & 2033
- Table 3: North America Museums, Historical Sites, Zoos, And Parks Market Revenue Million Forecast, by Geography 2020 & 2033
- Table 4: North America Museums, Historical Sites, Zoos, And Parks Market Revenue Million Forecast, by Region 2020 & 2033
- Table 5: North America Museums, Historical Sites, Zoos, And Parks Market Revenue Million Forecast, by Type 2020 & 2033
- Table 6: North America Museums, Historical Sites, Zoos, And Parks Market Revenue Million Forecast, by Revenue Source 2020 & 2033
- Table 7: North America Museums, Historical Sites, Zoos, And Parks Market Revenue Million Forecast, by Geography 2020 & 2033
- Table 8: North America Museums, Historical Sites, Zoos, And Parks Market Revenue Million Forecast, by Country 2020 & 2033
- Table 9: North America Museums, Historical Sites, Zoos, And Parks Market Revenue Million Forecast, by Type 2020 & 2033
- Table 10: North America Museums, Historical Sites, Zoos, And Parks Market Revenue Million Forecast, by Revenue Source 2020 & 2033
- Table 11: North America Museums, Historical Sites, Zoos, And Parks Market Revenue Million Forecast, by Geography 2020 & 2033
- Table 12: North America Museums, Historical Sites, Zoos, And Parks Market Revenue Million Forecast, by Country 2020 & 2033
- Table 13: North America Museums, Historical Sites, Zoos, And Parks Market Revenue Million Forecast, by Type 2020 & 2033
- Table 14: North America Museums, Historical Sites, Zoos, And Parks Market Revenue Million Forecast, by Revenue Source 2020 & 2033
- Table 15: North America Museums, Historical Sites, Zoos, And Parks Market Revenue Million Forecast, by Geography 2020 & 2033
- Table 16: North America Museums, Historical Sites, Zoos, And Parks Market Revenue Million Forecast, by Country 2020 & 2033
Frequently Asked Questions
1. What is the projected Compound Annual Growth Rate (CAGR) of the North America Museums, Historical Sites, Zoos, And Parks Market?
The projected CAGR is approximately 16.08%.
2. Which companies are prominent players in the North America Museums, Historical Sites, Zoos, And Parks Market?
Key companies in the market include National Gallery of Art Washington D C, USS Midway Museum, Art Institute of Chicago, Gettysburg National Battlefield, The American Museum of Natural History, The Montreal Museum of Fine Arts, Art Gallery of Ontario, Independence Hall, Museum of Anthropology at UBC, Houston Zoo, Jamestown Settlement, Cincinnati Zoo & Botanical Garden, Yellowstone National Park**List Not Exhaustive, The Statue of Liberty.
3. What are the main segments of the North America Museums, Historical Sites, Zoos, And Parks Market?
The market segments include Type, Revenue Source, Geography.
4. Can you provide details about the market size?
The market size is estimated to be USD 25.05 Million as of 2022.
5. What are some drivers contributing to market growth?
Growing Tourism Increasing Demand for Hospitality Services; Consistent Demand for Business Travel and Corporate Hospitality Services.
6. What are the notable trends driving market growth?
Significance of Historical Sites Nurturing North America's Cultural and Economic Landscape.
7. Are there any restraints impacting market growth?
Stringent Government Policies and Regulations Limiting the Market Growth; Lack of Skilled Labor is a Challenge for the Market.
8. Can you provide examples of recent developments in the market?
March 2023: The Columbus Zoo and Aquarium and The Wilds, its wildlife conservation center, announced a capital spending program to stretch over the next 12 to 18 months. Projects include improved animal well-being, enhanced guest experiences, and additional lodging. Approximately $32.5 million is set aside for the redevelopment of the North American region.
9. What pricing options are available for accessing the report?
Pricing options include single-user, multi-user, and enterprise licenses priced at USD 4750, USD 5250, and USD 8750 respectively.
10. Is the market size provided in terms of value or volume?
The market size is provided in terms of value, measured in Million.
11. Are there any specific market keywords associated with the report?
Yes, the market keyword associated with the report is "North America Museums, Historical Sites, Zoos, And Parks Market," which aids in identifying and referencing the specific market segment covered.
12. How do I determine which pricing option suits my needs best?
The pricing options vary based on user requirements and access needs. Individual users may opt for single-user licenses, while businesses requiring broader access may choose multi-user or enterprise licenses for cost-effective access to the report.
13. Are there any additional resources or data provided in the North America Museums, Historical Sites, Zoos, And Parks Market report?
While the report offers comprehensive insights, it's advisable to review the specific contents or supplementary materials provided to ascertain if additional resources or data are available.
14. How can I stay updated on further developments or reports in the North America Museums, Historical Sites, Zoos, And Parks Market?
To stay informed about further developments, trends, and reports in the North America Museums, Historical Sites, Zoos, And Parks Market, consider subscribing to industry newsletters, following relevant companies and organizations, or regularly checking reputable industry news sources and publications.
Methodology
Step 1 - Identification of Relevant Samples Size from Population Database


Step 2 - Approaches for Defining Global Market Size (Value, Volume* & Price*)

Note*: In applicable scenarios
Step 3 - Data Sources
Primary Research
- Web Analytics
- Survey Reports
- Research Institute
- Latest Research Reports
- Opinion Leaders
Secondary Research
- Annual Reports
- White Paper
- Latest Press Release
- Industry Association
- Paid Database
- Investor Presentations

Step 4 - Data Triangulation
Involves using different sources of information in order to increase the validity of a study
These sources are likely to be stakeholders in a program - participants, other researchers, program staff, other community members, and so on.
Then we put all data in single framework & apply various statistical tools to find out the dynamic on the market.
During the analysis stage, feedback from the stakeholder groups would be compared to determine areas of agreement as well as areas of divergence