

Key Insights
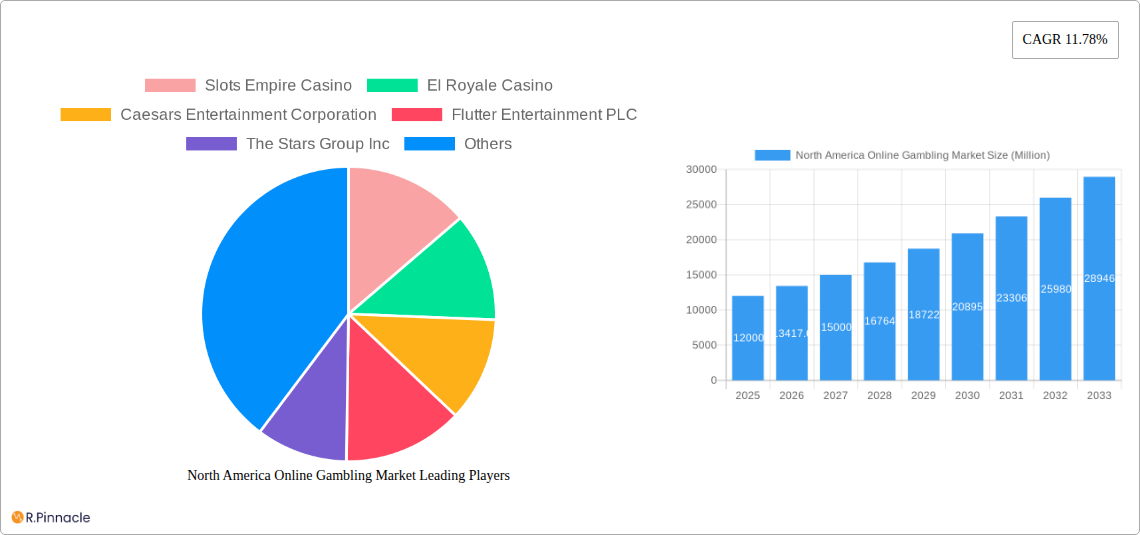
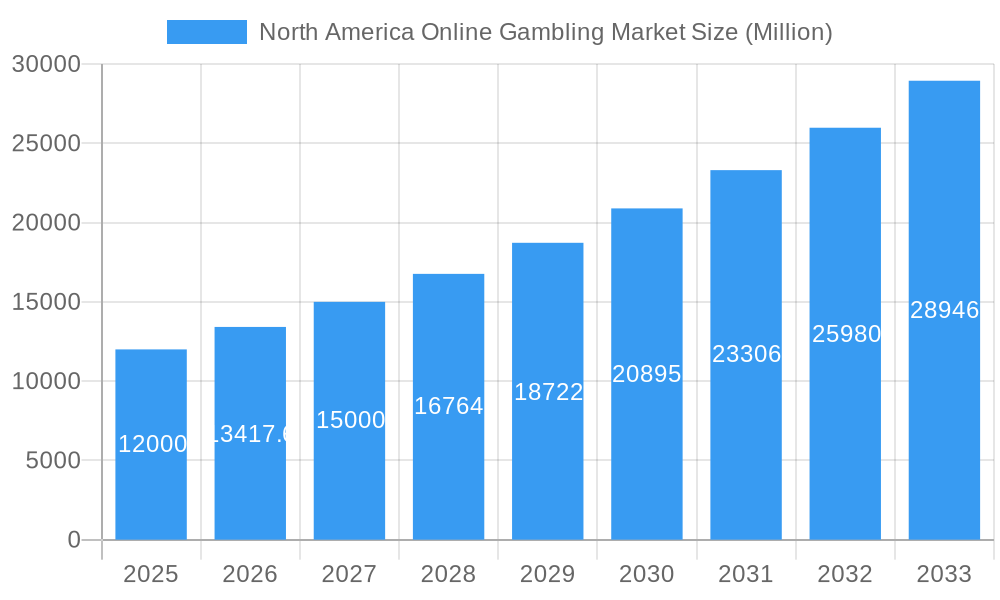
The North American online gambling market is experiencing robust growth, driven by increasing smartphone penetration, the expanding legalization of online betting across various states, and the rising popularity of diverse gaming options. The market's Compound Annual Growth Rate (CAGR) of 11.78% from 2019 to 2024 indicates a significant upward trajectory. This growth is particularly noticeable in segments like sports betting and casino games, fueled by sophisticated marketing campaigns and the convenience of mobile platforms. The popularity of mobile gaming is a key factor, with a significant portion of the market share coming from mobile devices. While the exact market size for 2025 isn't provided, extrapolating from the 11.78% CAGR and assuming a reasonable market size in 2024, a conservative estimate for the 2025 North American online gambling market value would fall within the range of $10-15 billion. This estimate takes into account potential fluctuations based on regulatory changes and evolving consumer preferences.
North America Online Gambling Market Market Size (In Billion)
Looking ahead to 2033, continued growth is projected, although at a potentially slightly moderated rate as the market matures. Factors like increased competition, evolving regulations, and responsible gambling initiatives will influence this growth. The market segmentation by device (desktop and mobile) and game type (sports betting, casino, other casino games) offers opportunities for targeted marketing and investment strategies. The dominance of key players like Caesars Entertainment, DraftKings, and Flutter Entertainment shapes market dynamics, however, the emergence of smaller, niche operators catering to specific demographics and game preferences could challenge the established giants. Geographical variations within North America also exist, with some states exhibiting faster adoption rates than others. Overall, the North American online gambling market presents significant opportunities for both established players and emerging companies, requiring strategic adaptation to evolving consumer behaviors and regulatory landscapes.
North America Online Gambling Market Company Market Share
North America Online Gambling Market: A Comprehensive Report (2019-2033)
This comprehensive report provides an in-depth analysis of the North America online gambling market, offering valuable insights for industry professionals, investors, and stakeholders. Covering the period from 2019 to 2033, with a focus on 2025, this report analyzes market dynamics, key players, and future growth potential. The market is projected to reach xx Million by 2033, exhibiting a robust CAGR.
North America Online Gambling Market Market Structure & Innovation Trends
The North American online gambling market is characterized by a dynamic interplay of established players and emerging competitors. Market concentration is moderate, with a few dominant players holding significant market share, while numerous smaller operators contribute to the overall market volume. The market share of the top 5 players is estimated at xx%. Innovation is driven by technological advancements, including improved mobile gaming experiences, virtual reality integration, and the development of new game formats. Regulatory frameworks vary significantly across states and provinces, impacting market access and operational strategies. Product substitutes, such as social casino games and other forms of online entertainment, exert some competitive pressure. The end-user demographic is expanding, attracting a broader range of age groups and preferences. M&A activity is significant, with deal values reaching into the billions.
- Key M&A Activities:
- July 2022: 888 Holdings' acquisition of William Hill's non-US business (value: xx Million).
- May 2022: DraftKings' acquisition of Golden Nugget Online Gaming (GNOG) (value: xx Million).
North America Online Gambling Market Market Dynamics & Trends
The North American online gambling market is experiencing robust growth, driven by several factors. Increasing legalization and regulation in various jurisdictions are expanding market access, leading to significant market penetration. Technological advancements, such as the development of mobile-optimized gaming platforms and improved user interfaces, are enhancing user experience and driving adoption. Changing consumer preferences towards convenient and readily available entertainment options are also contributing to market growth. Competitive dynamics are intensifying, with players focusing on product diversification, brand building, and strategic partnerships. The market is witnessing a shift toward personalized gaming experiences, leveraging data analytics to cater to individual player preferences.
Dominant Regions & Segments in North America Online Gambling Market
The market exhibits significant regional variations, with some states and provinces showing faster growth than others due to factors like favorable regulatory environments, higher disposable incomes, and robust internet penetration. The mobile segment dominates the market, driven by increasing smartphone penetration and convenient mobile gaming.
Leading Regions (by market size in Million):
- [State/Province 1]: xx Million
- [State/Province 2]: xx Million
- [State/Province 3]: xx Million
Dominant Segments (By Device and Game Type):
- By Device: Mobile surpasses desktop significantly due to its portability and convenience. The mobile segment is projected to achieve xx% market share by 2033.
- By Game Type: Sports betting and casino games are the largest segments, with sports betting experiencing rapid growth due to increasing popularity and the expansion of legalized sports betting across jurisdictions. Other casino games show steady growth, fueled by the introduction of innovative game formats and interactive features.
North America Online Gambling Market Product Innovations
Product innovation is a key driver of market growth. This includes improvements in game design, the incorporation of virtual and augmented reality, the development of eSports betting platforms and the rise of social casino games. These innovations enhance user experience, attract new customer segments, and create new revenue streams. Technological advancements are also enabling the development of personalized gaming experiences, using data analytics to tailor game offerings to individual player preferences.
Report Scope & Segmentation Analysis
This report segments the North American online gambling market by device (desktop, mobile) and game type (sports betting, casino, other casino games). Growth projections vary across segments, with mobile and sports betting showing particularly strong growth. The market size for each segment is detailed within the full report. Competitive dynamics are analyzed within each segment, highlighting key players and their market strategies.
- By Device: Mobile is expected to witness the highest growth rate compared to the desktop segment due to its ease of access and increasing smartphone penetration.
- By Game Type: Sports betting exhibits substantial growth driven by increased legalization and media attention. Casino games retain a significant market share due to their enduring appeal and consistent popularity. Other casino games show promising growth prospects with innovative game formats.
Key Drivers of North America Online Gambling Market Growth
Several factors are driving the growth of the North American online gambling market. These include the increasing legalization and regulation of online gambling in numerous jurisdictions, technological advancements enhancing user experience (e.g., mobile optimization, virtual reality integration), and evolving consumer preferences towards convenient and accessible entertainment options. Furthermore, strategic partnerships and M&A activities are contributing to market consolidation and expansion.
Challenges in the North America Online Gambling Market Sector
The North American online gambling market faces several challenges, including varying regulatory frameworks across different states and provinces, potentially creating operational complexities. Competition is fierce, requiring companies to invest heavily in marketing and product innovation to maintain market share. Maintaining regulatory compliance and preventing underage gambling remain significant concerns.
Emerging Opportunities in North America Online Gambling Market
Emerging opportunities exist in expanding into newly legalized markets, leveraging advancements in virtual and augmented reality for enhanced gaming experiences, and catering to the growing demand for personalized and socially interactive gaming platforms. Furthermore, the integration of blockchain technology and cryptocurrencies offers potential for new payment systems and game mechanics.
Leading Players in the North America Online Gambling Market Market
- Caesars Entertainment Corporation
- Flutter Entertainment PLC
- 888 Holding PLC
- DraftKings (Golden Nugget)
- Slots Empire Casino
- El Royale Casino
- The Stars Group Inc
- BoVegas
- Cherry Gold Casino
- MGM Resorts International (Borgata Hotel Casino & Spa)
- Wild Casino (List Not Exhaustive)
Key Developments in North America Online Gambling Market Industry
- July 2022: 888 Holdings acquired William Hill's non-US business from Caesars Entertainment, significantly expanding its market presence.
- May 2022: DraftKings acquired Golden Nugget Online Gaming (GNOG), strengthening its market position and diversifying its product offerings.
- July 2021: Flutter Entertainment's FanDuel Group expanded its FanDuel Casino offerings in New Jersey and Michigan, enhancing its reach and market share.
Future Outlook for North America Online Gambling Market Market
The North American online gambling market is poised for continued robust growth, driven by factors such as increasing legalization, technological advancements, and evolving consumer preferences. Strategic acquisitions, partnerships, and product innovations will play a crucial role in shaping the future competitive landscape. The market is projected to witness significant expansion in the coming years, presenting substantial opportunities for both established players and new entrants.
North America Online Gambling Market Segmentation
-
1. Game Type
- 1.1. Sports Betting
-
1.2. Casino
- 1.2.1. Live Casino
- 1.2.2. Slots
- 1.2.3. Baccarat
- 1.2.4. Blackjack
- 1.2.5. Poker
- 1.2.6. Other Casino Games
- 1.3. Other Game Types
-
2. Device
- 2.1. Desktop
- 2.2. Mobile
-
3. Geography
- 3.1. United States
- 3.2. Canada
- 3.3. Mexico
- 3.4. Rest of the North America
North America Online Gambling Market Segmentation By Geography
- 1. United States
- 2. Canada
- 3. Mexico
- 4. Rest of the North America
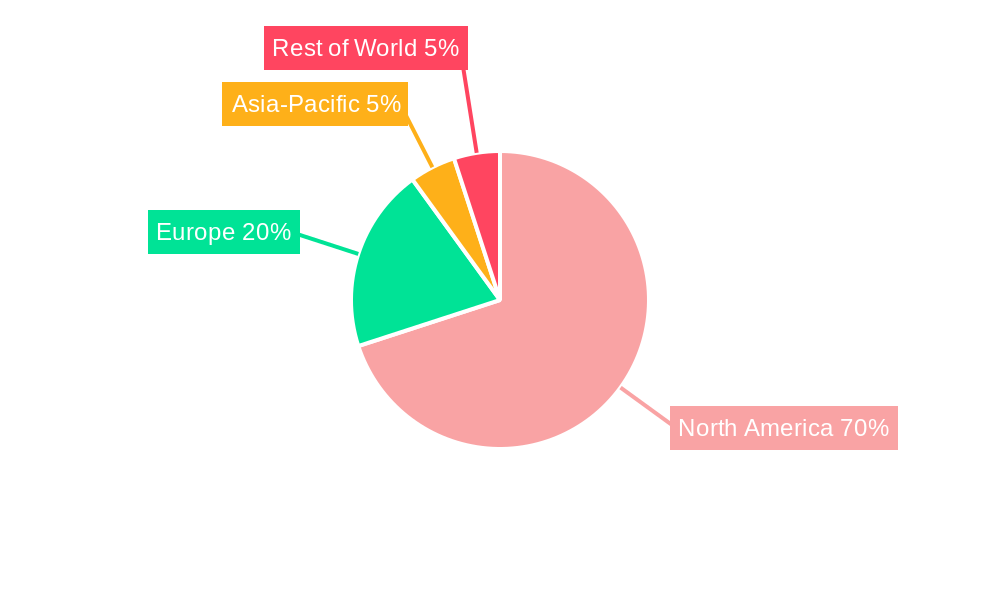
North America Online Gambling Market Regional Market Share
Geographic Coverage of North America Online Gambling Market
North America Online Gambling Market REPORT HIGHLIGHTS
| Aspects | Details |
|---|---|
| Study Period | 2020-2034 |
| Base Year | 2025 |
| Estimated Year | 2026 |
| Forecast Period | 2026-2034 |
| Historical Period | 2020-2025 |
| Growth Rate | CAGR of 11.78% from 2020-2034 |
| Segmentation |
|
Table of Contents
- 1. Introduction
- 1.1. Research Scope
- 1.2. Market Segmentation
- 1.3. Research Objective
- 1.4. Definitions and Assumptions
- 2. Executive Summary
- 2.1. Market Snapshot
- 3. Market Dynamics
- 3.1. Market Drivers
- 3.2. Market Restrains
- 3.3. Market Trends
- 3.4. Market Opportunities
- 4. Market Factor Analysis
- 4.1. Porters Five Forces
- 4.1.1. Bargaining Power of Suppliers
- 4.1.2. Bargaining Power of Buyers
- 4.1.3. Threat of New Entrants
- 4.1.4. Threat of Substitutes
- 4.1.5. Competitive Rivalry
- 4.2. PESTEL analysis
- 4.3. BCG Analysis
- 4.3.1. Stars (High Growth, High Market Share)
- 4.3.2. Cash Cows (Low Growth, High Market Share)
- 4.3.3. Question Mark (High Growth, Low Market Share)
- 4.3.4. Dogs (Low Growth, Low Market Share)
- 4.4. Ansoff Matrix Analysis
- 4.5. Supply Chain Analysis
- 4.6. Regulatory Landscape
- 4.7. Current Market Potential and Opportunity Assessment (TAM–SAM–SOM Framework)
- 4.8. PRI Analyst Note
- 4.1. Porters Five Forces
- 5. Market Analysis, Insights and Forecast 2021-2033
- 5.1. Market Analysis, Insights and Forecast - by Game Type
- 5.1.1. Sports Betting
- 5.1.2. Casino
- 5.1.2.1. Live Casino
- 5.1.2.2. Slots
- 5.1.2.3. Baccarat
- 5.1.2.4. Blackjack
- 5.1.2.5. Poker
- 5.1.2.6. Other Casino Games
- 5.1.3. Other Game Types
- 5.2. Market Analysis, Insights and Forecast - by Device
- 5.2.1. Desktop
- 5.2.2. Mobile
- 5.3. Market Analysis, Insights and Forecast - by Geography
- 5.3.1. United States
- 5.3.2. Canada
- 5.3.3. Mexico
- 5.3.4. Rest of the North America
- 5.4. Market Analysis, Insights and Forecast - by Region
- 5.4.1. United States
- 5.4.2. Canada
- 5.4.3. Mexico
- 5.4.4. Rest of the North America
- 5.1. Market Analysis, Insights and Forecast - by Game Type
- 6. North America Online Gambling Market Analysis, Insights and Forecast, 2021-2033
- 6.1. Market Analysis, Insights and Forecast - by Game Type
- 6.1.1. Sports Betting
- 6.1.2. Casino
- 6.1.2.1. Live Casino
- 6.1.2.2. Slots
- 6.1.2.3. Baccarat
- 6.1.2.4. Blackjack
- 6.1.2.5. Poker
- 6.1.2.6. Other Casino Games
- 6.1.3. Other Game Types
- 6.2. Market Analysis, Insights and Forecast - by Device
- 6.2.1. Desktop
- 6.2.2. Mobile
- 6.3. Market Analysis, Insights and Forecast - by Geography
- 6.3.1. United States
- 6.3.2. Canada
- 6.3.3. Mexico
- 6.3.4. Rest of the North America
- 6.1. Market Analysis, Insights and Forecast - by Game Type
- 7. United States North America Online Gambling Market Analysis, Insights and Forecast, 2020-2032
- 7.1. Market Analysis, Insights and Forecast - by Game Type
- 7.1.1. Sports Betting
- 7.1.2. Casino
- 7.1.2.1. Live Casino
- 7.1.2.2. Slots
- 7.1.2.3. Baccarat
- 7.1.2.4. Blackjack
- 7.1.2.5. Poker
- 7.1.2.6. Other Casino Games
- 7.1.3. Other Game Types
- 7.2. Market Analysis, Insights and Forecast - by Device
- 7.2.1. Desktop
- 7.2.2. Mobile
- 7.3. Market Analysis, Insights and Forecast - by Geography
- 7.3.1. United States
- 7.3.2. Canada
- 7.3.3. Mexico
- 7.3.4. Rest of the North America
- 7.1. Market Analysis, Insights and Forecast - by Game Type
- 8. Canada North America Online Gambling Market Analysis, Insights and Forecast, 2020-2032
- 8.1. Market Analysis, Insights and Forecast - by Game Type
- 8.1.1. Sports Betting
- 8.1.2. Casino
- 8.1.2.1. Live Casino
- 8.1.2.2. Slots
- 8.1.2.3. Baccarat
- 8.1.2.4. Blackjack
- 8.1.2.5. Poker
- 8.1.2.6. Other Casino Games
- 8.1.3. Other Game Types
- 8.2. Market Analysis, Insights and Forecast - by Device
- 8.2.1. Desktop
- 8.2.2. Mobile
- 8.3. Market Analysis, Insights and Forecast - by Geography
- 8.3.1. United States
- 8.3.2. Canada
- 8.3.3. Mexico
- 8.3.4. Rest of the North America
- 8.1. Market Analysis, Insights and Forecast - by Game Type
- 9. Mexico North America Online Gambling Market Analysis, Insights and Forecast, 2020-2032
- 9.1. Market Analysis, Insights and Forecast - by Game Type
- 9.1.1. Sports Betting
- 9.1.2. Casino
- 9.1.2.1. Live Casino
- 9.1.2.2. Slots
- 9.1.2.3. Baccarat
- 9.1.2.4. Blackjack
- 9.1.2.5. Poker
- 9.1.2.6. Other Casino Games
- 9.1.3. Other Game Types
- 9.2. Market Analysis, Insights and Forecast - by Device
- 9.2.1. Desktop
- 9.2.2. Mobile
- 9.3. Market Analysis, Insights and Forecast - by Geography
- 9.3.1. United States
- 9.3.2. Canada
- 9.3.3. Mexico
- 9.3.4. Rest of the North America
- 9.1. Market Analysis, Insights and Forecast - by Game Type
- 10. Rest of the North America North America Online Gambling Market Analysis, Insights and Forecast, 2020-2032
- 10.1. Market Analysis, Insights and Forecast - by Game Type
- 10.1.1. Sports Betting
- 10.1.2. Casino
- 10.1.2.1. Live Casino
- 10.1.2.2. Slots
- 10.1.2.3. Baccarat
- 10.1.2.4. Blackjack
- 10.1.2.5. Poker
- 10.1.2.6. Other Casino Games
- 10.1.3. Other Game Types
- 10.2. Market Analysis, Insights and Forecast - by Device
- 10.2.1. Desktop
- 10.2.2. Mobile
- 10.3. Market Analysis, Insights and Forecast - by Geography
- 10.3.1. United States
- 10.3.2. Canada
- 10.3.3. Mexico
- 10.3.4. Rest of the North America
- 10.1. Market Analysis, Insights and Forecast - by Game Type
- 11. Competitive Analysis
- 11.1. Company Profiles
- 11.1.1 Slots Empire Casino
- 11.1.1.1. Company Overview
- 11.1.1.2. Products
- 11.1.1.3. Company Financials
- 11.1.1.4. SWOT Analysis
- 11.1.2 El Royale Casino
- 11.1.2.1. Company Overview
- 11.1.2.2. Products
- 11.1.2.3. Company Financials
- 11.1.2.4. SWOT Analysis
- 11.1.3 Caesars Entertainment Corporation
- 11.1.3.1. Company Overview
- 11.1.3.2. Products
- 11.1.3.3. Company Financials
- 11.1.3.4. SWOT Analysis
- 11.1.4 Flutter Entertainment PLC
- 11.1.4.1. Company Overview
- 11.1.4.2. Products
- 11.1.4.3. Company Financials
- 11.1.4.4. SWOT Analysis
- 11.1.5 The Stars Group Inc
- 11.1.5.1. Company Overview
- 11.1.5.2. Products
- 11.1.5.3. Company Financials
- 11.1.5.4. SWOT Analysis
- 11.1.6 BoVegas
- 11.1.6.1. Company Overview
- 11.1.6.2. Products
- 11.1.6.3. Company Financials
- 11.1.6.4. SWOT Analysis
- 11.1.7 888 Holding PLC
- 11.1.7.1. Company Overview
- 11.1.7.2. Products
- 11.1.7.3. Company Financials
- 11.1.7.4. SWOT Analysis
- 11.1.8 Cherry Gold Casino*List Not Exhaustive
- 11.1.8.1. Company Overview
- 11.1.8.2. Products
- 11.1.8.3. Company Financials
- 11.1.8.4. SWOT Analysis
- 11.1.9 MGM Resorts International (Borgata Hotel Casino & Spa)
- 11.1.9.1. Company Overview
- 11.1.9.2. Products
- 11.1.9.3. Company Financials
- 11.1.9.4. SWOT Analysis
- 11.1.10 Wild Casino
- 11.1.10.1. Company Overview
- 11.1.10.2. Products
- 11.1.10.3. Company Financials
- 11.1.10.4. SWOT Analysis
- 11.1.11 DraftKings (Golden Nugget
- 11.1.11.1. Company Overview
- 11.1.11.2. Products
- 11.1.11.3. Company Financials
- 11.1.11.4. SWOT Analysis
- 11.1.1 Slots Empire Casino
- 11.2. Market Entropy
- 11.2.1 Company's Key Areas Served
- 11.2.2 Recent Developments
- 11.3. Company Market Share Analysis 2025
- 11.3.1 Top 5 Companies Market Share Analysis
- 11.3.2 Top 3 Companies Market Share Analysis
- 11.4. List of Potential Customers
- 12. Research Methodology
List of Figures
- Figure 1: North America Online Gambling Market Revenue Breakdown (Million, %) by Product 2025 & 2033
- Figure 2: North America Online Gambling Market Share (%) by Company 2025
List of Tables
- Table 1: North America Online Gambling Market Revenue Million Forecast, by Game Type 2020 & 2033
- Table 2: North America Online Gambling Market Revenue Million Forecast, by Device 2020 & 2033
- Table 3: North America Online Gambling Market Revenue Million Forecast, by Geography 2020 & 2033
- Table 4: North America Online Gambling Market Revenue Million Forecast, by Region 2020 & 2033
- Table 5: North America Online Gambling Market Revenue Million Forecast, by Game Type 2020 & 2033
- Table 6: North America Online Gambling Market Revenue Million Forecast, by Device 2020 & 2033
- Table 7: North America Online Gambling Market Revenue Million Forecast, by Geography 2020 & 2033
- Table 8: North America Online Gambling Market Revenue Million Forecast, by Country 2020 & 2033
- Table 9: North America Online Gambling Market Revenue Million Forecast, by Game Type 2020 & 2033
- Table 10: North America Online Gambling Market Revenue Million Forecast, by Device 2020 & 2033
- Table 11: North America Online Gambling Market Revenue Million Forecast, by Geography 2020 & 2033
- Table 12: North America Online Gambling Market Revenue Million Forecast, by Country 2020 & 2033
- Table 13: North America Online Gambling Market Revenue Million Forecast, by Game Type 2020 & 2033
- Table 14: North America Online Gambling Market Revenue Million Forecast, by Device 2020 & 2033
- Table 15: North America Online Gambling Market Revenue Million Forecast, by Geography 2020 & 2033
- Table 16: North America Online Gambling Market Revenue Million Forecast, by Country 2020 & 2033
- Table 17: North America Online Gambling Market Revenue Million Forecast, by Game Type 2020 & 2033
- Table 18: North America Online Gambling Market Revenue Million Forecast, by Device 2020 & 2033
- Table 19: North America Online Gambling Market Revenue Million Forecast, by Geography 2020 & 2033
- Table 20: North America Online Gambling Market Revenue Million Forecast, by Country 2020 & 2033
Frequently Asked Questions
1. What is the projected Compound Annual Growth Rate (CAGR) of the North America Online Gambling Market?
The projected CAGR is approximately 11.78%.
2. Which companies are prominent players in the North America Online Gambling Market?
Key companies in the market include Slots Empire Casino, El Royale Casino, Caesars Entertainment Corporation, Flutter Entertainment PLC, The Stars Group Inc, BoVegas, 888 Holding PLC, Cherry Gold Casino*List Not Exhaustive, MGM Resorts International (Borgata Hotel Casino & Spa), Wild Casino, DraftKings (Golden Nugget.
3. What are the main segments of the North America Online Gambling Market?
The market segments include Game Type, Device, Geography.
4. Can you provide details about the market size?
The market size is estimated to be USD XX Million as of 2022.
5. What are some drivers contributing to market growth?
Shift in Shopping Mode Preferences of the people; Increasing Urbanization; Growing Disposable Income.
6. What are the notable trends driving market growth?
The Increasing Adoption of Internet and Internet-based Devices Supports Market Growth..
7. Are there any restraints impacting market growth?
High-priced products and additional delivery charges; Inconsistency in product quality.
8. Can you provide examples of recent developments in the market?
July 2022: 888 Holdings acquired William Hill's non-US business from Caesars Entertainment. William Hill is a popular online gambling platform brand.
9. What pricing options are available for accessing the report?
Pricing options include single-user, multi-user, and enterprise licenses priced at USD 4750, USD 5250, and USD 8750 respectively.
10. Is the market size provided in terms of value or volume?
The market size is provided in terms of value, measured in Million.
11. Are there any specific market keywords associated with the report?
Yes, the market keyword associated with the report is "North America Online Gambling Market," which aids in identifying and referencing the specific market segment covered.
12. How do I determine which pricing option suits my needs best?
The pricing options vary based on user requirements and access needs. Individual users may opt for single-user licenses, while businesses requiring broader access may choose multi-user or enterprise licenses for cost-effective access to the report.
13. Are there any additional resources or data provided in the North America Online Gambling Market report?
While the report offers comprehensive insights, it's advisable to review the specific contents or supplementary materials provided to ascertain if additional resources or data are available.
14. How can I stay updated on further developments or reports in the North America Online Gambling Market?
To stay informed about further developments, trends, and reports in the North America Online Gambling Market, consider subscribing to industry newsletters, following relevant companies and organizations, or regularly checking reputable industry news sources and publications.
Methodology
Step 1 - Identification of Relevant Samples Size from Population Database


Step 2 - Approaches for Defining Global Market Size (Value, Volume* & Price*)

Note*: In applicable scenarios
Step 3 - Data Sources
Primary Research
- Web Analytics
- Survey Reports
- Research Institute
- Latest Research Reports
- Opinion Leaders
Secondary Research
- Annual Reports
- White Paper
- Latest Press Release
- Industry Association
- Paid Database
- Investor Presentations

Step 4 - Data Triangulation
Involves using different sources of information in order to increase the validity of a study
These sources are likely to be stakeholders in a program - participants, other researchers, program staff, other community members, and so on.
Then we put all data in single framework & apply various statistical tools to find out the dynamic on the market.
During the analysis stage, feedback from the stakeholder groups would be compared to determine areas of agreement as well as areas of divergence