

Key Insights
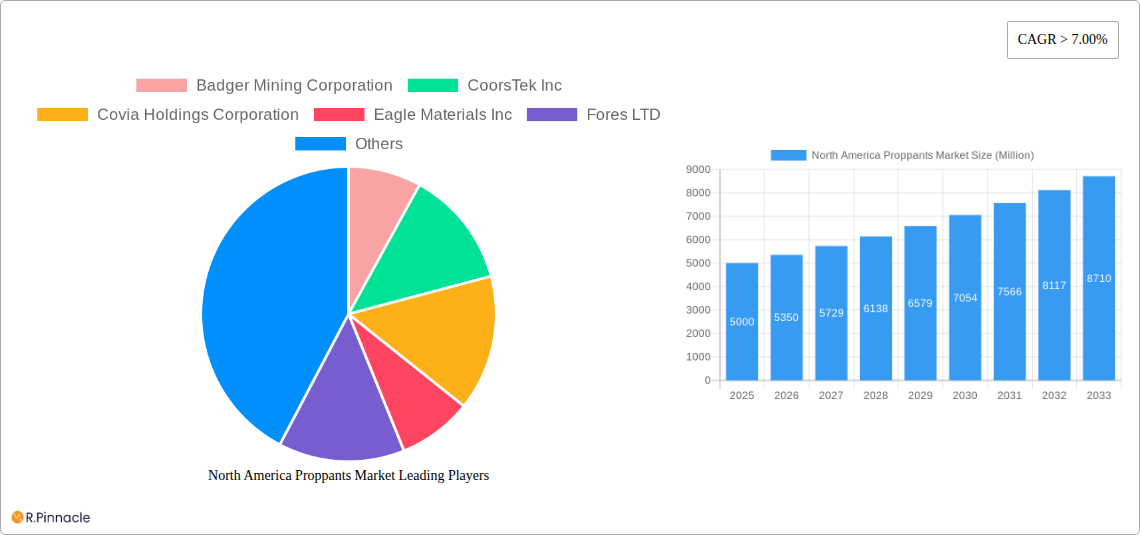
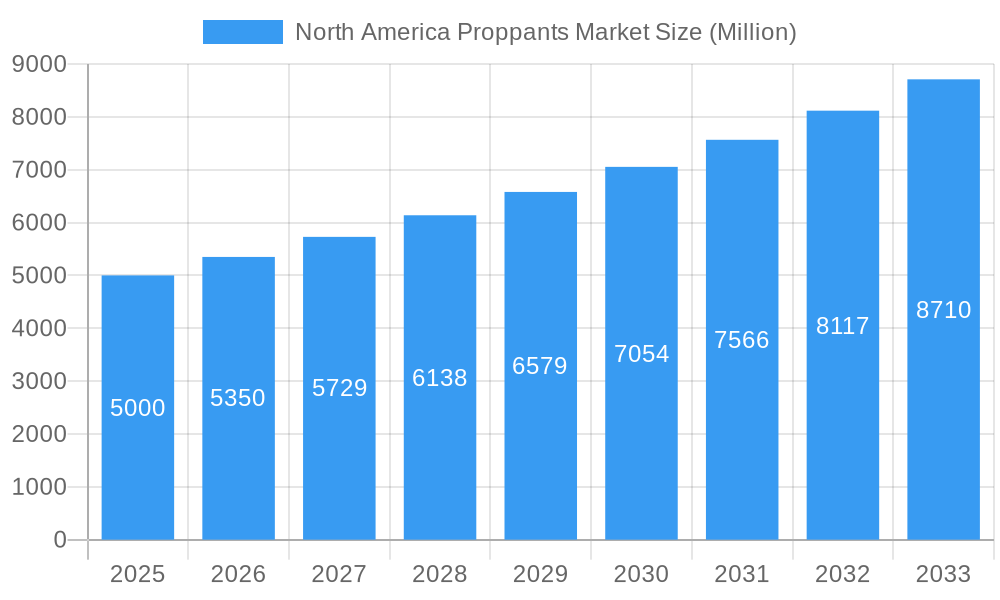
The North America proppants market, valued at approximately $6.59 billion in 2025, is projected to experience robust growth. Exhibiting a Compound Annual Growth Rate (CAGR) of 16.02% from 2025 to 2033, this expansion is primarily driven by sustained oil and gas industry growth, particularly in unconventional resource extraction like shale gas and tight oil. Increased hydraulic fracturing activities in major North American basins, including the Permian, Marcellus, and Bakken, are significantly boosting proppant demand. Technological advancements in proppant manufacturing, leading to higher-strength and more efficient options, further contribute to market growth. The industry also notes a trend towards sustainable and environmentally friendly proppant solutions, influenced by increasing regulatory scrutiny and heightened environmental awareness.
North America Proppants Market Market Size (In Billion)
However, market growth faces restraints from fluctuating oil and gas prices, impacting exploration and production investment decisions. The development of alternative completion techniques, while currently limited in market impact, presents a potential long-term threat. Despite these constraints, the continued need for effective well stimulation in oil and gas extraction, coupled with ongoing technological innovations, ensures a positive outlook for the North America proppants market. Market segmentation includes various proppant types (sand, ceramic, resin-coated) to address diverse operational needs and cost considerations. Key players, such as Badger Mining Corporation and CoorsTek Inc., are actively optimizing production, expanding capacities, and introducing new product lines to maintain market positions in this dynamic sector.
North America Proppants Market Company Market Share
North America Proppants Market Analysis: 2019-2033
This comprehensive report offers in-depth analysis of the North America proppants market, providing invaluable insights for industry professionals, investors, and strategic decision-makers. Covering the period from 2019 to 2033, with a base year of 2025 and a forecast period of 2025-2033, this report meticulously examines market dynamics, competitive landscapes, and future growth potential. It leverages extensive data analysis and expert insights to deliver actionable intelligence for navigating this dynamic market.
North America Proppants Market Structure & Innovation Trends
The North America proppants market exhibits a moderately consolidated structure, with several key players holding significant market share. The market share distribution is dynamic, influenced by mergers and acquisitions (M&A) activity and technological innovation. While exact market share figures for each company are proprietary data, we can analyze trends. For instance, the M&A landscape has seen deals valued in the hundreds of Millions over the past few years, leading to shifts in market concentration.
- Market Concentration: Moderately consolidated, with key players holding significant shares.
- Innovation Drivers: Demand for higher-efficiency proppants, advancements in resin coating technologies, and sustainable sourcing practices.
- Regulatory Framework: Environmental regulations influencing sourcing and disposal methods, impacting operational costs and sustainability strategies.
- Product Substitutes: Limited direct substitutes exist; however, alternative fracturing techniques are emerging as indirect competitors.
- End-User Demographics: Primarily oil and gas companies, with varying needs based on geographical location and well characteristics. The demand is directly tied to the oil and gas exploration and production activity.
- M&A Activities: Significant M&A activity observed in recent years, driving consolidation and reshaping the competitive landscape. Deal values have ranged from tens to hundreds of Millions.
North America Proppants Market Dynamics & Trends
The North America proppants market is characterized by fluctuating growth rates influenced by factors like crude oil prices, shale gas production levels, and technological advancements. The historical period (2019-2024) witnessed periods of both expansion and contraction, mirroring the cyclicality of the oil and gas industry. The estimated year (2025) projects a market size of xx Million, with a projected CAGR of xx% during the forecast period (2025-2033). This growth is being driven by several key factors: increasing demand for hydraulic fracturing, the development of next-generation proppants, and the exploration of unconventional oil and gas reserves.
Market penetration of resin-coated proppants, for example, is steadily increasing due to their superior performance characteristics. Competitive dynamics are shaped by pricing strategies, technological innovation, and access to high-quality raw materials.
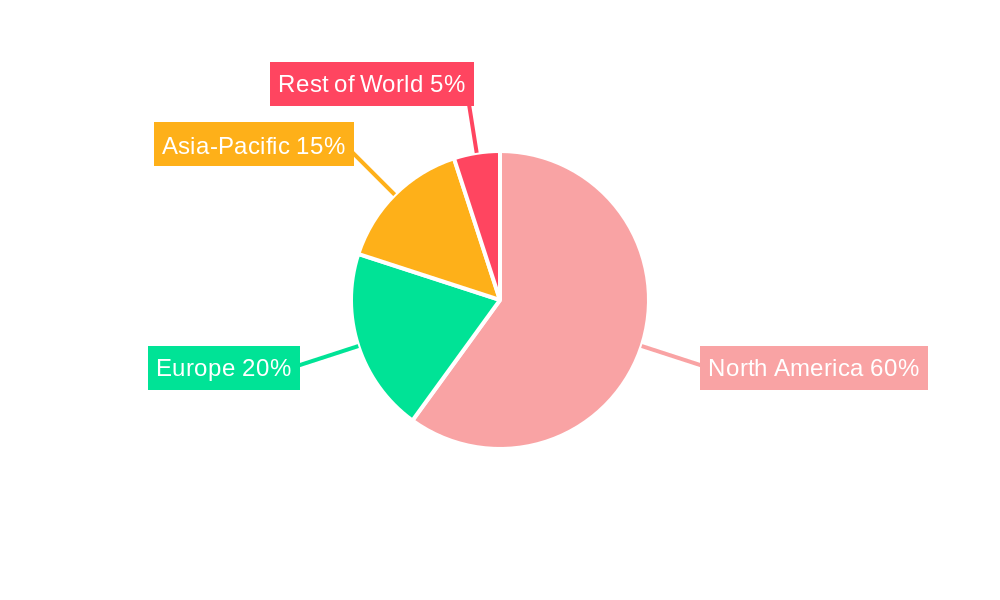
Dominant Regions & Segments in North America Proppants Market
The Permian Basin in the United States remains the dominant region for proppant consumption, driven by extensive shale gas and oil production. Other key regions include the Eagle Ford Shale and the Bakken Shale. The specific segment breakdown and growth varies by region, reflecting the unique geological conditions and energy development activities.
- Key Drivers for the Permian Basin Dominance:
- Abundant shale gas and oil reserves
- Well-developed infrastructure
- Favorable regulatory environment
- High levels of investment in oil and gas exploration and production
The detailed analysis within the report further breaks down this regional dominance, exploring the nuances of each significant region and their contributing factors to market growth.
North America Proppants Market Product Innovations
Recent innovations focus on enhancing proppant performance, including the development of high-strength proppants with improved conductivity and durability. Resin-coated proppants are gaining traction due to their ability to withstand high pressures and temperatures, leading to increased recovery rates. This innovation is driving cost savings by improving efficiency of operations and reducing the overall costs. These developments are directly improving the efficiency and economics of oil and gas exploration and production.
Report Scope & Segmentation Analysis
This report segments the North America proppants market based on several factors:
- By Type: Ceramic proppants, sand proppants (including resin-coated proppants), and others. Each segment exhibits unique growth trajectories and competitive dynamics.
- By Application: Hydraulic fracturing, other well completion activities. Growth in each application area is affected by exploration and production trends.
- By Region: The US, Canada, and Mexico, which show different growth potential, primarily driven by varying levels of oil and gas production. (Detailed regional breakdowns are provided within the full report).
Each segment presents a distinct market size and growth projection. The report explores the competitive dynamics within each segment and provides a detailed view of potential opportunities for each segment.
Key Drivers of North America Proppants Market Growth
The growth of the North America proppants market is fueled by several factors:
- Increased demand for hydraulic fracturing: This remains a primary driver, as unconventional oil and gas extraction continues to grow.
- Technological advancements: Improved proppant designs and manufacturing processes enhance efficiency and performance.
- Government support for oil and gas exploration: Favorable policies in certain regions support market expansion.
Challenges in the North America Proppants Market Sector
The North America proppants market faces various challenges:
- Fluctuations in oil and gas prices: Market growth is closely tied to energy price volatility.
- Environmental regulations: Stringent environmental regulations impact production costs and operational practices.
- Competition: Intense competition among established and emerging players creates price pressure and drives innovation.
Emerging Opportunities in North America Proppants Market
Emerging opportunities exist in:
- Development of eco-friendly proppants: Growing focus on sustainability is driving demand for environmentally responsible options.
- Expansion into new geographic areas: Exploration of untapped unconventional reserves creates new market opportunities.
- Technological advancements: Continuous innovation offers potential for improved efficiency and cost reduction.
Leading Players in the North America Proppants Market Market
- Badger Mining Corporation
- CoorsTek Inc
- Covia Holdings Corporation
- Eagle Materials Inc
- Fores LTD
- Halliburton
- Hexion
- Hi-Crush
- Imerys
- Preferred Proppants LLC
- Saint-Gobain
- Schlumberger Limited
- Superior Silica Sands (Emerge Energy Services)
- US SILICA
- WAYFINDER
- List Not Exhaustive
Key Developments in North America Proppants Market Industry
- September 2022: Hexion Inc. and Wayfinder Corp partnered to enhance resin-coated proppant supply in the Western Canadian Sedimentary Basin.
- October 2021: U.S. Silica explored separating its non-oil and gas division.
Future Outlook for North America Proppants Market Market
The North America proppants market is poised for continued growth, driven by ongoing exploration and production activities in the oil and gas sector and the adoption of innovative proppant technologies. Strategic partnerships, technological advancements, and the focus on sustainability will shape the future landscape. The market will likely experience periods of expansion and contraction, mirroring the cyclical nature of the energy industry, but overall the long-term outlook remains positive.
North America Proppants Market Segmentation
-
1. Type
- 1.1. Frac Sand
- 1.2. Resin Coated
- 1.3. Ceramic
-
2. Geography
- 2.1. United States
- 2.2. Canada
- 2.3. Mexico
North America Proppants Market Segmentation By Geography
- 1. United States
- 2. Canada
- 3. Mexico
North America Proppants Market Regional Market Share
Geographic Coverage of North America Proppants Market
North America Proppants Market REPORT HIGHLIGHTS
| Aspects | Details |
|---|---|
| Study Period | 2020-2034 |
| Base Year | 2025 |
| Estimated Year | 2026 |
| Forecast Period | 2026-2034 |
| Historical Period | 2020-2025 |
| Growth Rate | CAGR of 16.02% from 2020-2034 |
| Segmentation |
|
Table of Contents
- 1. Introduction
- 1.1. Research Scope
- 1.2. Market Segmentation
- 1.3. Research Objective
- 1.4. Definitions and Assumptions
- 2. Executive Summary
- 2.1. Market Snapshot
- 3. Market Dynamics
- 3.1. Market Drivers
- 3.2. Market Restrains
- 3.3. Market Trends
- 3.4. Market Opportunities
- 4. Market Factor Analysis
- 4.1. Porters Five Forces
- 4.1.1. Bargaining Power of Suppliers
- 4.1.2. Bargaining Power of Buyers
- 4.1.3. Threat of New Entrants
- 4.1.4. Threat of Substitutes
- 4.1.5. Competitive Rivalry
- 4.2. PESTEL analysis
- 4.3. BCG Analysis
- 4.3.1. Stars (High Growth, High Market Share)
- 4.3.2. Cash Cows (Low Growth, High Market Share)
- 4.3.3. Question Mark (High Growth, Low Market Share)
- 4.3.4. Dogs (Low Growth, Low Market Share)
- 4.4. Ansoff Matrix Analysis
- 4.5. Supply Chain Analysis
- 4.6. Regulatory Landscape
- 4.7. Current Market Potential and Opportunity Assessment (TAM–SAM–SOM Framework)
- 4.8. PRI Analyst Note
- 4.1. Porters Five Forces
- 5. Market Analysis, Insights and Forecast 2021-2033
- 5.1. Market Analysis, Insights and Forecast - by Type
- 5.1.1. Frac Sand
- 5.1.2. Resin Coated
- 5.1.3. Ceramic
- 5.2. Market Analysis, Insights and Forecast - by Geography
- 5.2.1. United States
- 5.2.2. Canada
- 5.2.3. Mexico
- 5.3. Market Analysis, Insights and Forecast - by Region
- 5.3.1. United States
- 5.3.2. Canada
- 5.3.3. Mexico
- 5.1. Market Analysis, Insights and Forecast - by Type
- 6. Global North America Proppants Market Analysis, Insights and Forecast, 2021-2033
- 6.1. Market Analysis, Insights and Forecast - by Type
- 6.1.1. Frac Sand
- 6.1.2. Resin Coated
- 6.1.3. Ceramic
- 6.2. Market Analysis, Insights and Forecast - by Geography
- 6.2.1. United States
- 6.2.2. Canada
- 6.2.3. Mexico
- 6.1. Market Analysis, Insights and Forecast - by Type
- 7. United States North America Proppants Market Analysis, Insights and Forecast, 2020-2032
- 7.1. Market Analysis, Insights and Forecast - by Type
- 7.1.1. Frac Sand
- 7.1.2. Resin Coated
- 7.1.3. Ceramic
- 7.2. Market Analysis, Insights and Forecast - by Geography
- 7.2.1. United States
- 7.2.2. Canada
- 7.2.3. Mexico
- 7.1. Market Analysis, Insights and Forecast - by Type
- 8. Canada North America Proppants Market Analysis, Insights and Forecast, 2020-2032
- 8.1. Market Analysis, Insights and Forecast - by Type
- 8.1.1. Frac Sand
- 8.1.2. Resin Coated
- 8.1.3. Ceramic
- 8.2. Market Analysis, Insights and Forecast - by Geography
- 8.2.1. United States
- 8.2.2. Canada
- 8.2.3. Mexico
- 8.1. Market Analysis, Insights and Forecast - by Type
- 9. Mexico North America Proppants Market Analysis, Insights and Forecast, 2020-2032
- 9.1. Market Analysis, Insights and Forecast - by Type
- 9.1.1. Frac Sand
- 9.1.2. Resin Coated
- 9.1.3. Ceramic
- 9.2. Market Analysis, Insights and Forecast - by Geography
- 9.2.1. United States
- 9.2.2. Canada
- 9.2.3. Mexico
- 9.1. Market Analysis, Insights and Forecast - by Type
- 10. Competitive Analysis
- 10.1. Company Profiles
- 10.1.1 Badger Mining Corporation
- 10.1.1.1. Company Overview
- 10.1.1.2. Products
- 10.1.1.3. Company Financials
- 10.1.1.4. SWOT Analysis
- 10.1.2 CoorsTek Inc
- 10.1.2.1. Company Overview
- 10.1.2.2. Products
- 10.1.2.3. Company Financials
- 10.1.2.4. SWOT Analysis
- 10.1.3 Covia Holdings Corporation
- 10.1.3.1. Company Overview
- 10.1.3.2. Products
- 10.1.3.3. Company Financials
- 10.1.3.4. SWOT Analysis
- 10.1.4 Eagle Materials Inc
- 10.1.4.1. Company Overview
- 10.1.4.2. Products
- 10.1.4.3. Company Financials
- 10.1.4.4. SWOT Analysis
- 10.1.5 Fores LTD
- 10.1.5.1. Company Overview
- 10.1.5.2. Products
- 10.1.5.3. Company Financials
- 10.1.5.4. SWOT Analysis
- 10.1.6 Halliburton
- 10.1.6.1. Company Overview
- 10.1.6.2. Products
- 10.1.6.3. Company Financials
- 10.1.6.4. SWOT Analysis
- 10.1.7 Hexion
- 10.1.7.1. Company Overview
- 10.1.7.2. Products
- 10.1.7.3. Company Financials
- 10.1.7.4. SWOT Analysis
- 10.1.8 Hi-Crush
- 10.1.8.1. Company Overview
- 10.1.8.2. Products
- 10.1.8.3. Company Financials
- 10.1.8.4. SWOT Analysis
- 10.1.9 Imerys
- 10.1.9.1. Company Overview
- 10.1.9.2. Products
- 10.1.9.3. Company Financials
- 10.1.9.4. SWOT Analysis
- 10.1.10 Preferred Proppants LLC
- 10.1.10.1. Company Overview
- 10.1.10.2. Products
- 10.1.10.3. Company Financials
- 10.1.10.4. SWOT Analysis
- 10.1.11 Saint-Gobain
- 10.1.11.1. Company Overview
- 10.1.11.2. Products
- 10.1.11.3. Company Financials
- 10.1.11.4. SWOT Analysis
- 10.1.12 Schlumberger Limited
- 10.1.12.1. Company Overview
- 10.1.12.2. Products
- 10.1.12.3. Company Financials
- 10.1.12.4. SWOT Analysis
- 10.1.13 Superior Silica Sands (Emerge Energy Services)
- 10.1.13.1. Company Overview
- 10.1.13.2. Products
- 10.1.13.3. Company Financials
- 10.1.13.4. SWOT Analysis
- 10.1.14 US SILICA
- 10.1.14.1. Company Overview
- 10.1.14.2. Products
- 10.1.14.3. Company Financials
- 10.1.14.4. SWOT Analysis
- 10.1.15 WAYFINDER*List Not Exhaustive
- 10.1.15.1. Company Overview
- 10.1.15.2. Products
- 10.1.15.3. Company Financials
- 10.1.15.4. SWOT Analysis
- 10.1.1 Badger Mining Corporation
- 10.2. Market Entropy
- 10.2.1 Company's Key Areas Served
- 10.2.2 Recent Developments
- 10.3. Company Market Share Analysis 2025
- 10.3.1 Top 5 Companies Market Share Analysis
- 10.3.2 Top 3 Companies Market Share Analysis
- 10.4. List of Potential Customers
- 11. Research Methodology
List of Figures
- Figure 1: Global North America Proppants Market Revenue Breakdown (billion, %) by Region 2025 & 2033
- Figure 2: United States North America Proppants Market Revenue (billion), by Type 2025 & 2033
- Figure 3: United States North America Proppants Market Revenue Share (%), by Type 2025 & 2033
- Figure 4: United States North America Proppants Market Revenue (billion), by Geography 2025 & 2033
- Figure 5: United States North America Proppants Market Revenue Share (%), by Geography 2025 & 2033
- Figure 6: United States North America Proppants Market Revenue (billion), by Country 2025 & 2033
- Figure 7: United States North America Proppants Market Revenue Share (%), by Country 2025 & 2033
- Figure 8: Canada North America Proppants Market Revenue (billion), by Type 2025 & 2033
- Figure 9: Canada North America Proppants Market Revenue Share (%), by Type 2025 & 2033
- Figure 10: Canada North America Proppants Market Revenue (billion), by Geography 2025 & 2033
- Figure 11: Canada North America Proppants Market Revenue Share (%), by Geography 2025 & 2033
- Figure 12: Canada North America Proppants Market Revenue (billion), by Country 2025 & 2033
- Figure 13: Canada North America Proppants Market Revenue Share (%), by Country 2025 & 2033
- Figure 14: Mexico North America Proppants Market Revenue (billion), by Type 2025 & 2033
- Figure 15: Mexico North America Proppants Market Revenue Share (%), by Type 2025 & 2033
- Figure 16: Mexico North America Proppants Market Revenue (billion), by Geography 2025 & 2033
- Figure 17: Mexico North America Proppants Market Revenue Share (%), by Geography 2025 & 2033
- Figure 18: Mexico North America Proppants Market Revenue (billion), by Country 2025 & 2033
- Figure 19: Mexico North America Proppants Market Revenue Share (%), by Country 2025 & 2033
List of Tables
- Table 1: Global North America Proppants Market Revenue billion Forecast, by Type 2020 & 2033
- Table 2: Global North America Proppants Market Revenue billion Forecast, by Geography 2020 & 2033
- Table 3: Global North America Proppants Market Revenue billion Forecast, by Region 2020 & 2033
- Table 4: Global North America Proppants Market Revenue billion Forecast, by Type 2020 & 2033
- Table 5: Global North America Proppants Market Revenue billion Forecast, by Geography 2020 & 2033
- Table 6: Global North America Proppants Market Revenue billion Forecast, by Country 2020 & 2033
- Table 7: Global North America Proppants Market Revenue billion Forecast, by Type 2020 & 2033
- Table 8: Global North America Proppants Market Revenue billion Forecast, by Geography 2020 & 2033
- Table 9: Global North America Proppants Market Revenue billion Forecast, by Country 2020 & 2033
- Table 10: Global North America Proppants Market Revenue billion Forecast, by Type 2020 & 2033
- Table 11: Global North America Proppants Market Revenue billion Forecast, by Geography 2020 & 2033
- Table 12: Global North America Proppants Market Revenue billion Forecast, by Country 2020 & 2033
Frequently Asked Questions
1. What is the projected Compound Annual Growth Rate (CAGR) of the North America Proppants Market?
The projected CAGR is approximately 16.02%.
2. Which companies are prominent players in the North America Proppants Market?
Key companies in the market include Badger Mining Corporation, CoorsTek Inc, Covia Holdings Corporation, Eagle Materials Inc, Fores LTD, Halliburton, Hexion, Hi-Crush, Imerys, Preferred Proppants LLC, Saint-Gobain, Schlumberger Limited, Superior Silica Sands (Emerge Energy Services), US SILICA, WAYFINDER*List Not Exhaustive.
3. What are the main segments of the North America Proppants Market?
The market segments include Type, Geography.
4. Can you provide details about the market size?
The market size is estimated to be USD 6.59 billion as of 2022.
5. What are some drivers contributing to market growth?
Improvements in Fracking Technology; Increasing Usage of Frac Sand (Quantity per Well); Increasing Shale Gas Production Activities.
6. What are the notable trends driving market growth?
Frac Sand to Dominate the Market.
7. Are there any restraints impacting market growth?
Improvements in Fracking Technology; Increasing Usage of Frac Sand (Quantity per Well); Increasing Shale Gas Production Activities.
8. Can you provide examples of recent developments in the market?
In September 2022, Hexion Inc. and Wayfinder Corp partnered to better serve resin-coated proppant users in the Western Canadian Sedimentary Basin. This strategic partnership joined Hexion's leading resin and chemical expertise with Wayfinder's new state-of-the-art manufacturing facility and logistics network.
9. What pricing options are available for accessing the report?
Pricing options include single-user, multi-user, and enterprise licenses priced at USD 4750, USD 5250, and USD 8750 respectively.
10. Is the market size provided in terms of value or volume?
The market size is provided in terms of value, measured in billion.
11. Are there any specific market keywords associated with the report?
Yes, the market keyword associated with the report is "North America Proppants Market," which aids in identifying and referencing the specific market segment covered.
12. How do I determine which pricing option suits my needs best?
The pricing options vary based on user requirements and access needs. Individual users may opt for single-user licenses, while businesses requiring broader access may choose multi-user or enterprise licenses for cost-effective access to the report.
13. Are there any additional resources or data provided in the North America Proppants Market report?
While the report offers comprehensive insights, it's advisable to review the specific contents or supplementary materials provided to ascertain if additional resources or data are available.
14. How can I stay updated on further developments or reports in the North America Proppants Market?
To stay informed about further developments, trends, and reports in the North America Proppants Market, consider subscribing to industry newsletters, following relevant companies and organizations, or regularly checking reputable industry news sources and publications.
Methodology
Step 1 - Identification of Relevant Samples Size from Population Database


Step 2 - Approaches for Defining Global Market Size (Value, Volume* & Price*)

Note*: In applicable scenarios
Step 3 - Data Sources
Primary Research
- Web Analytics
- Survey Reports
- Research Institute
- Latest Research Reports
- Opinion Leaders
Secondary Research
- Annual Reports
- White Paper
- Latest Press Release
- Industry Association
- Paid Database
- Investor Presentations

Step 4 - Data Triangulation
Involves using different sources of information in order to increase the validity of a study
These sources are likely to be stakeholders in a program - participants, other researchers, program staff, other community members, and so on.
Then we put all data in single framework & apply various statistical tools to find out the dynamic on the market.
During the analysis stage, feedback from the stakeholder groups would be compared to determine areas of agreement as well as areas of divergence