

Key Insights
The North America remote sensing satellites market is poised for significant expansion, driven by escalating demand for high-resolution geospatial data across diverse industries. The market is projected to reach $25.37 billion by 2025, with an estimated Compound Annual Growth Rate (CAGR) of 11.59% during the forecast period (2025-2033). Key growth drivers include the increasing adoption of satellite imagery for precision agriculture, environmental monitoring, urban planning, and resource management within the commercial sector. Additionally, robust governmental and defense applications for national security, intelligence, and disaster response continue to fuel market demand. The integration of AI and machine learning for advanced data analysis further enhances the value proposition of satellite-derived insights. Market segmentation indicates a strong preference for Low Earth Orbit (LEO) satellites, owing to their superior resolution and revisit capabilities. Within subsystems, Propulsion Hardware and Satellite Bus & Subsystems are anticipated to witness substantial growth driven by technological advancements promoting miniaturization, efficiency, and cost-effectiveness. Leading companies are innovating through technological advancements and strategic collaborations, with the United States leading market dominance due to its advanced space technology infrastructure and high consumption of remote sensing data.
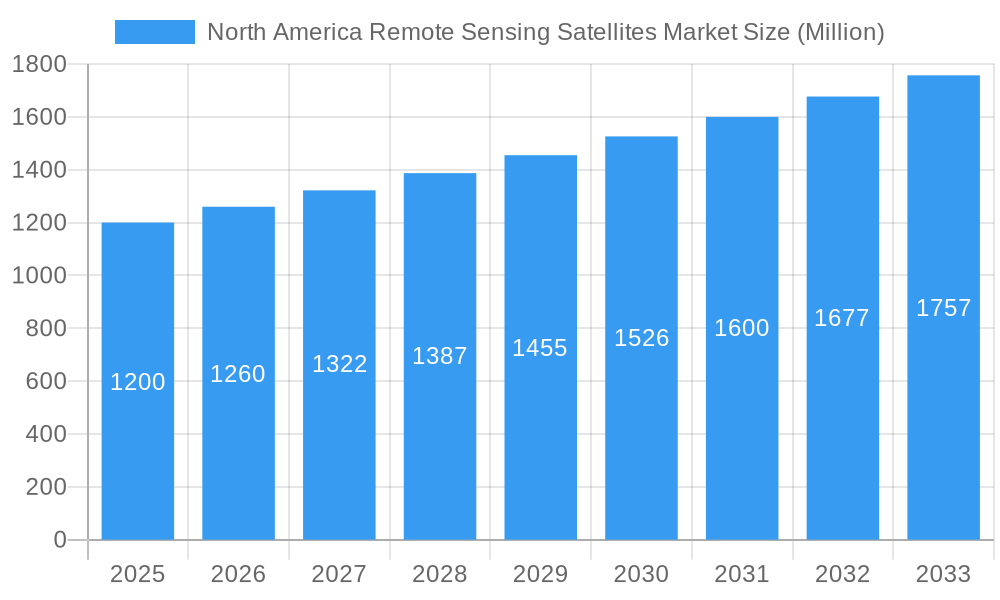
North America Remote Sensing Satellites Market Market Size (In Billion)
The forecast period (2025-2033) anticipates sustained market acceleration, underpinned by the miniaturization of satellites, reduced launch costs, and the proliferation of small satellite constellations. The growing accessibility and affordability of satellite data, coupled with continuous technological improvements, are expected to unlock novel applications and broaden market penetration across various sectors. Despite potential challenges such as regulatory complexities and development/launch costs, the outlook for the North American remote sensing satellites market remains exceptionally positive, promising considerable growth and innovation.
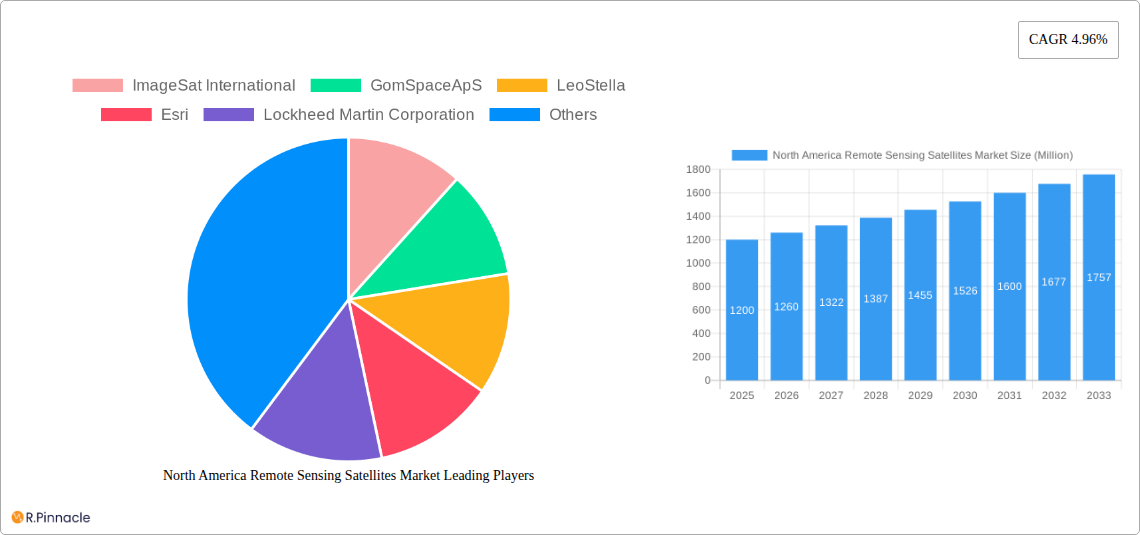
North America Remote Sensing Satellites Market Company Market Share
North America Remote Sensing Satellites Market Report: 2019-2033
This comprehensive report provides an in-depth analysis of the North America Remote Sensing Satellites Market, offering actionable insights for industry professionals and investors. Covering the period 2019-2033, with a base year of 2025 and a forecast period of 2025-2033, this report delivers a detailed understanding of market dynamics, growth drivers, challenges, and opportunities. The market is segmented by end-user (Commercial, Military & Government, Other), satellite mass (Below 10 Kg, 10-100kg, 100-500kg, 500-1000kg, above 1000kg), orbit class (LEO, MEO, GEO), and satellite subsystem (Propulsion Hardware and Propellant, Satellite Bus & Subsystems, Solar Array & Power Hardware, Structures, Harness & Mechanisms). Key players analyzed include ImageSat International, GomSpace ApS, LeoStella, Esri, Lockheed Martin Corporation, Ball Corporation, Maxar Technologies Inc, IHI Corp, Thale, Planet Labs Inc, Northrop Grumman Corporation, Spire Global Inc, and Capella Space Corp.
North America Remote Sensing Satellites Market Structure & Innovation Trends
The North American remote sensing satellites market exhibits a moderately concentrated structure, with a few major players holding significant market share. Market share data for 2024 indicates that Maxar Technologies Inc. and Lockheed Martin Corporation hold approximately xx% and xx% respectively, while other players like Planet Labs Inc. and Spire Global Inc. contribute significantly, but with smaller individual shares. Innovation is driven by advancements in sensor technology, miniaturization, and the increasing demand for high-resolution imagery. Regulatory frameworks, such as those governing data privacy and national security, play a significant role in shaping market dynamics. Product substitutes, such as airborne sensors and aerial photography, exist but generally lack the coverage and data quality offered by satellites. The market also witnesses frequent mergers and acquisitions (M&A) activity, reflecting a consolidating industry landscape. For example, in 2022, the M&A deal value in this sector reached approximately $xx Million, driven largely by consolidation among smaller players and strategic acquisitions by large corporations. End-user demographics are diverse, ranging from government agencies and defense contractors to commercial entities and research institutions.
- Market Concentration: Moderately concentrated with key players holding significant market share.
- Innovation Drivers: Advancements in sensor technology, miniaturization, demand for high-resolution imagery.
- Regulatory Framework: Significant influence on market dynamics, particularly concerning data privacy and national security.
- M&A Activity: High level of consolidation through mergers and acquisitions. Example: 2022 M&A deal value estimated at $xx Million.
North America Remote Sensing Satellites Market Dynamics & Trends
The North American remote sensing satellites market is experiencing robust growth, with a Compound Annual Growth Rate (CAGR) of xx% projected from 2025 to 2033. This growth is fueled by increasing demand for geospatial intelligence across various sectors, including agriculture, urban planning, environmental monitoring, and disaster response. Technological disruptions, such as the development of smaller, more affordable CubeSats and the emergence of advanced analytics capabilities, are reshaping the market landscape. Consumer preferences are shifting towards higher resolution imagery, faster data delivery, and more user-friendly data analytics tools. Competitive dynamics are characterized by intense innovation, strategic partnerships, and increasing consolidation. Market penetration of remote sensing data in various applications continues to grow, with particular strength in the commercial sector, driving significant revenue generation. The increasing adoption of cloud-based platforms for data storage and processing is also fueling market expansion.
Dominant Regions & Segments in North America Remote Sensing Satellites Market
The United States dominates the North American remote sensing satellites market, driven by robust government investment in defense and intelligence gathering, along with a vibrant commercial sector. Within the end-user segment, the military and government sector holds the largest market share, owing to its substantial demand for high-resolution imagery for national security applications. The LEO orbit class dominates the market due to its suitability for various Earth observation applications. In terms of satellite mass, the 100-500kg segment is particularly prevalent because it balances the need for advanced capabilities with launch costs. In terms of satellite subsystems, the Satellite Bus & Subsystems segment holds the largest market share.
- Key Drivers in the US Market:
- High government spending on defense and intelligence.
- Strong commercial sector demand.
- Well-developed infrastructure for satellite launch and operations.
- Dominant End-User Segment: Military & Government.
- Dominant Orbit Class: LEO.
- Dominant Satellite Mass Segment: 100-500kg.
- Dominant Satellite Subsystem: Satellite Bus & Subsystems
North America Remote Sensing Satellites Market Product Innovations
Recent product innovations focus on enhanced resolution, improved data processing capabilities, and the development of specialized sensors for specific applications. Miniaturization and CubeSat technologies are driving down launch costs and increasing accessibility. The market is witnessing a significant rise in the adoption of Synthetic Aperture Radar (SAR) technology, providing all-weather imaging capabilities. These developments are increasing market reach, appealing to diverse industries and expanding market potential.
Report Scope & Segmentation Analysis
This report comprehensively analyzes the North American remote sensing satellites market, segmented by end-user (Commercial, Military & Government, Other), satellite mass (Below 10 Kg, 10-100kg, 100-500kg, 500-1000kg, above 1000kg), orbit class (LEO, MEO, GEO), and satellite subsystem (Propulsion Hardware and Propellant, Satellite Bus & Subsystems, Solar Array & Power Hardware, Structures, Harness & Mechanisms). Each segment is analyzed individually, with growth projections, market sizes, and competitive dynamics detailed in the complete report. Market size estimations are provided for each segment across the historical, base, and forecast years. Competitive dynamics are analyzed based on market share, product portfolios, and strategic initiatives of major companies.
Key Drivers of North America Remote Sensing Satellites Market Growth
Growth in this market is primarily driven by the increasing need for high-resolution Earth observation data across various sectors. Technological advancements, such as improved sensor technology and miniaturization, have significantly lowered costs. Government initiatives, including investment in space exploration and national security, also contribute to market growth. The rising adoption of cloud-based data processing and analytics platforms further fuels this expansion.
Challenges in the North America Remote Sensing Satellites Market Sector
Key challenges include the high cost of satellite development and launch, complex regulatory environments, and competition from alternative technologies. Supply chain disruptions can affect production timelines and costs. Furthermore, ensuring data security and privacy remains a crucial concern for the industry. These hurdles create significant barriers to entry and necessitate a well-defined strategy for success.
Emerging Opportunities in North America Remote Sensing Satellites Market
Emerging opportunities lie in the development of smaller, more affordable satellites, the expansion of data analytics capabilities, and the exploration of new applications in areas such as precision agriculture, environmental monitoring, and urban planning. The increasing integration of AI and machine learning in data processing creates significant potential for new insights and value creation. Furthermore, the growing demand for real-time data analytics opens doors for new market entrants and product innovations.
Leading Players in the North America Remote Sensing Satellites Market Market
- ImageSat International
- GomSpace ApS
- LeoStella
- Esri
- Lockheed Martin Corporation
- Ball Corporation
- Maxar Technologies Inc
- IHI Corp
- Thale
- Planet Labs Inc
- Northrop Grumman Corporation
- Spire Global Inc
- Capella Space Corp
Key Developments in North America Remote Sensing Satellites Market Industry
- April 2023: NASA awarded a sole-source BPA to Capella Space Corporation for high-resolution SAR data products (0.5m to 1.2m). This demonstrates growing demand for commercial SAR data and Capella Space's leading position in the market.
- March 2023: Rocket Lab launched Capella Space's pair of commercial radar imaging satellites, expanding their capacity for all-weather monitoring. This increases the market's capacity for cloud-penetrating imagery.
- February 2023: NASA and Esri partnered to grant wider access to NASA's geospatial content, stimulating research and accelerating innovation within the geospatial data ecosystem. This facilitates data accessibility for researchers and further application development.
Future Outlook for North America Remote Sensing Satellites Market Market
The future outlook for the North American remote sensing satellites market is positive, driven by continued technological advancements, increasing demand for geospatial data across diverse sectors, and supportive government policies. Strategic partnerships and the integration of emerging technologies like AI and machine learning promise significant growth opportunities. The market is expected to experience considerable expansion, particularly in areas like SAR technology, small satellite constellations, and data analytics services.
North America Remote Sensing Satellites Market Segmentation
-
1. Satellite Mass
- 1.1. 10-100kg
- 1.2. 100-500kg
- 1.3. 500-1000kg
- 1.4. Below 10 Kg
- 1.5. above 1000kg
-
2. Orbit Class
- 2.1. GEO
- 2.2. LEO
- 2.3. MEO
-
3. Satellite Subsystem
- 3.1. Propulsion Hardware and Propellant
- 3.2. Satellite Bus & Subsystems
- 3.3. Solar Array & Power Hardware
- 3.4. Structures, Harness & Mechanisms
-
4. End User
- 4.1. Commercial
- 4.2. Military & Government
- 4.3. Other
North America Remote Sensing Satellites Market Segmentation By Geography
-
1. North America
- 1.1. United States
- 1.2. Canada
- 1.3. Mexico
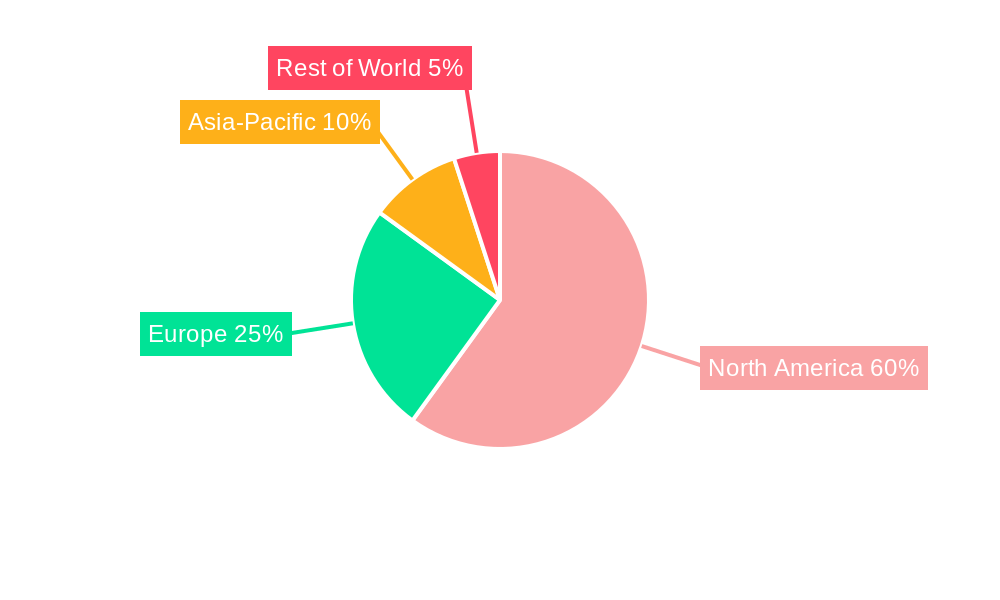
North America Remote Sensing Satellites Market Regional Market Share
Geographic Coverage of North America Remote Sensing Satellites Market
North America Remote Sensing Satellites Market REPORT HIGHLIGHTS
| Aspects | Details |
|---|---|
| Study Period | 2020-2034 |
| Base Year | 2025 |
| Estimated Year | 2026 |
| Forecast Period | 2026-2034 |
| Historical Period | 2020-2025 |
| Growth Rate | CAGR of 11.59% from 2020-2034 |
| Segmentation |
|
Table of Contents
- 1. Introduction
- 1.1. Research Scope
- 1.2. Market Segmentation
- 1.3. Research Objective
- 1.4. Definitions and Assumptions
- 2. Executive Summary
- 2.1. Market Snapshot
- 3. Market Dynamics
- 3.1. Market Drivers
- 3.2. Market Restrains
- 3.3. Market Trends
- 3.4. Market Opportunities
- 4. Market Factor Analysis
- 4.1. Porters Five Forces
- 4.1.1. Bargaining Power of Suppliers
- 4.1.2. Bargaining Power of Buyers
- 4.1.3. Threat of New Entrants
- 4.1.4. Threat of Substitutes
- 4.1.5. Competitive Rivalry
- 4.2. PESTEL analysis
- 4.3. BCG Analysis
- 4.3.1. Stars (High Growth, High Market Share)
- 4.3.2. Cash Cows (Low Growth, High Market Share)
- 4.3.3. Question Mark (High Growth, Low Market Share)
- 4.3.4. Dogs (Low Growth, Low Market Share)
- 4.4. Ansoff Matrix Analysis
- 4.5. Supply Chain Analysis
- 4.6. Regulatory Landscape
- 4.7. Current Market Potential and Opportunity Assessment (TAM–SAM–SOM Framework)
- 4.8. PRI Analyst Note
- 4.1. Porters Five Forces
- 5. Market Analysis, Insights and Forecast 2021-2033
- 5.1. Market Analysis, Insights and Forecast - by Satellite Mass
- 5.1.1. 10-100kg
- 5.1.2. 100-500kg
- 5.1.3. 500-1000kg
- 5.1.4. Below 10 Kg
- 5.1.5. above 1000kg
- 5.2. Market Analysis, Insights and Forecast - by Orbit Class
- 5.2.1. GEO
- 5.2.2. LEO
- 5.2.3. MEO
- 5.3. Market Analysis, Insights and Forecast - by Satellite Subsystem
- 5.3.1. Propulsion Hardware and Propellant
- 5.3.2. Satellite Bus & Subsystems
- 5.3.3. Solar Array & Power Hardware
- 5.3.4. Structures, Harness & Mechanisms
- 5.4. Market Analysis, Insights and Forecast - by End User
- 5.4.1. Commercial
- 5.4.2. Military & Government
- 5.4.3. Other
- 5.5. Market Analysis, Insights and Forecast - by Region
- 5.5.1. North America
- 5.1. Market Analysis, Insights and Forecast - by Satellite Mass
- 6. North America Remote Sensing Satellites Market Analysis, Insights and Forecast, 2021-2033
- 6.1. Market Analysis, Insights and Forecast - by Satellite Mass
- 6.1.1. 10-100kg
- 6.1.2. 100-500kg
- 6.1.3. 500-1000kg
- 6.1.4. Below 10 Kg
- 6.1.5. above 1000kg
- 6.2. Market Analysis, Insights and Forecast - by Orbit Class
- 6.2.1. GEO
- 6.2.2. LEO
- 6.2.3. MEO
- 6.3. Market Analysis, Insights and Forecast - by Satellite Subsystem
- 6.3.1. Propulsion Hardware and Propellant
- 6.3.2. Satellite Bus & Subsystems
- 6.3.3. Solar Array & Power Hardware
- 6.3.4. Structures, Harness & Mechanisms
- 6.4. Market Analysis, Insights and Forecast - by End User
- 6.4.1. Commercial
- 6.4.2. Military & Government
- 6.4.3. Other
- 6.1. Market Analysis, Insights and Forecast - by Satellite Mass
- 7. Competitive Analysis
- 7.1. Company Profiles
- 7.1.1 ImageSat International
- 7.1.1.1. Company Overview
- 7.1.1.2. Products
- 7.1.1.3. Company Financials
- 7.1.1.4. SWOT Analysis
- 7.1.2 GomSpaceApS
- 7.1.2.1. Company Overview
- 7.1.2.2. Products
- 7.1.2.3. Company Financials
- 7.1.2.4. SWOT Analysis
- 7.1.3 LeoStella
- 7.1.3.1. Company Overview
- 7.1.3.2. Products
- 7.1.3.3. Company Financials
- 7.1.3.4. SWOT Analysis
- 7.1.4 Esri
- 7.1.4.1. Company Overview
- 7.1.4.2. Products
- 7.1.4.3. Company Financials
- 7.1.4.4. SWOT Analysis
- 7.1.5 Lockheed Martin Corporation
- 7.1.5.1. Company Overview
- 7.1.5.2. Products
- 7.1.5.3. Company Financials
- 7.1.5.4. SWOT Analysis
- 7.1.6 Ball Corporation
- 7.1.6.1. Company Overview
- 7.1.6.2. Products
- 7.1.6.3. Company Financials
- 7.1.6.4. SWOT Analysis
- 7.1.7 Maxar Technologies Inc
- 7.1.7.1. Company Overview
- 7.1.7.2. Products
- 7.1.7.3. Company Financials
- 7.1.7.4. SWOT Analysis
- 7.1.8 IHI Corp
- 7.1.8.1. Company Overview
- 7.1.8.2. Products
- 7.1.8.3. Company Financials
- 7.1.8.4. SWOT Analysis
- 7.1.9 Thale
- 7.1.9.1. Company Overview
- 7.1.9.2. Products
- 7.1.9.3. Company Financials
- 7.1.9.4. SWOT Analysis
- 7.1.10 Planet Labs Inc
- 7.1.10.1. Company Overview
- 7.1.10.2. Products
- 7.1.10.3. Company Financials
- 7.1.10.4. SWOT Analysis
- 7.1.11 Northrop Grumman Corporation
- 7.1.11.1. Company Overview
- 7.1.11.2. Products
- 7.1.11.3. Company Financials
- 7.1.11.4. SWOT Analysis
- 7.1.12 Spire Global Inc
- 7.1.12.1. Company Overview
- 7.1.12.2. Products
- 7.1.12.3. Company Financials
- 7.1.12.4. SWOT Analysis
- 7.1.13 Capella Space Corp
- 7.1.13.1. Company Overview
- 7.1.13.2. Products
- 7.1.13.3. Company Financials
- 7.1.13.4. SWOT Analysis
- 7.1.1 ImageSat International
- 7.2. Market Entropy
- 7.2.1 Company's Key Areas Served
- 7.2.2 Recent Developments
- 7.3. Company Market Share Analysis 2025
- 7.3.1 Top 5 Companies Market Share Analysis
- 7.3.2 Top 3 Companies Market Share Analysis
- 7.4. List of Potential Customers
- 8. Research Methodology
List of Figures
- Figure 1: North America Remote Sensing Satellites Market Revenue Breakdown (billion, %) by Product 2025 & 2033
- Figure 2: North America Remote Sensing Satellites Market Share (%) by Company 2025
List of Tables
- Table 1: North America Remote Sensing Satellites Market Revenue billion Forecast, by Satellite Mass 2020 & 2033
- Table 2: North America Remote Sensing Satellites Market Revenue billion Forecast, by Orbit Class 2020 & 2033
- Table 3: North America Remote Sensing Satellites Market Revenue billion Forecast, by Satellite Subsystem 2020 & 2033
- Table 4: North America Remote Sensing Satellites Market Revenue billion Forecast, by End User 2020 & 2033
- Table 5: North America Remote Sensing Satellites Market Revenue billion Forecast, by Region 2020 & 2033
- Table 6: North America Remote Sensing Satellites Market Revenue billion Forecast, by Satellite Mass 2020 & 2033
- Table 7: North America Remote Sensing Satellites Market Revenue billion Forecast, by Orbit Class 2020 & 2033
- Table 8: North America Remote Sensing Satellites Market Revenue billion Forecast, by Satellite Subsystem 2020 & 2033
- Table 9: North America Remote Sensing Satellites Market Revenue billion Forecast, by End User 2020 & 2033
- Table 10: North America Remote Sensing Satellites Market Revenue billion Forecast, by Country 2020 & 2033
- Table 11: United States North America Remote Sensing Satellites Market Revenue (billion) Forecast, by Application 2020 & 2033
- Table 12: Canada North America Remote Sensing Satellites Market Revenue (billion) Forecast, by Application 2020 & 2033
- Table 13: Mexico North America Remote Sensing Satellites Market Revenue (billion) Forecast, by Application 2020 & 2033
Frequently Asked Questions
1. What is the projected Compound Annual Growth Rate (CAGR) of the North America Remote Sensing Satellites Market?
The projected CAGR is approximately 11.59%.
2. Which companies are prominent players in the North America Remote Sensing Satellites Market?
Key companies in the market include ImageSat International, GomSpaceApS, LeoStella, Esri, Lockheed Martin Corporation, Ball Corporation, Maxar Technologies Inc, IHI Corp, Thale, Planet Labs Inc, Northrop Grumman Corporation, Spire Global Inc, Capella Space Corp.
3. What are the main segments of the North America Remote Sensing Satellites Market?
The market segments include Satellite Mass, Orbit Class, Satellite Subsystem, End User.
4. Can you provide details about the market size?
The market size is estimated to be USD 25.37 billion as of 2022.
5. What are some drivers contributing to market growth?
N/A
6. What are the notable trends driving market growth?
OTHER KEY INDUSTRY TRENDS COVERED IN THE REPORT.
7. Are there any restraints impacting market growth?
N/A
8. Can you provide examples of recent developments in the market?
April 2023: NASA has awarded a sole source Blanket Purchase Agreement (BPA) to Capella Space Corporation of San Francisco to provide high-resolution Synthetic Aperture Radar (SAR) (0.5 meter to 1.2 meters) commercial Earth observation data products.March 2023: Rocket Lab's Electron rocket launched CapellaSpace's pair of commercial radar imaging satellites into orbit that are capable of seeing through clouds, in daylight or darkness, to monitor the planet below.February 2023: NASA and geographic information service provider Esri will grant wider access to the space agency's geospatial content for research and exploration purposes through the Space Act Agreement.
9. What pricing options are available for accessing the report?
Pricing options include single-user, multi-user, and enterprise licenses priced at USD 3800, USD 4500, and USD 5800 respectively.
10. Is the market size provided in terms of value or volume?
The market size is provided in terms of value, measured in billion.
11. Are there any specific market keywords associated with the report?
Yes, the market keyword associated with the report is "North America Remote Sensing Satellites Market," which aids in identifying and referencing the specific market segment covered.
12. How do I determine which pricing option suits my needs best?
The pricing options vary based on user requirements and access needs. Individual users may opt for single-user licenses, while businesses requiring broader access may choose multi-user or enterprise licenses for cost-effective access to the report.
13. Are there any additional resources or data provided in the North America Remote Sensing Satellites Market report?
While the report offers comprehensive insights, it's advisable to review the specific contents or supplementary materials provided to ascertain if additional resources or data are available.
14. How can I stay updated on further developments or reports in the North America Remote Sensing Satellites Market?
To stay informed about further developments, trends, and reports in the North America Remote Sensing Satellites Market, consider subscribing to industry newsletters, following relevant companies and organizations, or regularly checking reputable industry news sources and publications.
Methodology
Step 1 - Identification of Relevant Samples Size from Population Database


Step 2 - Approaches for Defining Global Market Size (Value, Volume* & Price*)

Note*: In applicable scenarios
Step 3 - Data Sources
Primary Research
- Web Analytics
- Survey Reports
- Research Institute
- Latest Research Reports
- Opinion Leaders
Secondary Research
- Annual Reports
- White Paper
- Latest Press Release
- Industry Association
- Paid Database
- Investor Presentations

Step 4 - Data Triangulation
Involves using different sources of information in order to increase the validity of a study
These sources are likely to be stakeholders in a program - participants, other researchers, program staff, other community members, and so on.
Then we put all data in single framework & apply various statistical tools to find out the dynamic on the market.
During the analysis stage, feedback from the stakeholder groups would be compared to determine areas of agreement as well as areas of divergence