

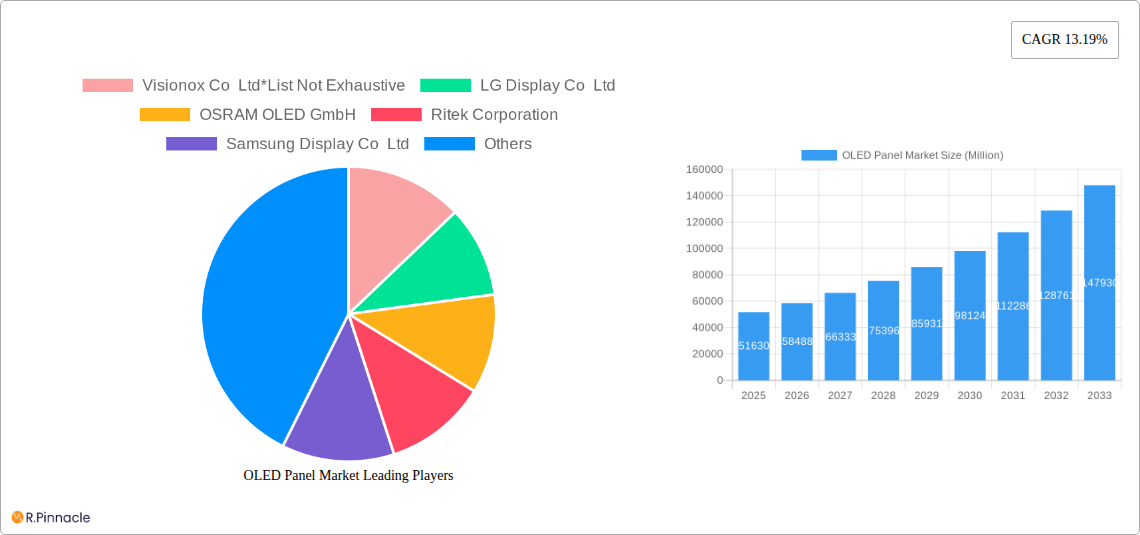
Key Insights
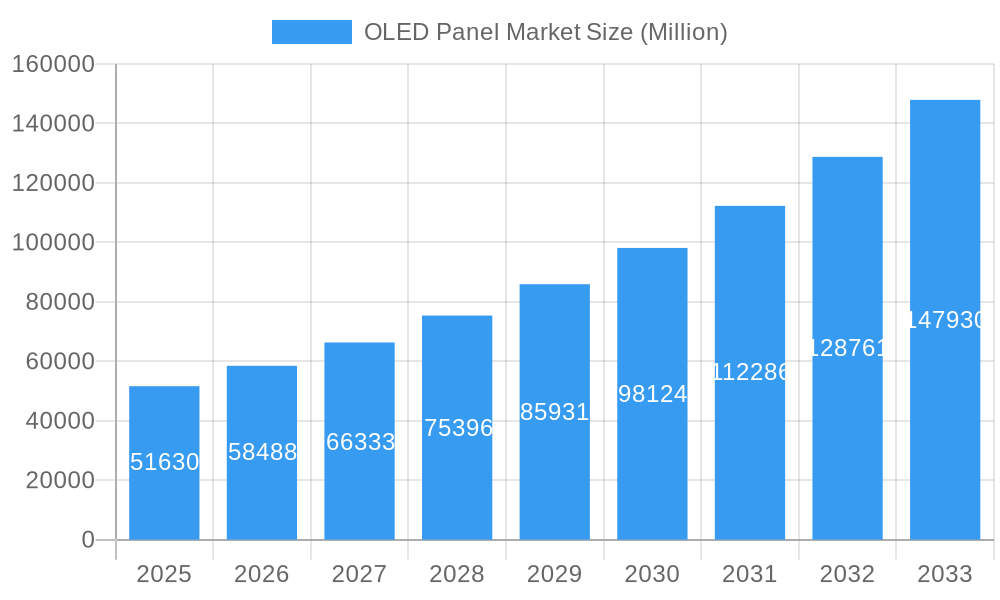
The OLED panel market is experiencing robust growth, projected to reach $51.63 billion in 2025 and maintain a Compound Annual Growth Rate (CAGR) of 13.19% from 2025 to 2033. This expansion is fueled by several key drivers. The increasing demand for high-resolution, energy-efficient displays in mobile devices, televisions, and automotive applications is a significant catalyst. Furthermore, advancements in flexible OLED technology are opening up new possibilities in wearable devices and innovative product designs. The rising adoption of OLED panels in premium consumer electronics, along with the continuous miniaturization of electronics, are also contributing factors. Competition among major players like Samsung Display, LG Display, and Visionox is driving innovation and price reductions, making OLED technology more accessible to a wider consumer base. Segment-wise, the large-sized OLED panel segment is expected to dominate due to its prevalence in televisions and automotive displays, while the flexible OLED segment is poised for substantial growth owing to its increasing applications in foldable smartphones and other flexible devices.
OLED Panel Market Market Size (In Billion)
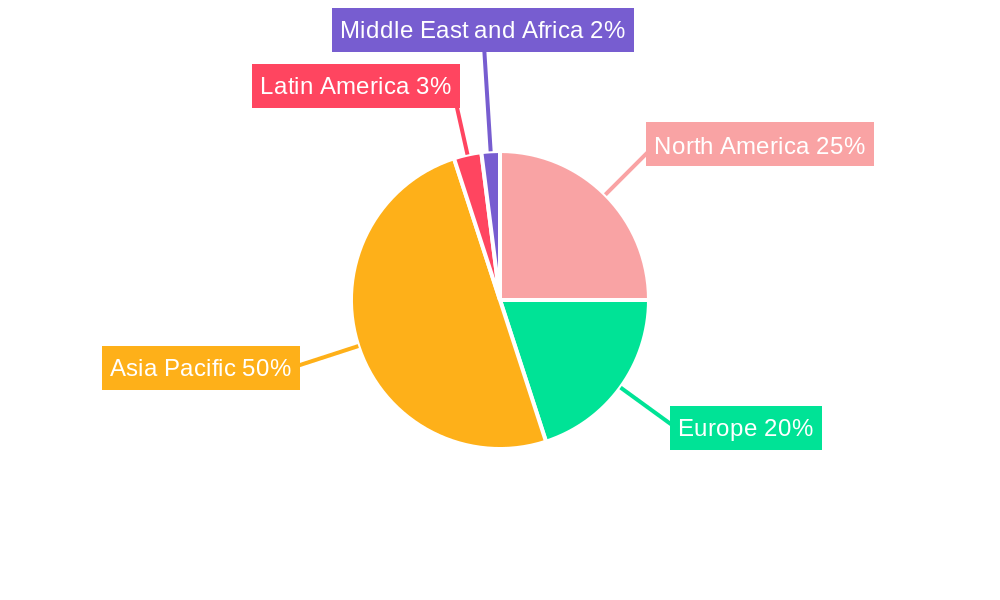
However, challenges persist. The high manufacturing costs associated with OLED panels remain a significant restraint, particularly for smaller-sized panels. Additionally, the emergence of competing display technologies, such as MicroLED and advanced LCDs, presents ongoing competition. Despite these constraints, the continued technological advancements and increasing consumer preference for superior visual quality are expected to propel the OLED panel market to significant heights in the coming years. The Asia-Pacific region, particularly China and South Korea, are key manufacturing and consumption hubs, driving a large portion of the market growth. North America and Europe also contribute significantly, driven by high consumer demand for premium electronics. The market segmentation by product type (mobile, TV, automotive etc.) reflects the diverse applications and the potential for growth across various sectors. The forecast period of 2025-2033 promises continued expansion, based on the current trajectory and projected technological advancements.
OLED Panel Market Company Market Share
OLED Panel Market Report: A Comprehensive Analysis (2019-2033)
This in-depth report provides a comprehensive analysis of the OLED Panel market, offering actionable insights for industry professionals and stakeholders. With a study period spanning 2019-2033, a base year of 2025, and a forecast period of 2025-2033, this report leverages historical data (2019-2024) to predict future market trends and growth opportunities. The market is segmented by size (small, medium, large), product (mobile & tablet, television, automotive, wearable, other), type (flexible, rigid, transparent), and display address scheme (PMOLED, AMOLED). The report values are expressed in Millions.
OLED Panel Market Market Structure & Innovation Trends
The OLED panel market exhibits a moderately concentrated structure, with key players like LG Display, Samsung Display, and Visionox holding significant market share. However, the presence of numerous smaller players fosters competition and innovation. Market share data for 2024 reveals LG Display at approximately xx%, Samsung Display at xx%, and Visionox at xx%. Mergers and acquisitions (M&A) activity has been moderate, with deal values totaling approximately $xx Million in 2024. Innovation is driven by advancements in materials science, leading to improved brightness, efficiency, and flexibility. Regulatory frameworks, particularly those related to environmental standards and material sourcing, influence manufacturing practices. Product substitutes, such as QLED and MicroLED, pose competitive challenges. End-user demographics are shifting towards preference for larger displays and flexible screens across various applications.
- Market Concentration: Moderately concentrated, with a few dominant players.
- Innovation Drivers: Advancements in materials science, improved energy efficiency.
- Regulatory Frameworks: Environmental standards, material sourcing regulations.
- Product Substitutes: QLED, MicroLED technologies.
- End-User Demographics: Increasing demand for larger, flexible displays.
- M&A Activity: Moderate activity, with total deal values of approximately $xx Million in 2024.
OLED Panel Market Market Dynamics & Trends
The OLED panel market is experiencing robust growth, driven by increasing demand for high-resolution displays in consumer electronics and automotive applications. The Compound Annual Growth Rate (CAGR) from 2025 to 2033 is projected to be xx%, reflecting the market's strong expansion trajectory. Technological advancements, such as the development of foldable and rollable displays, are fueling market disruption and driving consumer preference. Intense competition among key players leads to continuous innovation and price optimization. Market penetration is highest in the television segment, with significant growth potential in automotive and wearable applications.
Dominant Regions & Segments in OLED Panel Market
Asia, particularly South Korea, China, and Japan, dominates the OLED panel market due to robust manufacturing capabilities, technological advancements, and significant domestic demand. Within segments:
- By Size: Large-sized OLED panels are the leading segment, propelled by the growing demand for large-screen televisions.
- By Product: Televisions constitute the largest segment, followed by mobile and tablet displays. Automotive and wearable applications showcase significant growth potential.
- By Type: Flexible OLED panels are experiencing rapid growth, driven by the increasing popularity of foldable smartphones and other flexible devices.
- By Display Address Scheme: AMOLED displays currently hold the largest market share, given their superior performance.
Key Drivers by Region:
- Asia: Strong manufacturing base, technological advancements, high domestic demand, supportive government policies.
- North America: High disposable income, demand for high-quality displays.
- Europe: Growing adoption of advanced display technologies, supportive regulations.
OLED Panel Market Product Innovations
Recent product innovations include the introduction of brighter, more energy-efficient OLED panels with wider viewing angles. META Technology by LG Display and Quantum Dot OLED panels by Samsung Display represent significant advancements. These innovations focus on enhancing image quality, durability, and flexibility, addressing crucial consumer needs. The market is witnessing a trend toward larger, more flexible, and higher resolution displays tailored to diverse applications.
Report Scope & Segmentation Analysis
This report provides a detailed segmentation analysis of the OLED panel market across various parameters:
- By Size: Small, medium, and large-sized panels, with growth projections and market size estimates for each segment.
- By Product: Mobile & tablet, television, automotive, wearable, and other products, including competitive dynamics and market share details for each sector.
- By Type: Flexible, rigid, and transparent OLED panels, covering their individual growth trajectories and market landscape.
- By Display Address Scheme: PMOLED and AMOLED, analyzing their individual market presence and future trends.
Each segment's analysis includes detailed information on market size, growth projections, and competitive landscape.
Key Drivers of OLED Panel Market Growth
The OLED panel market's growth is propelled by technological advancements, such as improved brightness and energy efficiency, driving demand in various sectors. Economic factors like increasing disposable incomes in developing economies further fuel market growth. Favorable regulatory frameworks that promote technological advancements are also contributing factors.
Challenges in the OLED Panel Market Sector
Challenges include the high cost of manufacturing OLED panels, particularly flexible ones, affecting pricing and market accessibility. Supply chain disruptions can cause production delays, impacting market supply. Intense competition among established players adds pressure to innovate and maintain competitiveness.
Emerging Opportunities in OLED Panel Market
Emerging opportunities lie in the growing demand for foldable displays in smartphones and other devices, expanding applications in the automotive sector for instrument panels and infotainment systems, and the exploration of new applications in healthcare and other emerging sectors, leveraging the unique features of OLED technology.
Leading Players in the OLED Panel Market Market
- Visionox Co Ltd
- LG Display Co Ltd
- OSRAM OLED GmbH
- Ritek Corporation
- Samsung Display Co Ltd
- Raystar Optronics Inc
- Winstar Display Co Ltd
- Pioneer Corporation
- WiseChip Semiconductor Inc
- Sony Corporation
Key Developments in OLED Panel Market Industry
- January 2023: LG Display unveiled its third-generation OLED TV panel with META Technology, offering 60% brighter images and 30% wider viewing angles.
- January 2023: Samsung Display announced production of a 77-inch Quantum Dot OLED panel for Samsung Electronics, Sony, and other potential clients.
- June 2022: LG Electronics launched the CineBeam Projector and UltraFine Display OLED in India, highlighting advancements in projector and professional monitor technologies.
Future Outlook for OLED Panel Market Market
The OLED panel market is poised for continued growth, driven by technological advancements, increasing demand from various sectors, and expansion into new applications. Strategic partnerships and collaborations among key players will further accelerate innovation and market penetration. The market's future is bright, with significant potential for expansion in both established and emerging markets.
OLED Panel Market Segmentation
-
1. Type
- 1.1. Flexible
- 1.2. Rigid
- 1.3. Transparent
-
2. Display Address Scheme
- 2.1. PMOLED Display
- 2.2. AMOLED Display
-
3. Size
- 3.1. Small-sized OLED Panel
- 3.2. Medium-sized OLED Panel
- 3.3. Large-sized OLED Panel
-
4. Product
- 4.1. Mobile and Tablet
- 4.2. Television
- 4.3. Automotive
- 4.4. Wearable
- 4.5. Other Pr
OLED Panel Market Segmentation By Geography
-
1. North America
- 1.1. United States
- 1.2. Canada
-
2. Europe
- 2.1. United Kingdom
- 2.2. Germany
- 2.3. Italy
- 2.4. France
-
3. Asia
- 3.1. China
- 3.2. India
- 3.3. Japan
- 3.4. South Korea
- 4. Australia and New Zealand
-
5. Latin America
- 5.1. Brazil
- 5.2. Mexico
- 6. Middle East and Africa
OLED Panel Market Regional Market Share
Geographic Coverage of OLED Panel Market
OLED Panel Market REPORT HIGHLIGHTS
| Aspects | Details |
|---|---|
| Study Period | 2020-2034 |
| Base Year | 2025 |
| Estimated Year | 2026 |
| Forecast Period | 2026-2034 |
| Historical Period | 2020-2025 |
| Growth Rate | CAGR of 13.19% from 2020-2034 |
| Segmentation |
|
Table of Contents
- 1. Introduction
- 1.1. Research Scope
- 1.2. Market Segmentation
- 1.3. Research Objective
- 1.4. Definitions and Assumptions
- 2. Executive Summary
- 2.1. Market Snapshot
- 3. Market Dynamics
- 3.1. Market Drivers
- 3.2. Market Restrains
- 3.3. Market Trends
- 3.4. Market Opportunities
- 4. Market Factor Analysis
- 4.1. Porters Five Forces
- 4.1.1. Bargaining Power of Suppliers
- 4.1.2. Bargaining Power of Buyers
- 4.1.3. Threat of New Entrants
- 4.1.4. Threat of Substitutes
- 4.1.5. Competitive Rivalry
- 4.2. PESTEL analysis
- 4.3. BCG Analysis
- 4.3.1. Stars (High Growth, High Market Share)
- 4.3.2. Cash Cows (Low Growth, High Market Share)
- 4.3.3. Question Mark (High Growth, Low Market Share)
- 4.3.4. Dogs (Low Growth, Low Market Share)
- 4.4. Ansoff Matrix Analysis
- 4.5. Supply Chain Analysis
- 4.6. Regulatory Landscape
- 4.7. Current Market Potential and Opportunity Assessment (TAM–SAM–SOM Framework)
- 4.8. PRI Analyst Note
- 4.1. Porters Five Forces
- 5. Market Analysis, Insights and Forecast 2021-2033
- 5.1. Market Analysis, Insights and Forecast - by Type
- 5.1.1. Flexible
- 5.1.2. Rigid
- 5.1.3. Transparent
- 5.2. Market Analysis, Insights and Forecast - by Display Address Scheme
- 5.2.1. PMOLED Display
- 5.2.2. AMOLED Display
- 5.3. Market Analysis, Insights and Forecast - by Size
- 5.3.1. Small-sized OLED Panel
- 5.3.2. Medium-sized OLED Panel
- 5.3.3. Large-sized OLED Panel
- 5.4. Market Analysis, Insights and Forecast - by Product
- 5.4.1. Mobile and Tablet
- 5.4.2. Television
- 5.4.3. Automotive
- 5.4.4. Wearable
- 5.4.5. Other Pr
- 5.5. Market Analysis, Insights and Forecast - by Region
- 5.5.1. North America
- 5.5.2. Europe
- 5.5.3. Asia
- 5.5.4. Australia and New Zealand
- 5.5.5. Latin America
- 5.5.6. Middle East and Africa
- 5.1. Market Analysis, Insights and Forecast - by Type
- 6. Global OLED Panel Market Analysis, Insights and Forecast, 2021-2033
- 6.1. Market Analysis, Insights and Forecast - by Type
- 6.1.1. Flexible
- 6.1.2. Rigid
- 6.1.3. Transparent
- 6.2. Market Analysis, Insights and Forecast - by Display Address Scheme
- 6.2.1. PMOLED Display
- 6.2.2. AMOLED Display
- 6.3. Market Analysis, Insights and Forecast - by Size
- 6.3.1. Small-sized OLED Panel
- 6.3.2. Medium-sized OLED Panel
- 6.3.3. Large-sized OLED Panel
- 6.4. Market Analysis, Insights and Forecast - by Product
- 6.4.1. Mobile and Tablet
- 6.4.2. Television
- 6.4.3. Automotive
- 6.4.4. Wearable
- 6.4.5. Other Pr
- 6.1. Market Analysis, Insights and Forecast - by Type
- 7. North America OLED Panel Market Analysis, Insights and Forecast, 2020-2032
- 7.1. Market Analysis, Insights and Forecast - by Type
- 7.1.1. Flexible
- 7.1.2. Rigid
- 7.1.3. Transparent
- 7.2. Market Analysis, Insights and Forecast - by Display Address Scheme
- 7.2.1. PMOLED Display
- 7.2.2. AMOLED Display
- 7.3. Market Analysis, Insights and Forecast - by Size
- 7.3.1. Small-sized OLED Panel
- 7.3.2. Medium-sized OLED Panel
- 7.3.3. Large-sized OLED Panel
- 7.4. Market Analysis, Insights and Forecast - by Product
- 7.4.1. Mobile and Tablet
- 7.4.2. Television
- 7.4.3. Automotive
- 7.4.4. Wearable
- 7.4.5. Other Pr
- 7.1. Market Analysis, Insights and Forecast - by Type
- 8. Europe OLED Panel Market Analysis, Insights and Forecast, 2020-2032
- 8.1. Market Analysis, Insights and Forecast - by Type
- 8.1.1. Flexible
- 8.1.2. Rigid
- 8.1.3. Transparent
- 8.2. Market Analysis, Insights and Forecast - by Display Address Scheme
- 8.2.1. PMOLED Display
- 8.2.2. AMOLED Display
- 8.3. Market Analysis, Insights and Forecast - by Size
- 8.3.1. Small-sized OLED Panel
- 8.3.2. Medium-sized OLED Panel
- 8.3.3. Large-sized OLED Panel
- 8.4. Market Analysis, Insights and Forecast - by Product
- 8.4.1. Mobile and Tablet
- 8.4.2. Television
- 8.4.3. Automotive
- 8.4.4. Wearable
- 8.4.5. Other Pr
- 8.1. Market Analysis, Insights and Forecast - by Type
- 9. Asia OLED Panel Market Analysis, Insights and Forecast, 2020-2032
- 9.1. Market Analysis, Insights and Forecast - by Type
- 9.1.1. Flexible
- 9.1.2. Rigid
- 9.1.3. Transparent
- 9.2. Market Analysis, Insights and Forecast - by Display Address Scheme
- 9.2.1. PMOLED Display
- 9.2.2. AMOLED Display
- 9.3. Market Analysis, Insights and Forecast - by Size
- 9.3.1. Small-sized OLED Panel
- 9.3.2. Medium-sized OLED Panel
- 9.3.3. Large-sized OLED Panel
- 9.4. Market Analysis, Insights and Forecast - by Product
- 9.4.1. Mobile and Tablet
- 9.4.2. Television
- 9.4.3. Automotive
- 9.4.4. Wearable
- 9.4.5. Other Pr
- 9.1. Market Analysis, Insights and Forecast - by Type
- 10. Australia and New Zealand OLED Panel Market Analysis, Insights and Forecast, 2020-2032
- 10.1. Market Analysis, Insights and Forecast - by Type
- 10.1.1. Flexible
- 10.1.2. Rigid
- 10.1.3. Transparent
- 10.2. Market Analysis, Insights and Forecast - by Display Address Scheme
- 10.2.1. PMOLED Display
- 10.2.2. AMOLED Display
- 10.3. Market Analysis, Insights and Forecast - by Size
- 10.3.1. Small-sized OLED Panel
- 10.3.2. Medium-sized OLED Panel
- 10.3.3. Large-sized OLED Panel
- 10.4. Market Analysis, Insights and Forecast - by Product
- 10.4.1. Mobile and Tablet
- 10.4.2. Television
- 10.4.3. Automotive
- 10.4.4. Wearable
- 10.4.5. Other Pr
- 10.1. Market Analysis, Insights and Forecast - by Type
- 11. Latin America OLED Panel Market Analysis, Insights and Forecast, 2020-2032
- 11.1. Market Analysis, Insights and Forecast - by Type
- 11.1.1. Flexible
- 11.1.2. Rigid
- 11.1.3. Transparent
- 11.2. Market Analysis, Insights and Forecast - by Display Address Scheme
- 11.2.1. PMOLED Display
- 11.2.2. AMOLED Display
- 11.3. Market Analysis, Insights and Forecast - by Size
- 11.3.1. Small-sized OLED Panel
- 11.3.2. Medium-sized OLED Panel
- 11.3.3. Large-sized OLED Panel
- 11.4. Market Analysis, Insights and Forecast - by Product
- 11.4.1. Mobile and Tablet
- 11.4.2. Television
- 11.4.3. Automotive
- 11.4.4. Wearable
- 11.4.5. Other Pr
- 11.1. Market Analysis, Insights and Forecast - by Type
- 12. Middle East and Africa OLED Panel Market Analysis, Insights and Forecast, 2020-2032
- 12.1. Market Analysis, Insights and Forecast - by Type
- 12.1.1. Flexible
- 12.1.2. Rigid
- 12.1.3. Transparent
- 12.2. Market Analysis, Insights and Forecast - by Display Address Scheme
- 12.2.1. PMOLED Display
- 12.2.2. AMOLED Display
- 12.3. Market Analysis, Insights and Forecast - by Size
- 12.3.1. Small-sized OLED Panel
- 12.3.2. Medium-sized OLED Panel
- 12.3.3. Large-sized OLED Panel
- 12.4. Market Analysis, Insights and Forecast - by Product
- 12.4.1. Mobile and Tablet
- 12.4.2. Television
- 12.4.3. Automotive
- 12.4.4. Wearable
- 12.4.5. Other Pr
- 12.1. Market Analysis, Insights and Forecast - by Type
- 13. Competitive Analysis
- 13.1. Company Profiles
- 13.1.1 Visionox Co Ltd*List Not Exhaustive
- 13.1.1.1. Company Overview
- 13.1.1.2. Products
- 13.1.1.3. Company Financials
- 13.1.1.4. SWOT Analysis
- 13.1.2 LG Display Co Ltd
- 13.1.2.1. Company Overview
- 13.1.2.2. Products
- 13.1.2.3. Company Financials
- 13.1.2.4. SWOT Analysis
- 13.1.3 OSRAM OLED GmbH
- 13.1.3.1. Company Overview
- 13.1.3.2. Products
- 13.1.3.3. Company Financials
- 13.1.3.4. SWOT Analysis
- 13.1.4 Ritek Corporation
- 13.1.4.1. Company Overview
- 13.1.4.2. Products
- 13.1.4.3. Company Financials
- 13.1.4.4. SWOT Analysis
- 13.1.5 Samsung Display Co Ltd
- 13.1.5.1. Company Overview
- 13.1.5.2. Products
- 13.1.5.3. Company Financials
- 13.1.5.4. SWOT Analysis
- 13.1.6 Raystar Optronics Inc
- 13.1.6.1. Company Overview
- 13.1.6.2. Products
- 13.1.6.3. Company Financials
- 13.1.6.4. SWOT Analysis
- 13.1.7 Winstar Display Co Ltd
- 13.1.7.1. Company Overview
- 13.1.7.2. Products
- 13.1.7.3. Company Financials
- 13.1.7.4. SWOT Analysis
- 13.1.8 Pioneer Corporation
- 13.1.8.1. Company Overview
- 13.1.8.2. Products
- 13.1.8.3. Company Financials
- 13.1.8.4. SWOT Analysis
- 13.1.9 WiseChip Semiconductor Inc
- 13.1.9.1. Company Overview
- 13.1.9.2. Products
- 13.1.9.3. Company Financials
- 13.1.9.4. SWOT Analysis
- 13.1.10 Sony Corporation
- 13.1.10.1. Company Overview
- 13.1.10.2. Products
- 13.1.10.3. Company Financials
- 13.1.10.4. SWOT Analysis
- 13.1.1 Visionox Co Ltd*List Not Exhaustive
- 13.2. Market Entropy
- 13.2.1 Company's Key Areas Served
- 13.2.2 Recent Developments
- 13.3. Company Market Share Analysis 2025
- 13.3.1 Top 5 Companies Market Share Analysis
- 13.3.2 Top 3 Companies Market Share Analysis
- 13.4. List of Potential Customers
- 14. Research Methodology
List of Figures
- Figure 1: Global OLED Panel Market Revenue Breakdown (Million, %) by Region 2025 & 2033
- Figure 2: North America OLED Panel Market Revenue (Million), by Type 2025 & 2033
- Figure 3: North America OLED Panel Market Revenue Share (%), by Type 2025 & 2033
- Figure 4: North America OLED Panel Market Revenue (Million), by Display Address Scheme 2025 & 2033
- Figure 5: North America OLED Panel Market Revenue Share (%), by Display Address Scheme 2025 & 2033
- Figure 6: North America OLED Panel Market Revenue (Million), by Size 2025 & 2033
- Figure 7: North America OLED Panel Market Revenue Share (%), by Size 2025 & 2033
- Figure 8: North America OLED Panel Market Revenue (Million), by Product 2025 & 2033
- Figure 9: North America OLED Panel Market Revenue Share (%), by Product 2025 & 2033
- Figure 10: North America OLED Panel Market Revenue (Million), by Country 2025 & 2033
- Figure 11: North America OLED Panel Market Revenue Share (%), by Country 2025 & 2033
- Figure 12: Europe OLED Panel Market Revenue (Million), by Type 2025 & 2033
- Figure 13: Europe OLED Panel Market Revenue Share (%), by Type 2025 & 2033
- Figure 14: Europe OLED Panel Market Revenue (Million), by Display Address Scheme 2025 & 2033
- Figure 15: Europe OLED Panel Market Revenue Share (%), by Display Address Scheme 2025 & 2033
- Figure 16: Europe OLED Panel Market Revenue (Million), by Size 2025 & 2033
- Figure 17: Europe OLED Panel Market Revenue Share (%), by Size 2025 & 2033
- Figure 18: Europe OLED Panel Market Revenue (Million), by Product 2025 & 2033
- Figure 19: Europe OLED Panel Market Revenue Share (%), by Product 2025 & 2033
- Figure 20: Europe OLED Panel Market Revenue (Million), by Country 2025 & 2033
- Figure 21: Europe OLED Panel Market Revenue Share (%), by Country 2025 & 2033
- Figure 22: Asia OLED Panel Market Revenue (Million), by Type 2025 & 2033
- Figure 23: Asia OLED Panel Market Revenue Share (%), by Type 2025 & 2033
- Figure 24: Asia OLED Panel Market Revenue (Million), by Display Address Scheme 2025 & 2033
- Figure 25: Asia OLED Panel Market Revenue Share (%), by Display Address Scheme 2025 & 2033
- Figure 26: Asia OLED Panel Market Revenue (Million), by Size 2025 & 2033
- Figure 27: Asia OLED Panel Market Revenue Share (%), by Size 2025 & 2033
- Figure 28: Asia OLED Panel Market Revenue (Million), by Product 2025 & 2033
- Figure 29: Asia OLED Panel Market Revenue Share (%), by Product 2025 & 2033
- Figure 30: Asia OLED Panel Market Revenue (Million), by Country 2025 & 2033
- Figure 31: Asia OLED Panel Market Revenue Share (%), by Country 2025 & 2033
- Figure 32: Australia and New Zealand OLED Panel Market Revenue (Million), by Type 2025 & 2033
- Figure 33: Australia and New Zealand OLED Panel Market Revenue Share (%), by Type 2025 & 2033
- Figure 34: Australia and New Zealand OLED Panel Market Revenue (Million), by Display Address Scheme 2025 & 2033
- Figure 35: Australia and New Zealand OLED Panel Market Revenue Share (%), by Display Address Scheme 2025 & 2033
- Figure 36: Australia and New Zealand OLED Panel Market Revenue (Million), by Size 2025 & 2033
- Figure 37: Australia and New Zealand OLED Panel Market Revenue Share (%), by Size 2025 & 2033
- Figure 38: Australia and New Zealand OLED Panel Market Revenue (Million), by Product 2025 & 2033
- Figure 39: Australia and New Zealand OLED Panel Market Revenue Share (%), by Product 2025 & 2033
- Figure 40: Australia and New Zealand OLED Panel Market Revenue (Million), by Country 2025 & 2033
- Figure 41: Australia and New Zealand OLED Panel Market Revenue Share (%), by Country 2025 & 2033
- Figure 42: Latin America OLED Panel Market Revenue (Million), by Type 2025 & 2033
- Figure 43: Latin America OLED Panel Market Revenue Share (%), by Type 2025 & 2033
- Figure 44: Latin America OLED Panel Market Revenue (Million), by Display Address Scheme 2025 & 2033
- Figure 45: Latin America OLED Panel Market Revenue Share (%), by Display Address Scheme 2025 & 2033
- Figure 46: Latin America OLED Panel Market Revenue (Million), by Size 2025 & 2033
- Figure 47: Latin America OLED Panel Market Revenue Share (%), by Size 2025 & 2033
- Figure 48: Latin America OLED Panel Market Revenue (Million), by Product 2025 & 2033
- Figure 49: Latin America OLED Panel Market Revenue Share (%), by Product 2025 & 2033
- Figure 50: Latin America OLED Panel Market Revenue (Million), by Country 2025 & 2033
- Figure 51: Latin America OLED Panel Market Revenue Share (%), by Country 2025 & 2033
- Figure 52: Middle East and Africa OLED Panel Market Revenue (Million), by Type 2025 & 2033
- Figure 53: Middle East and Africa OLED Panel Market Revenue Share (%), by Type 2025 & 2033
- Figure 54: Middle East and Africa OLED Panel Market Revenue (Million), by Display Address Scheme 2025 & 2033
- Figure 55: Middle East and Africa OLED Panel Market Revenue Share (%), by Display Address Scheme 2025 & 2033
- Figure 56: Middle East and Africa OLED Panel Market Revenue (Million), by Size 2025 & 2033
- Figure 57: Middle East and Africa OLED Panel Market Revenue Share (%), by Size 2025 & 2033
- Figure 58: Middle East and Africa OLED Panel Market Revenue (Million), by Product 2025 & 2033
- Figure 59: Middle East and Africa OLED Panel Market Revenue Share (%), by Product 2025 & 2033
- Figure 60: Middle East and Africa OLED Panel Market Revenue (Million), by Country 2025 & 2033
- Figure 61: Middle East and Africa OLED Panel Market Revenue Share (%), by Country 2025 & 2033
List of Tables
- Table 1: Global OLED Panel Market Revenue Million Forecast, by Type 2020 & 2033
- Table 2: Global OLED Panel Market Revenue Million Forecast, by Display Address Scheme 2020 & 2033
- Table 3: Global OLED Panel Market Revenue Million Forecast, by Size 2020 & 2033
- Table 4: Global OLED Panel Market Revenue Million Forecast, by Product 2020 & 2033
- Table 5: Global OLED Panel Market Revenue Million Forecast, by Region 2020 & 2033
- Table 6: Global OLED Panel Market Revenue Million Forecast, by Type 2020 & 2033
- Table 7: Global OLED Panel Market Revenue Million Forecast, by Display Address Scheme 2020 & 2033
- Table 8: Global OLED Panel Market Revenue Million Forecast, by Size 2020 & 2033
- Table 9: Global OLED Panel Market Revenue Million Forecast, by Product 2020 & 2033
- Table 10: Global OLED Panel Market Revenue Million Forecast, by Country 2020 & 2033
- Table 11: United States OLED Panel Market Revenue (Million) Forecast, by Application 2020 & 2033
- Table 12: Canada OLED Panel Market Revenue (Million) Forecast, by Application 2020 & 2033
- Table 13: Global OLED Panel Market Revenue Million Forecast, by Type 2020 & 2033
- Table 14: Global OLED Panel Market Revenue Million Forecast, by Display Address Scheme 2020 & 2033
- Table 15: Global OLED Panel Market Revenue Million Forecast, by Size 2020 & 2033
- Table 16: Global OLED Panel Market Revenue Million Forecast, by Product 2020 & 2033
- Table 17: Global OLED Panel Market Revenue Million Forecast, by Country 2020 & 2033
- Table 18: United Kingdom OLED Panel Market Revenue (Million) Forecast, by Application 2020 & 2033
- Table 19: Germany OLED Panel Market Revenue (Million) Forecast, by Application 2020 & 2033
- Table 20: Italy OLED Panel Market Revenue (Million) Forecast, by Application 2020 & 2033
- Table 21: France OLED Panel Market Revenue (Million) Forecast, by Application 2020 & 2033
- Table 22: Global OLED Panel Market Revenue Million Forecast, by Type 2020 & 2033
- Table 23: Global OLED Panel Market Revenue Million Forecast, by Display Address Scheme 2020 & 2033
- Table 24: Global OLED Panel Market Revenue Million Forecast, by Size 2020 & 2033
- Table 25: Global OLED Panel Market Revenue Million Forecast, by Product 2020 & 2033
- Table 26: Global OLED Panel Market Revenue Million Forecast, by Country 2020 & 2033
- Table 27: China OLED Panel Market Revenue (Million) Forecast, by Application 2020 & 2033
- Table 28: India OLED Panel Market Revenue (Million) Forecast, by Application 2020 & 2033
- Table 29: Japan OLED Panel Market Revenue (Million) Forecast, by Application 2020 & 2033
- Table 30: South Korea OLED Panel Market Revenue (Million) Forecast, by Application 2020 & 2033
- Table 31: Global OLED Panel Market Revenue Million Forecast, by Type 2020 & 2033
- Table 32: Global OLED Panel Market Revenue Million Forecast, by Display Address Scheme 2020 & 2033
- Table 33: Global OLED Panel Market Revenue Million Forecast, by Size 2020 & 2033
- Table 34: Global OLED Panel Market Revenue Million Forecast, by Product 2020 & 2033
- Table 35: Global OLED Panel Market Revenue Million Forecast, by Country 2020 & 2033
- Table 36: Global OLED Panel Market Revenue Million Forecast, by Type 2020 & 2033
- Table 37: Global OLED Panel Market Revenue Million Forecast, by Display Address Scheme 2020 & 2033
- Table 38: Global OLED Panel Market Revenue Million Forecast, by Size 2020 & 2033
- Table 39: Global OLED Panel Market Revenue Million Forecast, by Product 2020 & 2033
- Table 40: Global OLED Panel Market Revenue Million Forecast, by Country 2020 & 2033
- Table 41: Brazil OLED Panel Market Revenue (Million) Forecast, by Application 2020 & 2033
- Table 42: Mexico OLED Panel Market Revenue (Million) Forecast, by Application 2020 & 2033
- Table 43: Global OLED Panel Market Revenue Million Forecast, by Type 2020 & 2033
- Table 44: Global OLED Panel Market Revenue Million Forecast, by Display Address Scheme 2020 & 2033
- Table 45: Global OLED Panel Market Revenue Million Forecast, by Size 2020 & 2033
- Table 46: Global OLED Panel Market Revenue Million Forecast, by Product 2020 & 2033
- Table 47: Global OLED Panel Market Revenue Million Forecast, by Country 2020 & 2033
Frequently Asked Questions
1. What is the projected Compound Annual Growth Rate (CAGR) of the OLED Panel Market?
The projected CAGR is approximately 13.19%.
2. Which companies are prominent players in the OLED Panel Market?
Key companies in the market include Visionox Co Ltd*List Not Exhaustive, LG Display Co Ltd, OSRAM OLED GmbH, Ritek Corporation, Samsung Display Co Ltd, Raystar Optronics Inc, Winstar Display Co Ltd, Pioneer Corporation, WiseChip Semiconductor Inc, Sony Corporation.
3. What are the main segments of the OLED Panel Market?
The market segments include Type, Display Address Scheme, Size, Product.
4. Can you provide details about the market size?
The market size is estimated to be USD 51.63 Million as of 2022.
5. What are some drivers contributing to market growth?
Increasing Adoption of OLEDs in Smartphones; Government Support for the Development of OLED Technology in Various Countries.
6. What are the notable trends driving market growth?
AMOLED Display in Smartphone is Expected to Witness High Growth.
7. Are there any restraints impacting market growth?
; High Cost of Implementation and Maintenance.
8. Can you provide examples of recent developments in the market?
January 2023: At CES 2023, LG Display, a pioneer in display technology, unveiled the third-generation OLED TV panel. The latest OLED TV panel from the manufacturer, based on "META Technology," offers the best possible image quality. The company's most recent OLED displays utilize META Technology to produce pictures that are 60% brighter than those produced by standard OLED productions and with viewing angles that are 30% broader.
9. What pricing options are available for accessing the report?
Pricing options include single-user, multi-user, and enterprise licenses priced at USD 4750, USD 5250, and USD 8750 respectively.
10. Is the market size provided in terms of value or volume?
The market size is provided in terms of value, measured in Million.
11. Are there any specific market keywords associated with the report?
Yes, the market keyword associated with the report is "OLED Panel Market," which aids in identifying and referencing the specific market segment covered.
12. How do I determine which pricing option suits my needs best?
The pricing options vary based on user requirements and access needs. Individual users may opt for single-user licenses, while businesses requiring broader access may choose multi-user or enterprise licenses for cost-effective access to the report.
13. Are there any additional resources or data provided in the OLED Panel Market report?
While the report offers comprehensive insights, it's advisable to review the specific contents or supplementary materials provided to ascertain if additional resources or data are available.
14. How can I stay updated on further developments or reports in the OLED Panel Market?
To stay informed about further developments, trends, and reports in the OLED Panel Market, consider subscribing to industry newsletters, following relevant companies and organizations, or regularly checking reputable industry news sources and publications.
Methodology
Step 1 - Identification of Relevant Samples Size from Population Database


Step 2 - Approaches for Defining Global Market Size (Value, Volume* & Price*)

Note*: In applicable scenarios
Step 3 - Data Sources
Primary Research
- Web Analytics
- Survey Reports
- Research Institute
- Latest Research Reports
- Opinion Leaders
Secondary Research
- Annual Reports
- White Paper
- Latest Press Release
- Industry Association
- Paid Database
- Investor Presentations

Step 4 - Data Triangulation
Involves using different sources of information in order to increase the validity of a study
These sources are likely to be stakeholders in a program - participants, other researchers, program staff, other community members, and so on.
Then we put all data in single framework & apply various statistical tools to find out the dynamic on the market.
During the analysis stage, feedback from the stakeholder groups would be compared to determine areas of agreement as well as areas of divergence