

Key Insights
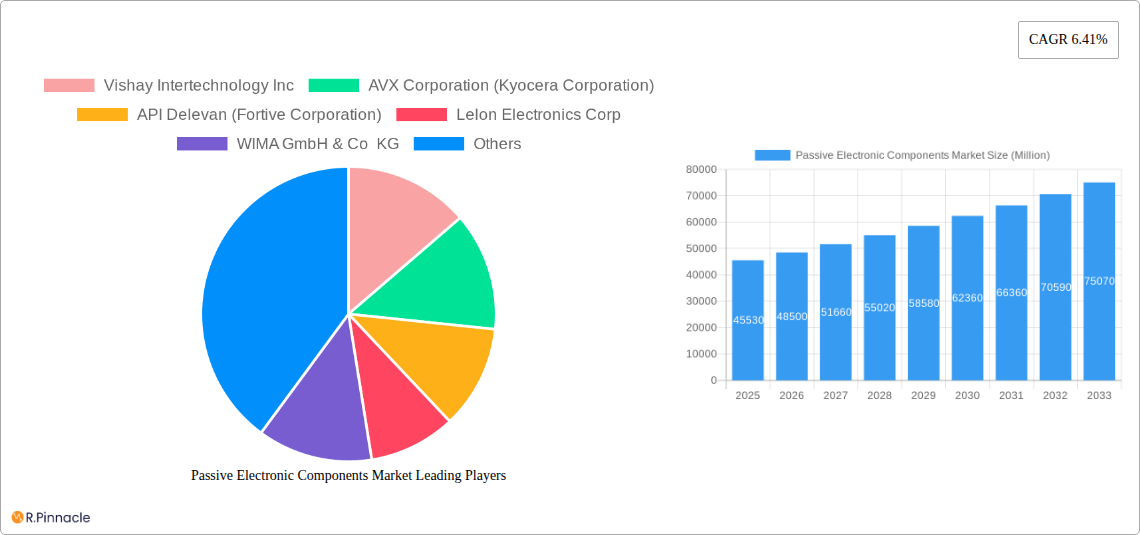
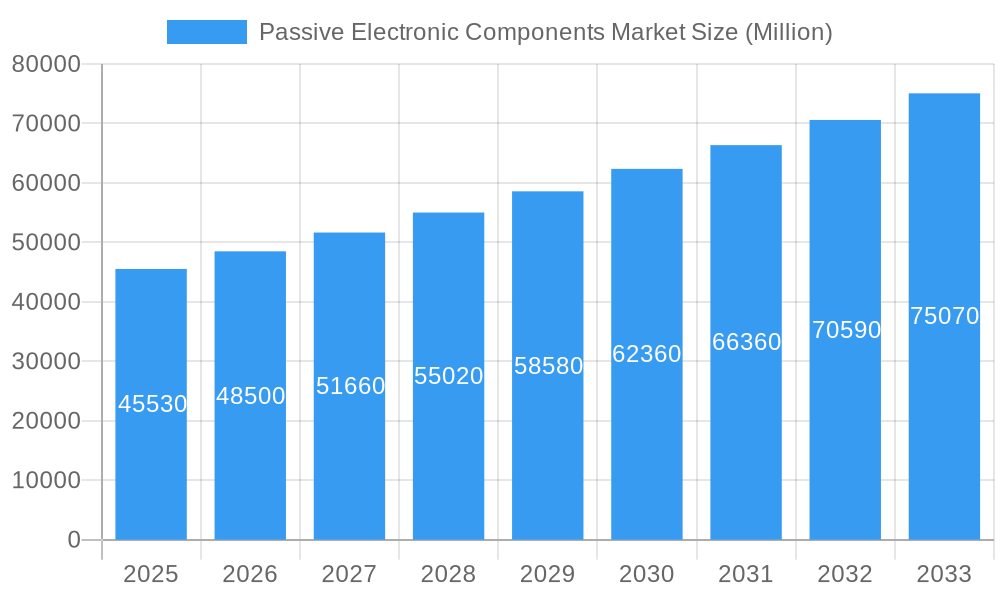
The Passive Electronic Components market, valued at $45.53 billion in 2025, is projected to experience robust growth, driven by the increasing demand for electronics across diverse sectors. The Compound Annual Growth Rate (CAGR) of 6.41% from 2025 to 2033 indicates a significant expansion of this market over the forecast period. Key drivers include the proliferation of smartphones, IoT devices, electric vehicles, and renewable energy systems, all heavily reliant on passive components like capacitors and resistors. Technological advancements leading to miniaturization, improved efficiency, and enhanced performance further fuel market expansion. Growth in specific segments, such as high-frequency capacitors for 5G infrastructure and supercapacitors for energy storage applications, is expected to be particularly noteworthy. While supply chain disruptions and material cost fluctuations pose potential restraints, ongoing innovation and diversification of manufacturing sources are mitigating these challenges. The market is segmented by component type (e.g., capacitors, resistors, inductors) and end-user industry (e.g., automotive, consumer electronics, industrial). Major players like Vishay Intertechnology, AVX Corporation, and Murata Manufacturing are actively engaged in research and development, strategic partnerships, and mergers & acquisitions to maintain a competitive edge. Geographical distribution reveals a strong presence across North America, Europe, and Asia-Pacific, with Asia-Pacific anticipated to witness the fastest growth due to its burgeoning electronics manufacturing sector.
Passive Electronic Components Market Market Size (In Billion)
The market's future hinges on technological breakthroughs in materials science and manufacturing processes. The development of advanced materials with higher energy density and improved performance characteristics will play a crucial role in shaping the market landscape. Furthermore, the increasing adoption of Industry 4.0 and smart manufacturing techniques within the passive component industry will optimize production efficiency and reduce costs, contributing to sustained market growth. The market is expected to witness consolidation as larger players acquire smaller companies to expand their product portfolio and market reach. The emphasis on miniaturization and integration of passive components into System-in-Package (SiP) solutions further drives market evolution. Understanding these trends and competitive dynamics is crucial for both market participants and investors seeking opportunities within this expanding sector.
Passive Electronic Components Market Company Market Share
Passive Electronic Components Market Report: 2019-2033
This comprehensive report provides an in-depth analysis of the Passive Electronic Components Market, covering the period 2019-2033. It offers invaluable insights into market structure, dynamics, leading players, and future growth potential, equipping industry professionals with actionable intelligence for strategic decision-making. The report utilizes data from 2019-2024 (historical period) and projects market trends until 2033 (forecast period), with 2025 serving as the base and estimated year. The market is segmented by type (Capacitors and Supercapacitors) and end-user industry, offering granular analysis of key trends. The total market size is projected to reach xx Million by 2033.
Passive Electronic Components Market Market Structure & Innovation Trends
The Passive Electronic Components Market exhibits a moderately consolidated structure, with several major players commanding significant market share. Market leaders like Murata Manufacturing Co Ltd, TDK Corporation, and Vishay Intertechnology Inc. collectively hold an estimated xx% market share, showcasing a strong competitive landscape. Innovation is a critical driver, fueled by the increasing demand for miniaturization, higher performance, and energy efficiency in electronic devices. Regulatory frameworks, such as those related to RoHS and REACH compliance, significantly impact material selection and manufacturing processes. The market also witnesses continuous development of product substitutes, particularly in energy storage solutions, pushing companies to innovate. End-user demographics, largely driven by the growth in consumer electronics, automotive, and industrial automation, significantly influence market demand. M&A activity has been relatively frequent, with deals primarily focused on expanding product portfolios and geographical reach. The average M&A deal value in the past five years has been approximately xx Million.
- Market Concentration: High, with top players holding xx% market share.
- Innovation Drivers: Miniaturization, performance enhancement, energy efficiency.
- Regulatory Frameworks: RoHS, REACH compliance, impacting material choice.
- Product Substitutes: Emerging technologies challenge existing solutions.
- End-User Demographics: Strong growth driven by consumer electronics, automotive, and industrial automation.
- M&A Activity: Frequent acquisitions focusing on portfolio expansion and geographical reach.
Passive Electronic Components Market Market Dynamics & Trends
The Passive Electronic Components Market is experiencing robust growth, driven by a CAGR of xx% during the forecast period (2025-2033). Key growth drivers include the proliferation of smart devices, the rise of electric vehicles, the expansion of 5G infrastructure, and the increasing adoption of industrial automation. Technological disruptions, such as the development of advanced materials and manufacturing processes, are significantly impacting product performance and cost. Consumer preferences for smaller, lighter, and more energy-efficient electronics fuel demand for advanced passive components. Competitive dynamics are characterized by intense innovation, strategic partnerships, and aggressive pricing strategies. Market penetration of new technologies, like advanced ceramic capacitors and solid-state supercapacitors, is steadily increasing, reaching approximately xx% in 2025 and projected to reach xx% by 2033.
Dominant Regions & Segments in Passive Electronic Components Market
Asia, particularly China, Japan, and South Korea, dominates the Passive Electronic Components Market, accounting for over xx% of global demand. This dominance is fueled by a strong manufacturing base, a large consumer electronics market, and supportive government policies promoting technological advancements. Within the segments:
Capacitors: By Type: Ceramic capacitors hold the largest market share due to their versatility and cost-effectiveness in diverse applications. Film capacitors and electrolytic capacitors also contribute significantly.
Supercapacitors: By End-user Industry: The automotive industry is a major driver, with significant growth propelled by the increasing adoption of hybrid and electric vehicles, followed by the energy storage sector.
Key Drivers:
- Strong manufacturing base in Asia.
- Large consumer electronics markets.
- Government support for technological advancements.
- Increasing demand for energy storage solutions in electric vehicles.
Passive Electronic Components Market Product Innovations
Recent innovations focus on miniaturization, improved performance, and enhanced energy density. Key trends include the development of high-frequency capacitors for 5G applications, advanced ceramic capacitors with improved temperature stability, and solid-state supercapacitors with higher energy density and longer lifespan. These innovations improve product reliability, reduce size and weight, and enhance energy efficiency, providing significant competitive advantages in demanding applications.
Report Scope & Segmentation Analysis
This report segments the Passive Electronic Components Market by component type (capacitors, inductors, resistors, etc.), capacitor type (ceramic, film, electrolytic), supercapacitor type (by application) and end-user industry (consumer electronics, automotive, industrial, etc.). Each segment's market size, growth projection, and competitive dynamics are analyzed in detail.
Capacitors: The ceramic capacitor segment is expected to witness significant growth driven by increased demand for consumer electronics and automotive applications. Market size is projected at xx Million by 2033.
Supercapacitors: The automotive sector is expected to drive supercapacitor growth due to the rising popularity of electric and hybrid vehicles. Market size is projected at xx Million by 2033.
Key Drivers of Passive Electronic Components Market Growth
The market is propelled by several factors: the increasing demand for miniaturized and high-performance electronic components from the consumer electronics, automotive, and industrial automation sectors; advancements in materials science leading to the development of high-performance components; and growing investment in research and development leading to new technologies. Stringent government regulations on energy efficiency further encourage the use of high-efficiency passive components.
Challenges in the Passive Electronic Components Market Sector
The Passive Electronic Components Market faces challenges including supply chain disruptions impacting component availability and pricing; intense competition leading to pricing pressures; and evolving regulatory requirements requiring continuous product adaptation. These factors contribute to increased manufacturing costs and potential delays in product delivery, impacting overall profitability.
Emerging Opportunities in Passive Electronic Components Market
Significant opportunities exist in emerging markets with rapid growth in electronic consumption; the development of energy-efficient and environmentally friendly components; and applications in areas such as renewable energy storage and smart grids. These trends represent significant growth potential for the coming decade.
Leading Players in the Passive Electronic Components Market Market
- Vishay Intertechnology Inc
- AVX Corporation (Kyocera Corporation)
- API Delevan (Fortive Corporation)
- Lelon Electronics Corp
- WIMA GmbH & Co KG
- Delta Electronics Inc
- TT Electronics PLC
- Susumu Co Ltd
- Cornell Dubilier Electronics Inc
- Viking Tech Corporation
- Coilcraft Inc
- KOA Speer Electronics Inc
- Yageo Corporation
- TE Connectivity Ltd
- United Chemi-Con (Nippon Chemi-con Corporation)
- Wurth Elektronik Group
- Taiyo Yuden Co Ltd
- Bourns Inc
- TDK Corporation
- Murata Manufacturing Co Ltd
- Sagami Elec Co Ltd
- Ohmite Manufacturing Company
- Panasonic Corporation
- Honeywell International Inc
- Eaton Corporation
Key Developments in Passive Electronic Components Market Industry
November 2023: Fukui Murata Manufacturing Co. Ltd. announced plans to establish a new Ceramic Capacitor R&D Center, aiming to enhance technological capabilities in ceramic capacitor development and manufacturing. This underscores Murata's commitment to innovation in its core business.
November 2023: KYOCERA AVX launched its first safety-certified MLCCs (KGK and KGH Series), expanding its portfolio of commercial surface-mount MLCCs. This strengthens KYOCERA AVX's position in the safety-critical components market.
Future Outlook for Passive Electronic Components Market Market
The Passive Electronic Components Market is poised for continued growth, driven by technological advancements, increasing demand from diverse end-user sectors, and the development of new applications. Strategic partnerships, investments in R&D, and product diversification will be key to achieving sustained market leadership in this dynamic sector. The market's strong growth trajectory, coupled with emerging opportunities in new technologies and applications, promises significant potential for both established players and new entrants.
Passive Electronic Components Market Segmentation
-
1. Type
- 1.1. Capacitors
- 1.2. resistors
- 1.3. inductors
- 1.4. other components
-
2. Application
- 2.1. Consumer electronics
- 2.2. automotive
- 2.3. industrial
- 2.4. healthcare
- 2.5. aerospace & defense
Passive Electronic Components Market Segmentation By Geography
-
1. North America
- 1.1. United States
- 1.2. Canada
- 1.3. Mexico
-
2. Europe
- 2.1. Germany
- 2.2. United Kingdom
- 2.3. France
- 2.4. Italy
- 2.5. Spain
- 2.6. Rest of Europe
-
3. Asia Pacific
- 3.1. China
- 3.2. Japan
- 3.3. India
- 3.4. Australia
- 3.5. South Korea
- 3.6. Rest of Asia Pacific
-
4. Middle East and Africa
- 4.1. GCC
- 4.2. South Africa
- 4.3. Rest of Middle East and Africa
-
5. South America
- 5.1. Brazil
- 5.2. Argentina
- 5.3. Rest of South America
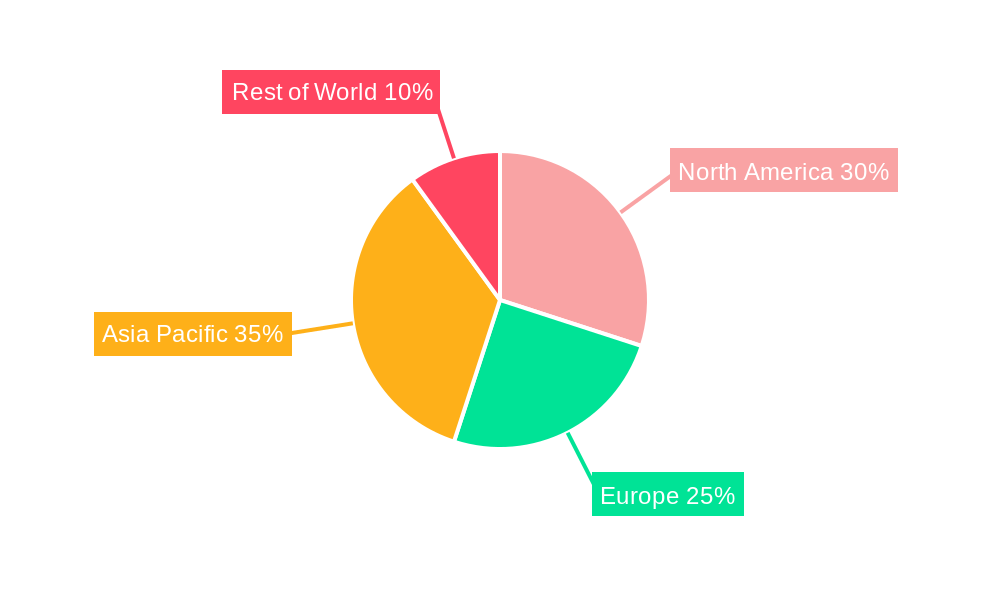
Passive Electronic Components Market Regional Market Share
Geographic Coverage of Passive Electronic Components Market
Passive Electronic Components Market REPORT HIGHLIGHTS
| Aspects | Details |
|---|---|
| Study Period | 2020-2034 |
| Base Year | 2025 |
| Estimated Year | 2026 |
| Forecast Period | 2026-2034 |
| Historical Period | 2020-2025 |
| Growth Rate | CAGR of 6.41% from 2020-2034 |
| Segmentation |
|
Table of Contents
- 1. Introduction
- 1.1. Research Scope
- 1.2. Market Segmentation
- 1.3. Research Objective
- 1.4. Definitions and Assumptions
- 2. Executive Summary
- 2.1. Market Snapshot
- 3. Market Dynamics
- 3.1. Market Drivers
- 3.2. Market Restrains
- 3.3. Market Trends
- 3.4. Market Opportunities
- 4. Market Factor Analysis
- 4.1. Porters Five Forces
- 4.1.1. Bargaining Power of Suppliers
- 4.1.2. Bargaining Power of Buyers
- 4.1.3. Threat of New Entrants
- 4.1.4. Threat of Substitutes
- 4.1.5. Competitive Rivalry
- 4.2. PESTEL analysis
- 4.3. BCG Analysis
- 4.3.1. Stars (High Growth, High Market Share)
- 4.3.2. Cash Cows (Low Growth, High Market Share)
- 4.3.3. Question Mark (High Growth, Low Market Share)
- 4.3.4. Dogs (Low Growth, Low Market Share)
- 4.4. Ansoff Matrix Analysis
- 4.5. Supply Chain Analysis
- 4.6. Regulatory Landscape
- 4.7. Current Market Potential and Opportunity Assessment (TAM–SAM–SOM Framework)
- 4.8. PRI Analyst Note
- 4.1. Porters Five Forces
- 5. Market Analysis, Insights and Forecast 2021-2033
- 5.1. Market Analysis, Insights and Forecast - by Type
- 5.1.1. Capacitors
- 5.1.2. resistors
- 5.1.3. inductors
- 5.1.4. other components
- 5.2. Market Analysis, Insights and Forecast - by Application
- 5.2.1. Consumer electronics
- 5.2.2. automotive
- 5.2.3. industrial
- 5.2.4. healthcare
- 5.2.5. aerospace & defense
- 5.3. Market Analysis, Insights and Forecast - by Region
- 5.3.1. North America
- 5.3.2. Europe
- 5.3.3. Asia Pacific
- 5.3.4. Middle East and Africa
- 5.3.5. South America
- 5.1. Market Analysis, Insights and Forecast - by Type
- 6. Global Passive Electronic Components Market Analysis, Insights and Forecast, 2021-2033
- 6.1. Market Analysis, Insights and Forecast - by Type
- 6.1.1. Capacitors
- 6.1.2. resistors
- 6.1.3. inductors
- 6.1.4. other components
- 6.2. Market Analysis, Insights and Forecast - by Application
- 6.2.1. Consumer electronics
- 6.2.2. automotive
- 6.2.3. industrial
- 6.2.4. healthcare
- 6.2.5. aerospace & defense
- 6.1. Market Analysis, Insights and Forecast - by Type
- 7. North America Passive Electronic Components Market Analysis, Insights and Forecast, 2020-2032
- 7.1. Market Analysis, Insights and Forecast - by Type
- 7.1.1. Capacitors
- 7.1.2. resistors
- 7.1.3. inductors
- 7.1.4. other components
- 7.2. Market Analysis, Insights and Forecast - by Application
- 7.2.1. Consumer electronics
- 7.2.2. automotive
- 7.2.3. industrial
- 7.2.4. healthcare
- 7.2.5. aerospace & defense
- 7.1. Market Analysis, Insights and Forecast - by Type
- 8. Europe Passive Electronic Components Market Analysis, Insights and Forecast, 2020-2032
- 8.1. Market Analysis, Insights and Forecast - by Type
- 8.1.1. Capacitors
- 8.1.2. resistors
- 8.1.3. inductors
- 8.1.4. other components
- 8.2. Market Analysis, Insights and Forecast - by Application
- 8.2.1. Consumer electronics
- 8.2.2. automotive
- 8.2.3. industrial
- 8.2.4. healthcare
- 8.2.5. aerospace & defense
- 8.1. Market Analysis, Insights and Forecast - by Type
- 9. Asia Pacific Passive Electronic Components Market Analysis, Insights and Forecast, 2020-2032
- 9.1. Market Analysis, Insights and Forecast - by Type
- 9.1.1. Capacitors
- 9.1.2. resistors
- 9.1.3. inductors
- 9.1.4. other components
- 9.2. Market Analysis, Insights and Forecast - by Application
- 9.2.1. Consumer electronics
- 9.2.2. automotive
- 9.2.3. industrial
- 9.2.4. healthcare
- 9.2.5. aerospace & defense
- 9.1. Market Analysis, Insights and Forecast - by Type
- 10. Middle East and Africa Passive Electronic Components Market Analysis, Insights and Forecast, 2020-2032
- 10.1. Market Analysis, Insights and Forecast - by Type
- 10.1.1. Capacitors
- 10.1.2. resistors
- 10.1.3. inductors
- 10.1.4. other components
- 10.2. Market Analysis, Insights and Forecast - by Application
- 10.2.1. Consumer electronics
- 10.2.2. automotive
- 10.2.3. industrial
- 10.2.4. healthcare
- 10.2.5. aerospace & defense
- 10.1. Market Analysis, Insights and Forecast - by Type
- 11. South America Passive Electronic Components Market Analysis, Insights and Forecast, 2020-2032
- 11.1. Market Analysis, Insights and Forecast - by Type
- 11.1.1. Capacitors
- 11.1.2. resistors
- 11.1.3. inductors
- 11.1.4. other components
- 11.2. Market Analysis, Insights and Forecast - by Application
- 11.2.1. Consumer electronics
- 11.2.2. automotive
- 11.2.3. industrial
- 11.2.4. healthcare
- 11.2.5. aerospace & defense
- 11.1. Market Analysis, Insights and Forecast - by Type
- 12. Competitive Analysis
- 12.1. Company Profiles
- 12.1.1 Vishay Intertechnology Inc
- 12.1.1.1. Company Overview
- 12.1.1.2. Products
- 12.1.1.3. Company Financials
- 12.1.1.4. SWOT Analysis
- 12.1.2 AVX Corporation (Kyocera Corporation)
- 12.1.2.1. Company Overview
- 12.1.2.2. Products
- 12.1.2.3. Company Financials
- 12.1.2.4. SWOT Analysis
- 12.1.3 API Delevan (Fortive Corporation)
- 12.1.3.1. Company Overview
- 12.1.3.2. Products
- 12.1.3.3. Company Financials
- 12.1.3.4. SWOT Analysis
- 12.1.4 Lelon Electronics Corp
- 12.1.4.1. Company Overview
- 12.1.4.2. Products
- 12.1.4.3. Company Financials
- 12.1.4.4. SWOT Analysis
- 12.1.5 WIMA GmbH & Co KG
- 12.1.5.1. Company Overview
- 12.1.5.2. Products
- 12.1.5.3. Company Financials
- 12.1.5.4. SWOT Analysis
- 12.1.6 Delta Electronics Inc
- 12.1.6.1. Company Overview
- 12.1.6.2. Products
- 12.1.6.3. Company Financials
- 12.1.6.4. SWOT Analysis
- 12.1.7 TT Electronics PLC
- 12.1.7.1. Company Overview
- 12.1.7.2. Products
- 12.1.7.3. Company Financials
- 12.1.7.4. SWOT Analysis
- 12.1.8 Susumu Co Ltd
- 12.1.8.1. Company Overview
- 12.1.8.2. Products
- 12.1.8.3. Company Financials
- 12.1.8.4. SWOT Analysis
- 12.1.9 Cornell Dubilier Electronics Inc
- 12.1.9.1. Company Overview
- 12.1.9.2. Products
- 12.1.9.3. Company Financials
- 12.1.9.4. SWOT Analysis
- 12.1.10 Viking Tech Corporation
- 12.1.10.1. Company Overview
- 12.1.10.2. Products
- 12.1.10.3. Company Financials
- 12.1.10.4. SWOT Analysis
- 12.1.11 Coilcraft Inc
- 12.1.11.1. Company Overview
- 12.1.11.2. Products
- 12.1.11.3. Company Financials
- 12.1.11.4. SWOT Analysis
- 12.1.12 KOA Speer Electronics Inc
- 12.1.12.1. Company Overview
- 12.1.12.2. Products
- 12.1.12.3. Company Financials
- 12.1.12.4. SWOT Analysis
- 12.1.13 Yageo Corporation
- 12.1.13.1. Company Overview
- 12.1.13.2. Products
- 12.1.13.3. Company Financials
- 12.1.13.4. SWOT Analysis
- 12.1.14 TE Connectivity Ltd
- 12.1.14.1. Company Overview
- 12.1.14.2. Products
- 12.1.14.3. Company Financials
- 12.1.14.4. SWOT Analysis
- 12.1.15 United Chemi-Con (Nippon Chemi-con Corporation)
- 12.1.15.1. Company Overview
- 12.1.15.2. Products
- 12.1.15.3. Company Financials
- 12.1.15.4. SWOT Analysis
- 12.1.16 Wurth Elektronik Group
- 12.1.16.1. Company Overview
- 12.1.16.2. Products
- 12.1.16.3. Company Financials
- 12.1.16.4. SWOT Analysis
- 12.1.17 Taiyo Yuden Co Ltd
- 12.1.17.1. Company Overview
- 12.1.17.2. Products
- 12.1.17.3. Company Financials
- 12.1.17.4. SWOT Analysis
- 12.1.18 Bourns Inc
- 12.1.18.1. Company Overview
- 12.1.18.2. Products
- 12.1.18.3. Company Financials
- 12.1.18.4. SWOT Analysis
- 12.1.19 TDK Corporation
- 12.1.19.1. Company Overview
- 12.1.19.2. Products
- 12.1.19.3. Company Financials
- 12.1.19.4. SWOT Analysis
- 12.1.20 Murata Manufacturing Co Ltd
- 12.1.20.1. Company Overview
- 12.1.20.2. Products
- 12.1.20.3. Company Financials
- 12.1.20.4. SWOT Analysis
- 12.1.21 Sagami Elec Co Ltd
- 12.1.21.1. Company Overview
- 12.1.21.2. Products
- 12.1.21.3. Company Financials
- 12.1.21.4. SWOT Analysis
- 12.1.22 Ohmite Manufacturing Company
- 12.1.22.1. Company Overview
- 12.1.22.2. Products
- 12.1.22.3. Company Financials
- 12.1.22.4. SWOT Analysis
- 12.1.23 Panasonic Corporation
- 12.1.23.1. Company Overview
- 12.1.23.2. Products
- 12.1.23.3. Company Financials
- 12.1.23.4. SWOT Analysis
- 12.1.24 Honeywell International Inc
- 12.1.24.1. Company Overview
- 12.1.24.2. Products
- 12.1.24.3. Company Financials
- 12.1.24.4. SWOT Analysis
- 12.1.25 Eaton Corporation
- 12.1.25.1. Company Overview
- 12.1.25.2. Products
- 12.1.25.3. Company Financials
- 12.1.25.4. SWOT Analysis
- 12.1.1 Vishay Intertechnology Inc
- 12.2. Market Entropy
- 12.2.1 Company's Key Areas Served
- 12.2.2 Recent Developments
- 12.3. Company Market Share Analysis 2025
- 12.3.1 Top 5 Companies Market Share Analysis
- 12.3.2 Top 3 Companies Market Share Analysis
- 12.4. List of Potential Customers
- 13. Research Methodology
List of Figures
- Figure 1: Global Passive Electronic Components Market Revenue Breakdown (Million, %) by Region 2025 & 2033
- Figure 2: North America Passive Electronic Components Market Revenue (Million), by Type 2025 & 2033
- Figure 3: North America Passive Electronic Components Market Revenue Share (%), by Type 2025 & 2033
- Figure 4: North America Passive Electronic Components Market Revenue (Million), by Application 2025 & 2033
- Figure 5: North America Passive Electronic Components Market Revenue Share (%), by Application 2025 & 2033
- Figure 6: North America Passive Electronic Components Market Revenue (Million), by Country 2025 & 2033
- Figure 7: North America Passive Electronic Components Market Revenue Share (%), by Country 2025 & 2033
- Figure 8: Europe Passive Electronic Components Market Revenue (Million), by Type 2025 & 2033
- Figure 9: Europe Passive Electronic Components Market Revenue Share (%), by Type 2025 & 2033
- Figure 10: Europe Passive Electronic Components Market Revenue (Million), by Application 2025 & 2033
- Figure 11: Europe Passive Electronic Components Market Revenue Share (%), by Application 2025 & 2033
- Figure 12: Europe Passive Electronic Components Market Revenue (Million), by Country 2025 & 2033
- Figure 13: Europe Passive Electronic Components Market Revenue Share (%), by Country 2025 & 2033
- Figure 14: Asia Pacific Passive Electronic Components Market Revenue (Million), by Type 2025 & 2033
- Figure 15: Asia Pacific Passive Electronic Components Market Revenue Share (%), by Type 2025 & 2033
- Figure 16: Asia Pacific Passive Electronic Components Market Revenue (Million), by Application 2025 & 2033
- Figure 17: Asia Pacific Passive Electronic Components Market Revenue Share (%), by Application 2025 & 2033
- Figure 18: Asia Pacific Passive Electronic Components Market Revenue (Million), by Country 2025 & 2033
- Figure 19: Asia Pacific Passive Electronic Components Market Revenue Share (%), by Country 2025 & 2033
- Figure 20: Middle East and Africa Passive Electronic Components Market Revenue (Million), by Type 2025 & 2033
- Figure 21: Middle East and Africa Passive Electronic Components Market Revenue Share (%), by Type 2025 & 2033
- Figure 22: Middle East and Africa Passive Electronic Components Market Revenue (Million), by Application 2025 & 2033
- Figure 23: Middle East and Africa Passive Electronic Components Market Revenue Share (%), by Application 2025 & 2033
- Figure 24: Middle East and Africa Passive Electronic Components Market Revenue (Million), by Country 2025 & 2033
- Figure 25: Middle East and Africa Passive Electronic Components Market Revenue Share (%), by Country 2025 & 2033
- Figure 26: South America Passive Electronic Components Market Revenue (Million), by Type 2025 & 2033
- Figure 27: South America Passive Electronic Components Market Revenue Share (%), by Type 2025 & 2033
- Figure 28: South America Passive Electronic Components Market Revenue (Million), by Application 2025 & 2033
- Figure 29: South America Passive Electronic Components Market Revenue Share (%), by Application 2025 & 2033
- Figure 30: South America Passive Electronic Components Market Revenue (Million), by Country 2025 & 2033
- Figure 31: South America Passive Electronic Components Market Revenue Share (%), by Country 2025 & 2033
List of Tables
- Table 1: Global Passive Electronic Components Market Revenue Million Forecast, by Type 2020 & 2033
- Table 2: Global Passive Electronic Components Market Revenue Million Forecast, by Application 2020 & 2033
- Table 3: Global Passive Electronic Components Market Revenue Million Forecast, by Region 2020 & 2033
- Table 4: Global Passive Electronic Components Market Revenue Million Forecast, by Type 2020 & 2033
- Table 5: Global Passive Electronic Components Market Revenue Million Forecast, by Application 2020 & 2033
- Table 6: Global Passive Electronic Components Market Revenue Million Forecast, by Country 2020 & 2033
- Table 7: United States Passive Electronic Components Market Revenue (Million) Forecast, by Application 2020 & 2033
- Table 8: Canada Passive Electronic Components Market Revenue (Million) Forecast, by Application 2020 & 2033
- Table 9: Mexico Passive Electronic Components Market Revenue (Million) Forecast, by Application 2020 & 2033
- Table 10: Global Passive Electronic Components Market Revenue Million Forecast, by Type 2020 & 2033
- Table 11: Global Passive Electronic Components Market Revenue Million Forecast, by Application 2020 & 2033
- Table 12: Global Passive Electronic Components Market Revenue Million Forecast, by Country 2020 & 2033
- Table 13: Germany Passive Electronic Components Market Revenue (Million) Forecast, by Application 2020 & 2033
- Table 14: United Kingdom Passive Electronic Components Market Revenue (Million) Forecast, by Application 2020 & 2033
- Table 15: France Passive Electronic Components Market Revenue (Million) Forecast, by Application 2020 & 2033
- Table 16: Italy Passive Electronic Components Market Revenue (Million) Forecast, by Application 2020 & 2033
- Table 17: Spain Passive Electronic Components Market Revenue (Million) Forecast, by Application 2020 & 2033
- Table 18: Rest of Europe Passive Electronic Components Market Revenue (Million) Forecast, by Application 2020 & 2033
- Table 19: Global Passive Electronic Components Market Revenue Million Forecast, by Type 2020 & 2033
- Table 20: Global Passive Electronic Components Market Revenue Million Forecast, by Application 2020 & 2033
- Table 21: Global Passive Electronic Components Market Revenue Million Forecast, by Country 2020 & 2033
- Table 22: China Passive Electronic Components Market Revenue (Million) Forecast, by Application 2020 & 2033
- Table 23: Japan Passive Electronic Components Market Revenue (Million) Forecast, by Application 2020 & 2033
- Table 24: India Passive Electronic Components Market Revenue (Million) Forecast, by Application 2020 & 2033
- Table 25: Australia Passive Electronic Components Market Revenue (Million) Forecast, by Application 2020 & 2033
- Table 26: South Korea Passive Electronic Components Market Revenue (Million) Forecast, by Application 2020 & 2033
- Table 27: Rest of Asia Pacific Passive Electronic Components Market Revenue (Million) Forecast, by Application 2020 & 2033
- Table 28: Global Passive Electronic Components Market Revenue Million Forecast, by Type 2020 & 2033
- Table 29: Global Passive Electronic Components Market Revenue Million Forecast, by Application 2020 & 2033
- Table 30: Global Passive Electronic Components Market Revenue Million Forecast, by Country 2020 & 2033
- Table 31: GCC Passive Electronic Components Market Revenue (Million) Forecast, by Application 2020 & 2033
- Table 32: South Africa Passive Electronic Components Market Revenue (Million) Forecast, by Application 2020 & 2033
- Table 33: Rest of Middle East and Africa Passive Electronic Components Market Revenue (Million) Forecast, by Application 2020 & 2033
- Table 34: Global Passive Electronic Components Market Revenue Million Forecast, by Type 2020 & 2033
- Table 35: Global Passive Electronic Components Market Revenue Million Forecast, by Application 2020 & 2033
- Table 36: Global Passive Electronic Components Market Revenue Million Forecast, by Country 2020 & 2033
- Table 37: Brazil Passive Electronic Components Market Revenue (Million) Forecast, by Application 2020 & 2033
- Table 38: Argentina Passive Electronic Components Market Revenue (Million) Forecast, by Application 2020 & 2033
- Table 39: Rest of South America Passive Electronic Components Market Revenue (Million) Forecast, by Application 2020 & 2033
Frequently Asked Questions
1. What is the projected Compound Annual Growth Rate (CAGR) of the Passive Electronic Components Market?
The projected CAGR is approximately 6.41%.
2. Which companies are prominent players in the Passive Electronic Components Market?
Key companies in the market include Vishay Intertechnology Inc, AVX Corporation (Kyocera Corporation), API Delevan (Fortive Corporation), Lelon Electronics Corp, WIMA GmbH & Co KG, Delta Electronics Inc, TT Electronics PLC, Susumu Co Ltd, Cornell Dubilier Electronics Inc, Viking Tech Corporation, Coilcraft Inc, KOA Speer Electronics Inc, Yageo Corporation, TE Connectivity Ltd, United Chemi-Con (Nippon Chemi-con Corporation), Wurth Elektronik Group, Taiyo Yuden Co Ltd, Bourns Inc, TDK Corporation, Murata Manufacturing Co Ltd, Sagami Elec Co Ltd, Ohmite Manufacturing Company, Panasonic Corporation, Honeywell International Inc , Eaton Corporation.
3. What are the main segments of the Passive Electronic Components Market?
The market segments include Type, Application.
4. Can you provide details about the market size?
The market size is estimated to be USD 45.53 Million as of 2022.
5. What are some drivers contributing to market growth?
Increasing Complexity of Electronics; Increasing Miniaturized Design Preferences.
6. What are the notable trends driving market growth?
The Consumer Electronics and Computing Industry in the Inductors Segment is Expected to Hold a Significant Market Share.
7. Are there any restraints impacting market growth?
Stringent Regulatory Compliance and Safety Standards.
8. Can you provide examples of recent developments in the market?
November 2023: Fukui Murata Manufacturing Co. Ltd, a manufacturing subsidiary of Murata Manufacturing Co. Ltd, announced its plans to establish a new R&D base, “Ceramic Capacitor R&D Center,” near Echizen-Takefu Station in Fukui Prefecture. The establishment of the Ceramic Capacitor R&D Center aims to improve the company's technological capabilities in developing and manufacturing ceramic capacitors, which is Murata Manufacturing’s core business. The construction commenced in November 2023, with the inauguration planned for April 2026.
9. What pricing options are available for accessing the report?
Pricing options include single-user, multi-user, and enterprise licenses priced at USD 4750, USD 5250, and USD 8750 respectively.
10. Is the market size provided in terms of value or volume?
The market size is provided in terms of value, measured in Million.
11. Are there any specific market keywords associated with the report?
Yes, the market keyword associated with the report is "Passive Electronic Components Market," which aids in identifying and referencing the specific market segment covered.
12. How do I determine which pricing option suits my needs best?
The pricing options vary based on user requirements and access needs. Individual users may opt for single-user licenses, while businesses requiring broader access may choose multi-user or enterprise licenses for cost-effective access to the report.
13. Are there any additional resources or data provided in the Passive Electronic Components Market report?
While the report offers comprehensive insights, it's advisable to review the specific contents or supplementary materials provided to ascertain if additional resources or data are available.
14. How can I stay updated on further developments or reports in the Passive Electronic Components Market?
To stay informed about further developments, trends, and reports in the Passive Electronic Components Market, consider subscribing to industry newsletters, following relevant companies and organizations, or regularly checking reputable industry news sources and publications.
Methodology
Step 1 - Identification of Relevant Samples Size from Population Database


Step 2 - Approaches for Defining Global Market Size (Value, Volume* & Price*)

Note*: In applicable scenarios
Step 3 - Data Sources
Primary Research
- Web Analytics
- Survey Reports
- Research Institute
- Latest Research Reports
- Opinion Leaders
Secondary Research
- Annual Reports
- White Paper
- Latest Press Release
- Industry Association
- Paid Database
- Investor Presentations

Step 4 - Data Triangulation
Involves using different sources of information in order to increase the validity of a study
These sources are likely to be stakeholders in a program - participants, other researchers, program staff, other community members, and so on.
Then we put all data in single framework & apply various statistical tools to find out the dynamic on the market.
During the analysis stage, feedback from the stakeholder groups would be compared to determine areas of agreement as well as areas of divergence