

Key Insights
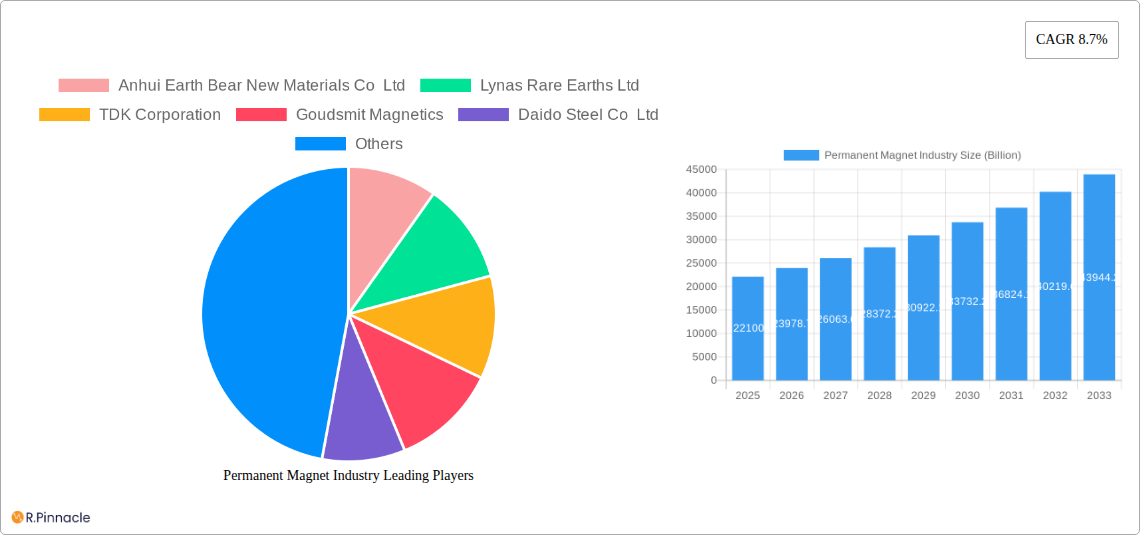
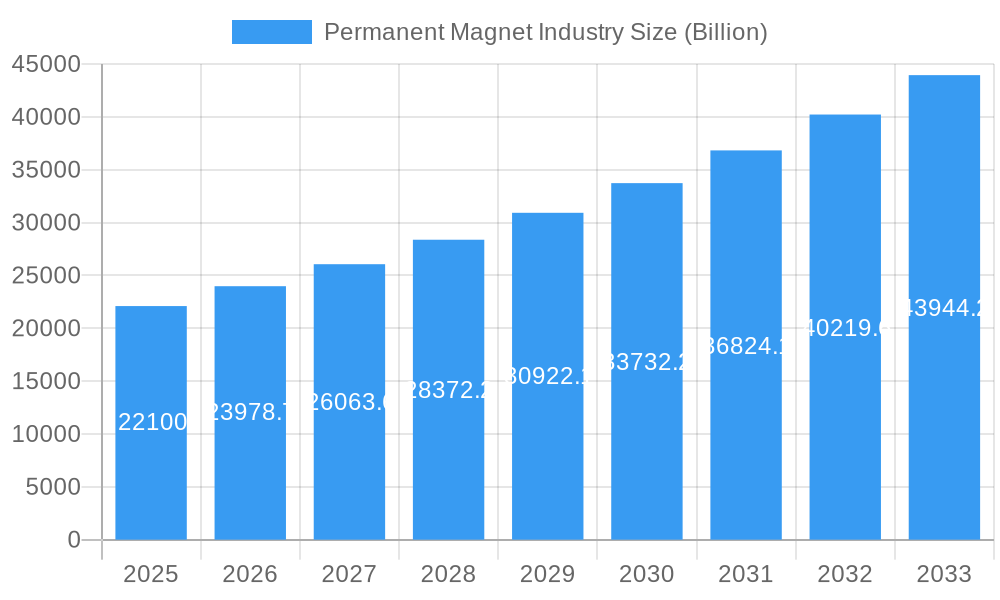
The permanent magnet industry, valued at $22.1 billion in 2025, is projected to experience robust growth, driven by a compound annual growth rate (CAGR) of 8.7% from 2025 to 2033. This expansion is fueled by several key factors. The burgeoning automotive sector, particularly electric vehicles (EVs) and hybrid electric vehicles (HEVs), represents a significant driver, with increasing demand for powerful and efficient permanent magnets in motors and generators. Simultaneously, the electronics industry's relentless pursuit of miniaturization and performance enhancement in devices like smartphones and laptops continues to fuel demand. Advancements in industrial automation, particularly robotics and industrial motors, are also contributing significantly to market growth. Furthermore, the renewable energy sector, focusing on wind turbines and solar power systems, is leveraging permanent magnets for enhanced energy conversion efficiency, adding further impetus to market expansion. The prevalent material types, including Neodymium-Iron-Boron (NdFeB) magnets known for their high performance, and Ferrite magnets appreciated for their cost-effectiveness, cater to a diverse range of applications.
Permanent Magnet Industry Market Size (In Billion)
Geographic distribution reveals a dynamic landscape. Asia-Pacific, led by China, currently holds a dominant market share due to its established manufacturing base and substantial production capabilities. North America and Europe are also significant markets, driven by strong demand from automotive and industrial sectors. However, emerging economies in regions like South America and the Middle East and Africa present promising growth opportunities as industrialization and electrification accelerate. While the industry faces challenges such as price volatility of rare earth elements and supply chain disruptions, ongoing research and development efforts focusing on alternative materials and improved manufacturing processes are poised to mitigate these restraints and ensure continued expansion of the permanent magnet market throughout the forecast period.
Permanent Magnet Industry Company Market Share
Permanent Magnet Industry Market Report: 2019-2033
This comprehensive report provides an in-depth analysis of the global permanent magnet industry, projecting a market value exceeding $XX Billion by 2033. Leveraging a robust data set spanning the historical period (2019-2024), base year (2025), and forecast period (2025-2033), this report offers crucial insights for industry professionals, investors, and strategic decision-makers. The study covers key segments, including Neodymium-Iron-Boron, Ferrite, Samarium Cobalt, and Alnico magnets, across diverse end-user industries like Automotive, Electronics, Industrial, and Power Generation.
Permanent Magnet Industry Market Structure & Innovation Trends
This section analyzes the competitive landscape of the permanent magnet industry, focusing on market concentration, innovation drivers, regulatory frameworks, and M&A activities. The report delves into the market share held by key players such as Anhui Earth Bear New Materials Co Ltd, Lynas Rare Earths Ltd, TDK Corporation, Goudsmit Magnetics, Daido Steel Co Ltd, Galaxymagnets, Hitachi Metals Ltd, Arnold Magnetic Technologies, Shin-Etsu Chemical Co Ltd, and GKN Powder Metallurgy.
- Market Concentration: The report assesses the level of market concentration, identifying potential monopolies or oligopolies and their impact on pricing and innovation. Market share data for key players will be presented.
- Innovation Drivers: Analysis of R&D investments, technological advancements (e.g., improved magnetic properties, enhanced durability), and the role of government initiatives in driving innovation.
- Regulatory Frameworks: Examination of relevant regulations impacting the industry, including those concerning rare earth element sourcing, environmental compliance, and product safety standards.
- Product Substitutes: Assessment of potential substitute materials and technologies that could challenge the dominance of permanent magnets in specific applications.
- End-User Demographics: Analysis of the demographics of end-user industries and their evolving needs driving demand for permanent magnets.
- M&A Activities: Detailed examination of recent mergers, acquisitions, and joint ventures within the industry, including deal values and their strategic implications. For example, the report will assess the impact of deals exceeding $XX Billion.
Permanent Magnet Industry Market Dynamics & Trends
This section provides a comprehensive overview of the market dynamics shaping the permanent magnet industry. It examines market growth drivers, technological disruptions, consumer preferences, and competitive dynamics, providing insights into the Compound Annual Growth Rate (CAGR) and market penetration rates for various magnet types and end-user segments. Specific details on market size, growth drivers, and technological shifts are thoroughly explored. The impact of factors like the increasing adoption of electric vehicles and renewable energy technologies on market growth will be quantified.
Dominant Regions & Segments in Permanent Magnet Industry
This section identifies the leading regions and segments within the permanent magnet industry. A detailed analysis of the dominance of specific regions and end-user industries (Automotive, Electronics, Industrial, Power Generation, Other End-user Industries) and material types (Neodymium-Iron-Boron, Ferrite, Samarium Cobalt, Alnico, Others) will be presented.
- Key Drivers by Region/Segment:
- Automotive: Growing demand for electric and hybrid vehicles.
- Electronics: Miniaturization trends in consumer electronics and increasing demand for high-performance electronics.
- Industrial: Automation and robotics, industrial motors, and sensors.
- Power Generation: Wind turbines and other renewable energy technologies.
- Neodymium-Iron-Boron: High-performance applications demanding superior magnetic properties.
- Ferrite: Cost-effectiveness and suitability for various applications.
- Samarium Cobalt: High-temperature applications and aerospace components.
- Alnico: Specific niche applications where high-temperature stability is crucial.
The report will provide a comprehensive analysis explaining the reasons behind the dominance of specific regions and segments, considering factors like economic policies, infrastructure, technological advancements, and consumer preferences.
Permanent Magnet Industry Product Innovations
This section summarizes recent product developments, applications, and competitive advantages in the permanent magnet industry. It emphasizes technological trends such as the development of high-performance magnets with improved temperature stability and enhanced magnetic properties. The analysis will consider market fit, highlighting successful innovations that have significantly impacted market share and consumer adoption.
Report Scope & Segmentation Analysis
The report covers the global permanent magnet market, segmented by end-user industry (Automotive, Electronics, Industrial, Power Generation, Other End-user Industries) and material type (Neodymium-Iron-Boron, Ferrite, Samarium Cobalt, Alnico, Others). Each segment's growth projections, market size (in billions), and competitive dynamics are analyzed. Detailed market size projections (in billions) for each segment during the forecast period are presented.
Key Drivers of Permanent Magnet Industry Growth
This section identifies and analyzes the key drivers contributing to the growth of the permanent magnet industry. Factors such as technological advancements, economic growth, and supportive government policies are examined. The impact of each driver on market expansion is quantified.
Challenges in the Permanent Magnet Industry Sector
This section discusses barriers and restraints impacting the growth of the permanent magnet industry. The analysis covers supply chain vulnerabilities, regulatory hurdles, and competitive pressures, quantifying their negative impact on market growth.
Emerging Opportunities in Permanent Magnet Industry
This section highlights emerging opportunities in the permanent magnet market, including the expansion into new applications and the development of innovative technologies. Opportunities presented by new markets and advancements in material science are explored.
Leading Players in the Permanent Magnet Industry Market
Key Developments in Permanent Magnet Industry Industry
- July 2022: GKN Powder Metallurgy announced plans to invest in a facility to produce up to 4,000 tons of permanent magnets per year for the EV market by 2024. This signifies a significant expansion in the supply of permanent magnets for the rapidly growing EV sector.
- September 2022: Solvay's expansion of its rare earths operations in La Rochelle, France, aims to strengthen the European supply chain for rare earth permanent magnets, supporting the growth of wind power, electric vehicles, and electronics markets within Europe.
Future Outlook for Permanent Magnet Industry Market
The future of the permanent magnet industry looks promising, driven by the continued growth of electric vehicles, renewable energy technologies, and the increasing demand for high-performance magnets in various applications. Strategic opportunities exist for companies that can innovate in material science, optimize supply chains, and develop sustainable manufacturing processes. The market is poised for significant expansion, with continued growth expected throughout the forecast period.
Permanent Magnet Industry Segmentation
-
1. Material Type
- 1.1. Neodymium-Iron-Boron
- 1.2. Ferrite
- 1.3. Samarium Cobalt
- 1.4. Alnico
-
2. End-user Industry
- 2.1. Automotive
- 2.2. Electronics
- 2.3. Industrial
- 2.4. Power Generation
- 2.5. Other End-user Industries
Permanent Magnet Industry Segmentation By Geography
-
1. Asia Pacific
- 1.1. China
- 1.2. India
- 1.3. Japan
- 1.4. South Korea
- 1.5. Rest of Asia Pacific
-
2. North America
- 2.1. United States
- 2.2. Canada
- 2.3. Mexico
-
3. Europe
- 3.1. Germany
- 3.2. United Kingdom
- 3.3. France
- 3.4. Italy
- 3.5. Rest of Europe
-
4. South America
- 4.1. Brazil
- 4.2. Argentina
- 4.3. Rest of South America
-
5. Middle East and Africa
- 5.1. Saudi Arabia
- 5.2. South Africa
- 5.3. Rest of Middle East and Africa
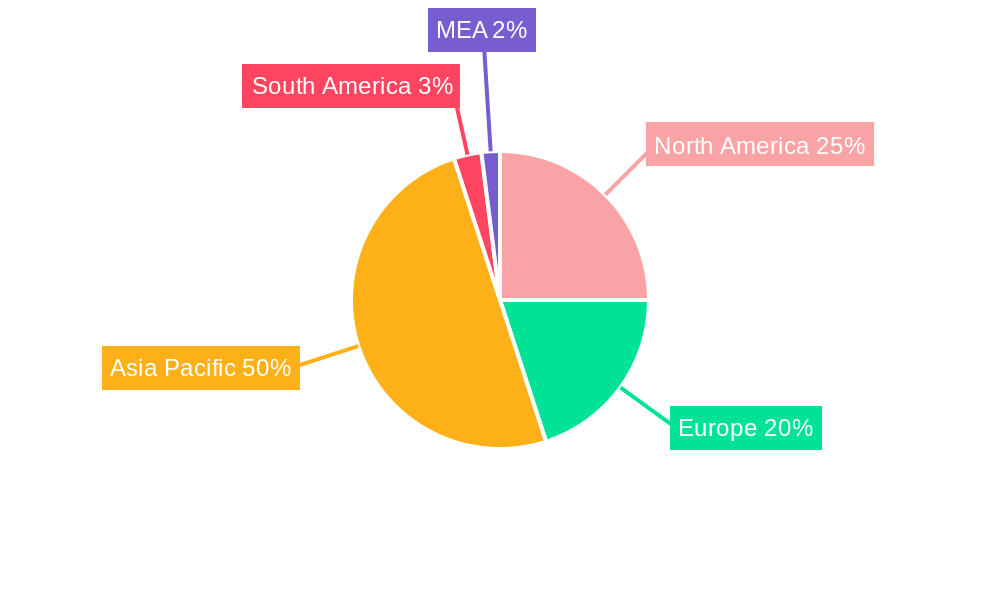
Permanent Magnet Industry Regional Market Share
Geographic Coverage of Permanent Magnet Industry
Permanent Magnet Industry REPORT HIGHLIGHTS
| Aspects | Details |
|---|---|
| Study Period | 2020-2034 |
| Base Year | 2025 |
| Estimated Year | 2026 |
| Forecast Period | 2026-2034 |
| Historical Period | 2020-2025 |
| Growth Rate | CAGR of 8.7% from 2020-2034 |
| Segmentation |
|
Table of Contents
- 1. Introduction
- 1.1. Research Scope
- 1.2. Market Segmentation
- 1.3. Research Objective
- 1.4. Definitions and Assumptions
- 2. Executive Summary
- 2.1. Market Snapshot
- 3. Market Dynamics
- 3.1. Market Drivers
- 3.2. Market Restrains
- 3.3. Market Trends
- 3.4. Market Opportunities
- 4. Market Factor Analysis
- 4.1. Porters Five Forces
- 4.1.1. Bargaining Power of Suppliers
- 4.1.2. Bargaining Power of Buyers
- 4.1.3. Threat of New Entrants
- 4.1.4. Threat of Substitutes
- 4.1.5. Competitive Rivalry
- 4.2. PESTEL analysis
- 4.3. BCG Analysis
- 4.3.1. Stars (High Growth, High Market Share)
- 4.3.2. Cash Cows (Low Growth, High Market Share)
- 4.3.3. Question Mark (High Growth, Low Market Share)
- 4.3.4. Dogs (Low Growth, Low Market Share)
- 4.4. Ansoff Matrix Analysis
- 4.5. Supply Chain Analysis
- 4.6. Regulatory Landscape
- 4.7. Current Market Potential and Opportunity Assessment (TAM–SAM–SOM Framework)
- 4.8. PRI Analyst Note
- 4.1. Porters Five Forces
- 5. Market Analysis, Insights and Forecast 2021-2033
- 5.1. Market Analysis, Insights and Forecast - by Material Type
- 5.1.1. Neodymium-Iron-Boron
- 5.1.2. Ferrite
- 5.1.3. Samarium Cobalt
- 5.1.4. Alnico
- 5.2. Market Analysis, Insights and Forecast - by End-user Industry
- 5.2.1. Automotive
- 5.2.2. Electronics
- 5.2.3. Industrial
- 5.2.4. Power Generation
- 5.2.5. Other End-user Industries
- 5.3. Market Analysis, Insights and Forecast - by Region
- 5.3.1. Asia Pacific
- 5.3.2. North America
- 5.3.3. Europe
- 5.3.4. South America
- 5.3.5. Middle East and Africa
- 5.1. Market Analysis, Insights and Forecast - by Material Type
- 6. Global Permanent Magnet Industry Analysis, Insights and Forecast, 2021-2033
- 6.1. Market Analysis, Insights and Forecast - by Material Type
- 6.1.1. Neodymium-Iron-Boron
- 6.1.2. Ferrite
- 6.1.3. Samarium Cobalt
- 6.1.4. Alnico
- 6.2. Market Analysis, Insights and Forecast - by End-user Industry
- 6.2.1. Automotive
- 6.2.2. Electronics
- 6.2.3. Industrial
- 6.2.4. Power Generation
- 6.2.5. Other End-user Industries
- 6.1. Market Analysis, Insights and Forecast - by Material Type
- 7. Asia Pacific Permanent Magnet Industry Analysis, Insights and Forecast, 2020-2032
- 7.1. Market Analysis, Insights and Forecast - by Material Type
- 7.1.1. Neodymium-Iron-Boron
- 7.1.2. Ferrite
- 7.1.3. Samarium Cobalt
- 7.1.4. Alnico
- 7.2. Market Analysis, Insights and Forecast - by End-user Industry
- 7.2.1. Automotive
- 7.2.2. Electronics
- 7.2.3. Industrial
- 7.2.4. Power Generation
- 7.2.5. Other End-user Industries
- 7.1. Market Analysis, Insights and Forecast - by Material Type
- 8. North America Permanent Magnet Industry Analysis, Insights and Forecast, 2020-2032
- 8.1. Market Analysis, Insights and Forecast - by Material Type
- 8.1.1. Neodymium-Iron-Boron
- 8.1.2. Ferrite
- 8.1.3. Samarium Cobalt
- 8.1.4. Alnico
- 8.2. Market Analysis, Insights and Forecast - by End-user Industry
- 8.2.1. Automotive
- 8.2.2. Electronics
- 8.2.3. Industrial
- 8.2.4. Power Generation
- 8.2.5. Other End-user Industries
- 8.1. Market Analysis, Insights and Forecast - by Material Type
- 9. Europe Permanent Magnet Industry Analysis, Insights and Forecast, 2020-2032
- 9.1. Market Analysis, Insights and Forecast - by Material Type
- 9.1.1. Neodymium-Iron-Boron
- 9.1.2. Ferrite
- 9.1.3. Samarium Cobalt
- 9.1.4. Alnico
- 9.2. Market Analysis, Insights and Forecast - by End-user Industry
- 9.2.1. Automotive
- 9.2.2. Electronics
- 9.2.3. Industrial
- 9.2.4. Power Generation
- 9.2.5. Other End-user Industries
- 9.1. Market Analysis, Insights and Forecast - by Material Type
- 10. South America Permanent Magnet Industry Analysis, Insights and Forecast, 2020-2032
- 10.1. Market Analysis, Insights and Forecast - by Material Type
- 10.1.1. Neodymium-Iron-Boron
- 10.1.2. Ferrite
- 10.1.3. Samarium Cobalt
- 10.1.4. Alnico
- 10.2. Market Analysis, Insights and Forecast - by End-user Industry
- 10.2.1. Automotive
- 10.2.2. Electronics
- 10.2.3. Industrial
- 10.2.4. Power Generation
- 10.2.5. Other End-user Industries
- 10.1. Market Analysis, Insights and Forecast - by Material Type
- 11. Middle East and Africa Permanent Magnet Industry Analysis, Insights and Forecast, 2020-2032
- 11.1. Market Analysis, Insights and Forecast - by Material Type
- 11.1.1. Neodymium-Iron-Boron
- 11.1.2. Ferrite
- 11.1.3. Samarium Cobalt
- 11.1.4. Alnico
- 11.2. Market Analysis, Insights and Forecast - by End-user Industry
- 11.2.1. Automotive
- 11.2.2. Electronics
- 11.2.3. Industrial
- 11.2.4. Power Generation
- 11.2.5. Other End-user Industries
- 11.1. Market Analysis, Insights and Forecast - by Material Type
- 12. Competitive Analysis
- 12.1. Company Profiles
- 12.1.1 Anhui Earth Bear New Materials Co Ltd
- 12.1.1.1. Company Overview
- 12.1.1.2. Products
- 12.1.1.3. Company Financials
- 12.1.1.4. SWOT Analysis
- 12.1.2 Lynas Rare Earths Ltd
- 12.1.2.1. Company Overview
- 12.1.2.2. Products
- 12.1.2.3. Company Financials
- 12.1.2.4. SWOT Analysis
- 12.1.3 TDK Corporation
- 12.1.3.1. Company Overview
- 12.1.3.2. Products
- 12.1.3.3. Company Financials
- 12.1.3.4. SWOT Analysis
- 12.1.4 Goudsmit Magnetics
- 12.1.4.1. Company Overview
- 12.1.4.2. Products
- 12.1.4.3. Company Financials
- 12.1.4.4. SWOT Analysis
- 12.1.5 Daido Steel Co Ltd
- 12.1.5.1. Company Overview
- 12.1.5.2. Products
- 12.1.5.3. Company Financials
- 12.1.5.4. SWOT Analysis
- 12.1.6 Galaxymagnets
- 12.1.6.1. Company Overview
- 12.1.6.2. Products
- 12.1.6.3. Company Financials
- 12.1.6.4. SWOT Analysis
- 12.1.7 Hitachi Metals Ltd
- 12.1.7.1. Company Overview
- 12.1.7.2. Products
- 12.1.7.3. Company Financials
- 12.1.7.4. SWOT Analysis
- 12.1.8 Arnold Magnetic Technologies
- 12.1.8.1. Company Overview
- 12.1.8.2. Products
- 12.1.8.3. Company Financials
- 12.1.8.4. SWOT Analysis
- 12.1.9 Shin-Etsu Chemical Co Ltd
- 12.1.9.1. Company Overview
- 12.1.9.2. Products
- 12.1.9.3. Company Financials
- 12.1.9.4. SWOT Analysis
- 12.1.10 GKN Powder Metallurgy
- 12.1.10.1. Company Overview
- 12.1.10.2. Products
- 12.1.10.3. Company Financials
- 12.1.10.4. SWOT Analysis
- 12.1.1 Anhui Earth Bear New Materials Co Ltd
- 12.2. Market Entropy
- 12.2.1 Company's Key Areas Served
- 12.2.2 Recent Developments
- 12.3. Company Market Share Analysis 2025
- 12.3.1 Top 5 Companies Market Share Analysis
- 12.3.2 Top 3 Companies Market Share Analysis
- 12.4. List of Potential Customers
- 13. Research Methodology
List of Figures
- Figure 1: Global Permanent Magnet Industry Revenue Breakdown (Billion, %) by Region 2025 & 2033
- Figure 2: Global Permanent Magnet Industry Volume Breakdown (K Tons, %) by Region 2025 & 2033
- Figure 3: Asia Pacific Permanent Magnet Industry Revenue (Billion), by Material Type 2025 & 2033
- Figure 4: Asia Pacific Permanent Magnet Industry Volume (K Tons), by Material Type 2025 & 2033
- Figure 5: Asia Pacific Permanent Magnet Industry Revenue Share (%), by Material Type 2025 & 2033
- Figure 6: Asia Pacific Permanent Magnet Industry Volume Share (%), by Material Type 2025 & 2033
- Figure 7: Asia Pacific Permanent Magnet Industry Revenue (Billion), by End-user Industry 2025 & 2033
- Figure 8: Asia Pacific Permanent Magnet Industry Volume (K Tons), by End-user Industry 2025 & 2033
- Figure 9: Asia Pacific Permanent Magnet Industry Revenue Share (%), by End-user Industry 2025 & 2033
- Figure 10: Asia Pacific Permanent Magnet Industry Volume Share (%), by End-user Industry 2025 & 2033
- Figure 11: Asia Pacific Permanent Magnet Industry Revenue (Billion), by Country 2025 & 2033
- Figure 12: Asia Pacific Permanent Magnet Industry Volume (K Tons), by Country 2025 & 2033
- Figure 13: Asia Pacific Permanent Magnet Industry Revenue Share (%), by Country 2025 & 2033
- Figure 14: Asia Pacific Permanent Magnet Industry Volume Share (%), by Country 2025 & 2033
- Figure 15: North America Permanent Magnet Industry Revenue (Billion), by Material Type 2025 & 2033
- Figure 16: North America Permanent Magnet Industry Volume (K Tons), by Material Type 2025 & 2033
- Figure 17: North America Permanent Magnet Industry Revenue Share (%), by Material Type 2025 & 2033
- Figure 18: North America Permanent Magnet Industry Volume Share (%), by Material Type 2025 & 2033
- Figure 19: North America Permanent Magnet Industry Revenue (Billion), by End-user Industry 2025 & 2033
- Figure 20: North America Permanent Magnet Industry Volume (K Tons), by End-user Industry 2025 & 2033
- Figure 21: North America Permanent Magnet Industry Revenue Share (%), by End-user Industry 2025 & 2033
- Figure 22: North America Permanent Magnet Industry Volume Share (%), by End-user Industry 2025 & 2033
- Figure 23: North America Permanent Magnet Industry Revenue (Billion), by Country 2025 & 2033
- Figure 24: North America Permanent Magnet Industry Volume (K Tons), by Country 2025 & 2033
- Figure 25: North America Permanent Magnet Industry Revenue Share (%), by Country 2025 & 2033
- Figure 26: North America Permanent Magnet Industry Volume Share (%), by Country 2025 & 2033
- Figure 27: Europe Permanent Magnet Industry Revenue (Billion), by Material Type 2025 & 2033
- Figure 28: Europe Permanent Magnet Industry Volume (K Tons), by Material Type 2025 & 2033
- Figure 29: Europe Permanent Magnet Industry Revenue Share (%), by Material Type 2025 & 2033
- Figure 30: Europe Permanent Magnet Industry Volume Share (%), by Material Type 2025 & 2033
- Figure 31: Europe Permanent Magnet Industry Revenue (Billion), by End-user Industry 2025 & 2033
- Figure 32: Europe Permanent Magnet Industry Volume (K Tons), by End-user Industry 2025 & 2033
- Figure 33: Europe Permanent Magnet Industry Revenue Share (%), by End-user Industry 2025 & 2033
- Figure 34: Europe Permanent Magnet Industry Volume Share (%), by End-user Industry 2025 & 2033
- Figure 35: Europe Permanent Magnet Industry Revenue (Billion), by Country 2025 & 2033
- Figure 36: Europe Permanent Magnet Industry Volume (K Tons), by Country 2025 & 2033
- Figure 37: Europe Permanent Magnet Industry Revenue Share (%), by Country 2025 & 2033
- Figure 38: Europe Permanent Magnet Industry Volume Share (%), by Country 2025 & 2033
- Figure 39: South America Permanent Magnet Industry Revenue (Billion), by Material Type 2025 & 2033
- Figure 40: South America Permanent Magnet Industry Volume (K Tons), by Material Type 2025 & 2033
- Figure 41: South America Permanent Magnet Industry Revenue Share (%), by Material Type 2025 & 2033
- Figure 42: South America Permanent Magnet Industry Volume Share (%), by Material Type 2025 & 2033
- Figure 43: South America Permanent Magnet Industry Revenue (Billion), by End-user Industry 2025 & 2033
- Figure 44: South America Permanent Magnet Industry Volume (K Tons), by End-user Industry 2025 & 2033
- Figure 45: South America Permanent Magnet Industry Revenue Share (%), by End-user Industry 2025 & 2033
- Figure 46: South America Permanent Magnet Industry Volume Share (%), by End-user Industry 2025 & 2033
- Figure 47: South America Permanent Magnet Industry Revenue (Billion), by Country 2025 & 2033
- Figure 48: South America Permanent Magnet Industry Volume (K Tons), by Country 2025 & 2033
- Figure 49: South America Permanent Magnet Industry Revenue Share (%), by Country 2025 & 2033
- Figure 50: South America Permanent Magnet Industry Volume Share (%), by Country 2025 & 2033
- Figure 51: Middle East and Africa Permanent Magnet Industry Revenue (Billion), by Material Type 2025 & 2033
- Figure 52: Middle East and Africa Permanent Magnet Industry Volume (K Tons), by Material Type 2025 & 2033
- Figure 53: Middle East and Africa Permanent Magnet Industry Revenue Share (%), by Material Type 2025 & 2033
- Figure 54: Middle East and Africa Permanent Magnet Industry Volume Share (%), by Material Type 2025 & 2033
- Figure 55: Middle East and Africa Permanent Magnet Industry Revenue (Billion), by End-user Industry 2025 & 2033
- Figure 56: Middle East and Africa Permanent Magnet Industry Volume (K Tons), by End-user Industry 2025 & 2033
- Figure 57: Middle East and Africa Permanent Magnet Industry Revenue Share (%), by End-user Industry 2025 & 2033
- Figure 58: Middle East and Africa Permanent Magnet Industry Volume Share (%), by End-user Industry 2025 & 2033
- Figure 59: Middle East and Africa Permanent Magnet Industry Revenue (Billion), by Country 2025 & 2033
- Figure 60: Middle East and Africa Permanent Magnet Industry Volume (K Tons), by Country 2025 & 2033
- Figure 61: Middle East and Africa Permanent Magnet Industry Revenue Share (%), by Country 2025 & 2033
- Figure 62: Middle East and Africa Permanent Magnet Industry Volume Share (%), by Country 2025 & 2033
List of Tables
- Table 1: Global Permanent Magnet Industry Revenue Billion Forecast, by Material Type 2020 & 2033
- Table 2: Global Permanent Magnet Industry Volume K Tons Forecast, by Material Type 2020 & 2033
- Table 3: Global Permanent Magnet Industry Revenue Billion Forecast, by End-user Industry 2020 & 2033
- Table 4: Global Permanent Magnet Industry Volume K Tons Forecast, by End-user Industry 2020 & 2033
- Table 5: Global Permanent Magnet Industry Revenue Billion Forecast, by Region 2020 & 2033
- Table 6: Global Permanent Magnet Industry Volume K Tons Forecast, by Region 2020 & 2033
- Table 7: Global Permanent Magnet Industry Revenue Billion Forecast, by Material Type 2020 & 2033
- Table 8: Global Permanent Magnet Industry Volume K Tons Forecast, by Material Type 2020 & 2033
- Table 9: Global Permanent Magnet Industry Revenue Billion Forecast, by End-user Industry 2020 & 2033
- Table 10: Global Permanent Magnet Industry Volume K Tons Forecast, by End-user Industry 2020 & 2033
- Table 11: Global Permanent Magnet Industry Revenue Billion Forecast, by Country 2020 & 2033
- Table 12: Global Permanent Magnet Industry Volume K Tons Forecast, by Country 2020 & 2033
- Table 13: China Permanent Magnet Industry Revenue (Billion) Forecast, by Application 2020 & 2033
- Table 14: China Permanent Magnet Industry Volume (K Tons) Forecast, by Application 2020 & 2033
- Table 15: India Permanent Magnet Industry Revenue (Billion) Forecast, by Application 2020 & 2033
- Table 16: India Permanent Magnet Industry Volume (K Tons) Forecast, by Application 2020 & 2033
- Table 17: Japan Permanent Magnet Industry Revenue (Billion) Forecast, by Application 2020 & 2033
- Table 18: Japan Permanent Magnet Industry Volume (K Tons) Forecast, by Application 2020 & 2033
- Table 19: South Korea Permanent Magnet Industry Revenue (Billion) Forecast, by Application 2020 & 2033
- Table 20: South Korea Permanent Magnet Industry Volume (K Tons) Forecast, by Application 2020 & 2033
- Table 21: Rest of Asia Pacific Permanent Magnet Industry Revenue (Billion) Forecast, by Application 2020 & 2033
- Table 22: Rest of Asia Pacific Permanent Magnet Industry Volume (K Tons) Forecast, by Application 2020 & 2033
- Table 23: Global Permanent Magnet Industry Revenue Billion Forecast, by Material Type 2020 & 2033
- Table 24: Global Permanent Magnet Industry Volume K Tons Forecast, by Material Type 2020 & 2033
- Table 25: Global Permanent Magnet Industry Revenue Billion Forecast, by End-user Industry 2020 & 2033
- Table 26: Global Permanent Magnet Industry Volume K Tons Forecast, by End-user Industry 2020 & 2033
- Table 27: Global Permanent Magnet Industry Revenue Billion Forecast, by Country 2020 & 2033
- Table 28: Global Permanent Magnet Industry Volume K Tons Forecast, by Country 2020 & 2033
- Table 29: United States Permanent Magnet Industry Revenue (Billion) Forecast, by Application 2020 & 2033
- Table 30: United States Permanent Magnet Industry Volume (K Tons) Forecast, by Application 2020 & 2033
- Table 31: Canada Permanent Magnet Industry Revenue (Billion) Forecast, by Application 2020 & 2033
- Table 32: Canada Permanent Magnet Industry Volume (K Tons) Forecast, by Application 2020 & 2033
- Table 33: Mexico Permanent Magnet Industry Revenue (Billion) Forecast, by Application 2020 & 2033
- Table 34: Mexico Permanent Magnet Industry Volume (K Tons) Forecast, by Application 2020 & 2033
- Table 35: Global Permanent Magnet Industry Revenue Billion Forecast, by Material Type 2020 & 2033
- Table 36: Global Permanent Magnet Industry Volume K Tons Forecast, by Material Type 2020 & 2033
- Table 37: Global Permanent Magnet Industry Revenue Billion Forecast, by End-user Industry 2020 & 2033
- Table 38: Global Permanent Magnet Industry Volume K Tons Forecast, by End-user Industry 2020 & 2033
- Table 39: Global Permanent Magnet Industry Revenue Billion Forecast, by Country 2020 & 2033
- Table 40: Global Permanent Magnet Industry Volume K Tons Forecast, by Country 2020 & 2033
- Table 41: Germany Permanent Magnet Industry Revenue (Billion) Forecast, by Application 2020 & 2033
- Table 42: Germany Permanent Magnet Industry Volume (K Tons) Forecast, by Application 2020 & 2033
- Table 43: United Kingdom Permanent Magnet Industry Revenue (Billion) Forecast, by Application 2020 & 2033
- Table 44: United Kingdom Permanent Magnet Industry Volume (K Tons) Forecast, by Application 2020 & 2033
- Table 45: France Permanent Magnet Industry Revenue (Billion) Forecast, by Application 2020 & 2033
- Table 46: France Permanent Magnet Industry Volume (K Tons) Forecast, by Application 2020 & 2033
- Table 47: Italy Permanent Magnet Industry Revenue (Billion) Forecast, by Application 2020 & 2033
- Table 48: Italy Permanent Magnet Industry Volume (K Tons) Forecast, by Application 2020 & 2033
- Table 49: Rest of Europe Permanent Magnet Industry Revenue (Billion) Forecast, by Application 2020 & 2033
- Table 50: Rest of Europe Permanent Magnet Industry Volume (K Tons) Forecast, by Application 2020 & 2033
- Table 51: Global Permanent Magnet Industry Revenue Billion Forecast, by Material Type 2020 & 2033
- Table 52: Global Permanent Magnet Industry Volume K Tons Forecast, by Material Type 2020 & 2033
- Table 53: Global Permanent Magnet Industry Revenue Billion Forecast, by End-user Industry 2020 & 2033
- Table 54: Global Permanent Magnet Industry Volume K Tons Forecast, by End-user Industry 2020 & 2033
- Table 55: Global Permanent Magnet Industry Revenue Billion Forecast, by Country 2020 & 2033
- Table 56: Global Permanent Magnet Industry Volume K Tons Forecast, by Country 2020 & 2033
- Table 57: Brazil Permanent Magnet Industry Revenue (Billion) Forecast, by Application 2020 & 2033
- Table 58: Brazil Permanent Magnet Industry Volume (K Tons) Forecast, by Application 2020 & 2033
- Table 59: Argentina Permanent Magnet Industry Revenue (Billion) Forecast, by Application 2020 & 2033
- Table 60: Argentina Permanent Magnet Industry Volume (K Tons) Forecast, by Application 2020 & 2033
- Table 61: Rest of South America Permanent Magnet Industry Revenue (Billion) Forecast, by Application 2020 & 2033
- Table 62: Rest of South America Permanent Magnet Industry Volume (K Tons) Forecast, by Application 2020 & 2033
- Table 63: Global Permanent Magnet Industry Revenue Billion Forecast, by Material Type 2020 & 2033
- Table 64: Global Permanent Magnet Industry Volume K Tons Forecast, by Material Type 2020 & 2033
- Table 65: Global Permanent Magnet Industry Revenue Billion Forecast, by End-user Industry 2020 & 2033
- Table 66: Global Permanent Magnet Industry Volume K Tons Forecast, by End-user Industry 2020 & 2033
- Table 67: Global Permanent Magnet Industry Revenue Billion Forecast, by Country 2020 & 2033
- Table 68: Global Permanent Magnet Industry Volume K Tons Forecast, by Country 2020 & 2033
- Table 69: Saudi Arabia Permanent Magnet Industry Revenue (Billion) Forecast, by Application 2020 & 2033
- Table 70: Saudi Arabia Permanent Magnet Industry Volume (K Tons) Forecast, by Application 2020 & 2033
- Table 71: South Africa Permanent Magnet Industry Revenue (Billion) Forecast, by Application 2020 & 2033
- Table 72: South Africa Permanent Magnet Industry Volume (K Tons) Forecast, by Application 2020 & 2033
- Table 73: Rest of Middle East and Africa Permanent Magnet Industry Revenue (Billion) Forecast, by Application 2020 & 2033
- Table 74: Rest of Middle East and Africa Permanent Magnet Industry Volume (K Tons) Forecast, by Application 2020 & 2033
Frequently Asked Questions
1. What is the projected Compound Annual Growth Rate (CAGR) of the Permanent Magnet Industry?
The projected CAGR is approximately 8.7%.
2. Which companies are prominent players in the Permanent Magnet Industry?
Key companies in the market include Anhui Earth Bear New Materials Co Ltd, Lynas Rare Earths Ltd, TDK Corporation, Goudsmit Magnetics, Daido Steel Co Ltd, Galaxymagnets, Hitachi Metals Ltd, Arnold Magnetic Technologies, Shin-Etsu Chemical Co Ltd, GKN Powder Metallurgy.
3. What are the main segments of the Permanent Magnet Industry?
The market segments include Material Type, End-user Industry.
4. Can you provide details about the market size?
The market size is estimated to be USD 22.1 Billion as of 2022.
5. What are some drivers contributing to market growth?
Increasing Electro-mechanical Applications; Other Drivers.
6. What are the notable trends driving market growth?
Growing Demand from Electronics Industry.
7. Are there any restraints impacting market growth?
Competition from Substitutes; Other Restraints.
8. Can you provide examples of recent developments in the market?
September 2022: Solvay announced plans to expand its rare earths operations in La Rochelle, France to enter the value chain for rare earths permanent magnets in Europe and serve customers in the wind power, electric vehicles, and electronics markets.
9. What pricing options are available for accessing the report?
Pricing options include single-user, multi-user, and enterprise licenses priced at USD 4750, USD 5250, and USD 8750 respectively.
10. Is the market size provided in terms of value or volume?
The market size is provided in terms of value, measured in Billion and volume, measured in K Tons.
11. Are there any specific market keywords associated with the report?
Yes, the market keyword associated with the report is "Permanent Magnet Industry," which aids in identifying and referencing the specific market segment covered.
12. How do I determine which pricing option suits my needs best?
The pricing options vary based on user requirements and access needs. Individual users may opt for single-user licenses, while businesses requiring broader access may choose multi-user or enterprise licenses for cost-effective access to the report.
13. Are there any additional resources or data provided in the Permanent Magnet Industry report?
While the report offers comprehensive insights, it's advisable to review the specific contents or supplementary materials provided to ascertain if additional resources or data are available.
14. How can I stay updated on further developments or reports in the Permanent Magnet Industry?
To stay informed about further developments, trends, and reports in the Permanent Magnet Industry, consider subscribing to industry newsletters, following relevant companies and organizations, or regularly checking reputable industry news sources and publications.
Methodology
Step 1 - Identification of Relevant Samples Size from Population Database


Step 2 - Approaches for Defining Global Market Size (Value, Volume* & Price*)

Note*: In applicable scenarios
Step 3 - Data Sources
Primary Research
- Web Analytics
- Survey Reports
- Research Institute
- Latest Research Reports
- Opinion Leaders
Secondary Research
- Annual Reports
- White Paper
- Latest Press Release
- Industry Association
- Paid Database
- Investor Presentations

Step 4 - Data Triangulation
Involves using different sources of information in order to increase the validity of a study
These sources are likely to be stakeholders in a program - participants, other researchers, program staff, other community members, and so on.
Then we put all data in single framework & apply various statistical tools to find out the dynamic on the market.
During the analysis stage, feedback from the stakeholder groups would be compared to determine areas of agreement as well as areas of divergence