

Key Insights
The Petroleum Refining & Chemicals Catalysts market is poised for significant expansion, driven by escalating demand for refined petroleum products and the robust growth of the global petrochemical sector. Projected at a Compound Annual Growth Rate (CAGR) of 4.3%, the market is anticipated to reach a valuation of $10096.57 million by 2025. Key growth catalysts include stringent environmental regulations mandating cleaner fuel production, necessitating advanced catalysts for emission control. Concurrently, the surging demand for plastics, polymers, and other chemical intermediates underscores the need for highly efficient and selective catalysts in chemical synthesis. Market segmentation reveals petroleum refining as a primary application, with isomerization and synthesis gas processes being significant sub-segments requiring specialized catalysts. The materials landscape is dominated by metals and organometallic catalysts, emphasizing advancements in materials science. Aluminosilicates and molecular sieves are prominent within their respective material categories, valued for their catalytic efficacy and cost-effectiveness. Geographically, the Asia Pacific region, particularly China and India, is expected to lead growth due to industrialization and expanding refining capacities. North America and Europe remain key markets, supported by mature petrochemical industries and ongoing technological innovation. Market challenges include fluctuating crude oil prices and potential supply chain disruptions. However, continuous research and development focused on enhancing catalyst efficiency, selectivity, and longevity are expected to overcome these hurdles and ensure sustained market growth.
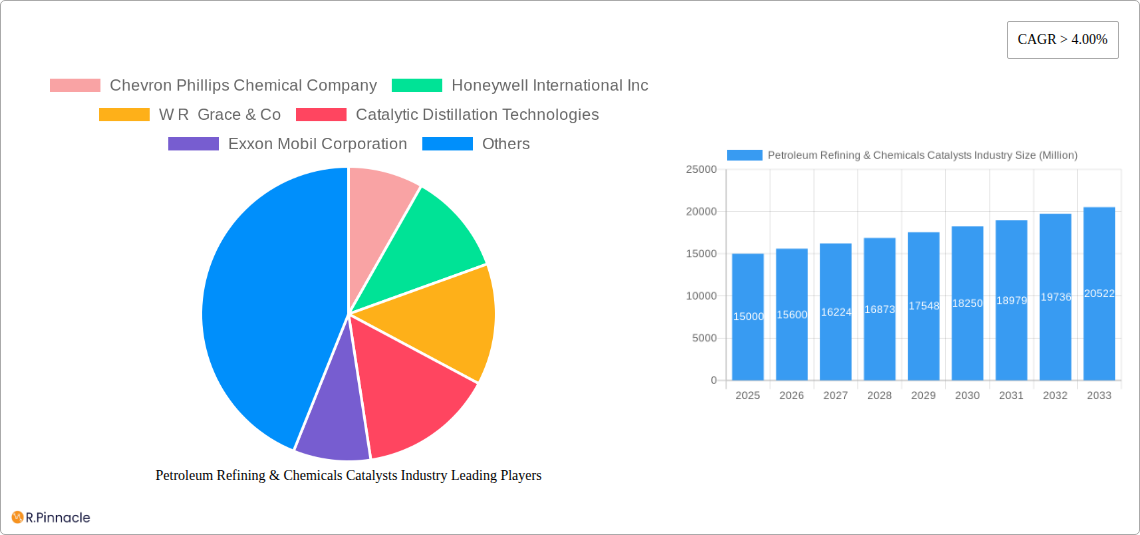
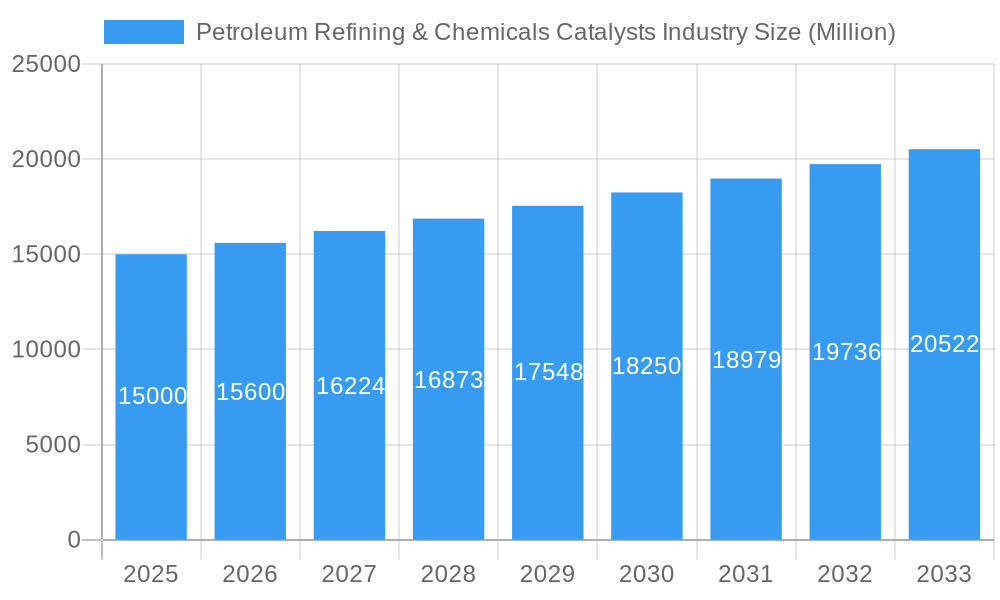
Petroleum Refining & Chemicals Catalysts Industry Market Size (In Billion)
Competitive dynamics within the Petroleum Refining & Chemicals Catalysts market are intense, with industry leaders such as Chevron Phillips Chemical Company, Honeywell International Inc., and ExxonMobil Corporation holding substantial market influence. These entities are dedicated to pioneering superior catalysts with improved performance attributes. The presence of numerous specialized smaller firms further contributes to the market's vibrant nature. Strategic initiatives, including mergers, acquisitions, and significant investments in research and development, highlight the industry's commitment to innovation and expansion. Future market trajectory will be shaped by technological advancements driving more efficient and sustainable catalyst solutions, alongside evolving regulatory frameworks promoting eco-friendly production processes. Emerging markets in Asia Pacific and the Middle East present significant opportunities for market expansion. The market size in 2025 is estimated at $10096.57 million, serving as a foundation for future growth projections based on the forecasted CAGR.
Petroleum Refining & Chemicals Catalysts Industry Company Market Share
Petroleum Refining & Chemicals Catalysts Industry Report: 2019-2033
This comprehensive report provides an in-depth analysis of the Petroleum Refining & Chemicals Catalysts industry, offering valuable insights for industry professionals, investors, and strategic decision-makers. The report covers the period from 2019 to 2033, with a focus on the forecast period from 2025 to 2033 and a base year of 2025. The market is segmented by application (Petroleum Refining, Isomerization, Synthesis Gas Processes, Polymerization), material (Metals and Organometallic Catalysts, Metallic Compounds, Aluminosilicates, Molecular Sieves, Other Chemical Compounds), and geography. Key players like Chevron Phillips Chemical Company, Honeywell International Inc., and BASF SE are analyzed to understand their strategies and market share. The report projects a market size of xx Million by 2033.
Petroleum Refining & Chemicals Catalysts Industry Market Structure & Innovation Trends
This section analyzes the competitive landscape of the petroleum refining and chemicals catalysts industry, encompassing market concentration, innovation drivers, regulatory frameworks, product substitutes, end-user demographics, and M&A activities. The industry exhibits moderate concentration, with several large players holding significant market share. For instance, Chevron Phillips Chemical Company and Honeywell International Inc. likely command a significant portion, while numerous smaller specialized firms cater to niche segments. Innovation is driven by stringent environmental regulations pushing for cleaner processes, the need for higher efficiency and yield in refining, and the growing demand for specific chemicals for various applications.
- Market Share: The top 5 players likely hold approximately xx% of the global market share in 2025.
- M&A Activity: The industry has witnessed xx Million in M&A deals in the historical period (2019-2024), primarily focused on expanding product portfolios and geographical reach. Consolidation is expected to continue at a moderate pace.
- Regulatory Framework: Stringent emission norms and safety regulations influence catalyst innovation, driving the development of more environmentally friendly and efficient catalysts.
- Product Substitutes: While direct substitutes are limited, advancements in process technologies occasionally present alternative solutions, though catalysts remain a crucial component.
- End-User Demographics: The primary end-users are large petroleum refineries, petrochemical companies, and chemical producers, with varying needs based on their specific processes and product output.
Petroleum Refining & Chemicals Catalysts Industry Market Dynamics & Trends
The Petroleum Refining & Chemicals Catalysts market is experiencing robust growth, driven by several key factors. The global CAGR is estimated at xx% during the forecast period (2025-2033). Increased demand from the petrochemical sector, fueled by rising consumption of plastics and other chemical products, is a significant growth driver. Technological advancements in catalyst design, enabling higher activity, selectivity, and longevity, also contribute to market expansion. Market penetration of advanced catalysts is increasing, particularly in regions with stringent environmental regulations. Competitive dynamics are characterized by both intense rivalry among established players and the emergence of innovative entrants. This leads to continuous product improvement, price adjustments and strategic partnerships. The market is also influenced by fluctuating raw material prices and energy costs.
Dominant Regions & Segments in Petroleum Refining & Chemicals Catalysts Industry
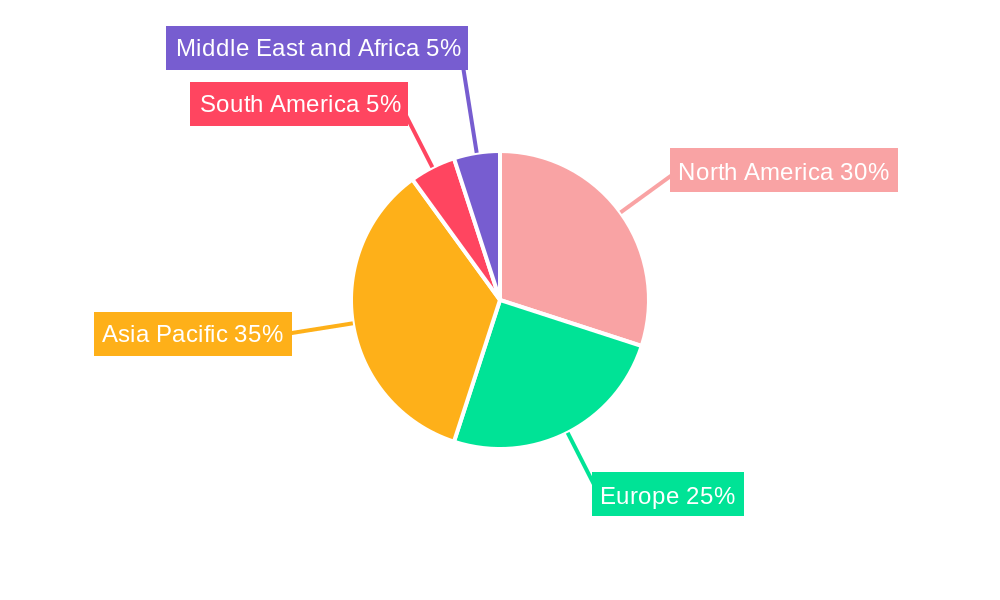
The North American and Asian regions are currently dominant in the petroleum refining and chemicals catalysts market, owing to significant refining and petrochemical capacities. Within the segments:
- Application: Petroleum refining dominates the application segment, representing approximately xx% of the market in 2025, due to its extensive use in various refinery processes. Isomerization and polymerization are also significant segments with growth driven by increasing demand for specialized chemicals.
- Material: Metals and Organometallic Catalysts maintain a significant share, owing to their wide applicability, followed by Aluminosilicates and Molecular Sieves which have niche applications and higher value due to complexity.
Key Drivers:
- North America: Strong existing refining infrastructure, robust petrochemical industry, and stringent environmental regulations contribute to this region's dominance.
- Asia: Rapid industrialization, increasing energy consumption, and expanding petrochemical production capacity are key drivers in Asia. Government initiatives and investments supporting infrastructure development further support growth.
Petroleum Refining & Chemicals Catalysts Industry Product Innovations
Recent innovations focus on developing catalysts with enhanced activity, selectivity, and stability, leading to improved process efficiency and reduced environmental impact. Nanotechnology is being explored to create catalysts with higher surface area and improved catalytic performance. The introduction of new materials and advanced catalyst design, alongside novel preparation techniques, are addressing the growing demand for specialized catalysts. These improvements are crucial for optimizing production costs and reducing waste in various petroleum refining and chemical processes.
Report Scope & Segmentation Analysis
This report segments the market based on application (Petroleum Refining, Isomerization, Synthesis Gas Processes, Polymerization), material (Metals and Organometallic Catalysts, Metallic Compounds, Aluminosilicates, Molecular Sieves, Other Chemical Compounds), and region.
- Application: Each application segment exhibits distinct growth trajectories, dictated by the specific end-use industries and technological advancements. For example, Petroleum Refining is expected to maintain significant growth while Polymerization is potentially experiencing higher growth due to increased demand.
- Material: Each material category has different cost structures, performance characteristics and market penetration. New materials are constantly entering the market, driving innovation and competition.
Key Drivers of Petroleum Refining & Chemicals Catalysts Industry Growth
The industry’s growth is fueled by several key factors: increasing demand for petroleum products and petrochemicals, particularly in developing economies; stringent environmental regulations driving the adoption of cleaner technologies; advancements in catalyst design leading to improved efficiency and selectivity; and expansion of refining and petrochemical capacities globally. Government policies supporting energy security and infrastructure development also contribute to the market's growth.
Challenges in the Petroleum Refining & Chemicals Catalysts Industry Sector
The industry faces challenges such as fluctuating raw material prices and energy costs, intense competition, and stringent environmental regulations requiring constant innovation. Supply chain disruptions can impact production and pricing, while the development and adoption of new technologies require significant investments. Additionally, maintaining consistent catalyst performance across diverse operating conditions and mitigating the risks associated with hazardous materials remain significant obstacles.
Emerging Opportunities in Petroleum Refining & Chemicals Catalysts Industry
Emerging opportunities lie in the development of novel catalysts for cleaner production processes, the expansion into new applications such as biofuels and renewable energy sources, and the exploration of sustainable catalyst synthesis and recycling methods. The adoption of advanced analytical techniques for improved catalyst design and optimization will open new avenues for growth. Furthermore, the increasing demand for specialized catalysts in niche applications presents significant growth potential.
Leading Players in the Petroleum Refining & Chemicals Catalysts Industry Market
- Chevron Phillips Chemical Company
- Honeywell International Inc.
- W R Grace & Co
- Catalytic Distillation Technologies
- Exxon Mobil Corporation
- INEOS Technologies
- Johnson Matthey Inc
- Evonik Industries AG
- Wako Chemicals USA Inc
- KBR Inc
- BASF SE
- Eka Chemicals AB
- Zeochem LLC
- Zeolyst International
- Chicago Bridge & Iron Company
- Dow
- Bayer Technology Services
- Nova Chemicals Corp
- Clariant International Ltd
- Eastman Chemical Co
Key Developments in Petroleum Refining & Chemicals Catalysts Industry Industry
- 2022 Q4: BASF SE announced a significant investment in expanding its catalyst production capacity.
- 2023 Q1: Honeywell International Inc. launched a new line of environmentally friendly catalysts.
- 2023 Q2: A major merger between two smaller catalyst companies was completed. (Further details on this would be included in the full report).
(Further key developments with dates and impact descriptions will be included in the full report.)
Future Outlook for Petroleum Refining & Chemicals Catalysts Industry Market
The future outlook for the petroleum refining and chemicals catalysts market is positive, driven by long-term growth in the petrochemical and refining industries. Technological advancements and stricter environmental regulations will continue to fuel innovation, increasing the demand for high-performance, sustainable catalysts. Strategic acquisitions and partnerships are likely to shape the competitive landscape, leading to further market consolidation. The market is poised for considerable growth, fueled by continuous improvements in catalyst efficiency and sustainability.
Petroleum Refining & Chemicals Catalysts Industry Segmentation
-
1. Material
-
1.1. Metals and Organometallic Catalysts
- 1.1.1. Inexpensive Metals
- 1.1.2. Precious Metals
- 1.1.3. Metallic Compounds
-
1.2. Aluminosilicates
- 1.2.1. Zeolites
- 1.2.2. Molecular Sieves
-
1.3. Chemical Compounds
- 1.3.1. Peroxides
- 1.3.2. Acids
- 1.3.3. Amines
- 1.3.4. Other Chemical Compounds
- 1.4. Other Materials
-
1.1. Metals and Organometallic Catalysts
-
2. Application
-
2.1. Petroleum Refining
- 2.1.1. Fluid Catalytic Cracking (FCC)
- 2.1.2. Hydrocracking
- 2.1.3. Hydrotreating
- 2.1.4. Alkylation
- 2.1.5. Reforming
- 2.1.6. Isomerization
-
2.2. Chemical Synthesis
- 2.2.1. Organic Synthesis
- 2.2.2. Oxidation
- 2.2.3. Hydrogenation
- 2.2.4. Dehydrogenation
- 2.2.5. Synthesis Gas Processes
-
2.3. Polymerization
- 2.3.1. Polyolefins
- 2.3.2. Condensation Polymers
- 2.3.3. Thermosetting Polymers
- 2.3.4. Additional Polymers
-
2.1. Petroleum Refining
Petroleum Refining & Chemicals Catalysts Industry Segmentation By Geography
-
1. Asia Pacific
- 1.1. China
- 1.2. India
- 1.3. Japan
- 1.4. South Korea
- 1.5. ASEAN Countries
- 1.6. Rest of Asia Pacific
-
2. North America
- 2.1. United States
- 2.2. Canada
- 2.3. Mexico
-
3. Europe
- 3.1. Germany
- 3.2. United Kingdom
- 3.3. Italy
- 3.4. France
- 3.5. Rest of Europe
-
4. South America
- 4.1. Brazil
- 4.2. Argentina
- 4.3. Rest of South America
-
5. Middle East and Africa
- 5.1. Saudi Arabia
- 5.2. South Africa
- 5.3. Rest of Middle East and Africa
Petroleum Refining & Chemicals Catalysts Industry Regional Market Share
Geographic Coverage of Petroleum Refining & Chemicals Catalysts Industry
Petroleum Refining & Chemicals Catalysts Industry REPORT HIGHLIGHTS
| Aspects | Details |
|---|---|
| Study Period | 2020-2034 |
| Base Year | 2025 |
| Estimated Year | 2026 |
| Forecast Period | 2026-2034 |
| Historical Period | 2020-2025 |
| Growth Rate | CAGR of 4.3% from 2020-2034 |
| Segmentation |
|
Table of Contents
- 1. Introduction
- 1.1. Research Scope
- 1.2. Market Segmentation
- 1.3. Research Objective
- 1.4. Definitions and Assumptions
- 2. Executive Summary
- 2.1. Market Snapshot
- 3. Market Dynamics
- 3.1. Market Drivers
- 3.2. Market Restrains
- 3.3. Market Trends
- 3.4. Market Opportunities
- 4. Market Factor Analysis
- 4.1. Porters Five Forces
- 4.1.1. Bargaining Power of Suppliers
- 4.1.2. Bargaining Power of Buyers
- 4.1.3. Threat of New Entrants
- 4.1.4. Threat of Substitutes
- 4.1.5. Competitive Rivalry
- 4.2. PESTEL analysis
- 4.3. BCG Analysis
- 4.3.1. Stars (High Growth, High Market Share)
- 4.3.2. Cash Cows (Low Growth, High Market Share)
- 4.3.3. Question Mark (High Growth, Low Market Share)
- 4.3.4. Dogs (Low Growth, Low Market Share)
- 4.4. Ansoff Matrix Analysis
- 4.5. Supply Chain Analysis
- 4.6. Regulatory Landscape
- 4.7. Current Market Potential and Opportunity Assessment (TAM–SAM–SOM Framework)
- 4.8. PRI Analyst Note
- 4.1. Porters Five Forces
- 5. Market Analysis, Insights and Forecast 2021-2033
- 5.1. Market Analysis, Insights and Forecast - by Material
- 5.1.1. Metals and Organometallic Catalysts
- 5.1.1.1. Inexpensive Metals
- 5.1.1.2. Precious Metals
- 5.1.1.3. Metallic Compounds
- 5.1.2. Aluminosilicates
- 5.1.2.1. Zeolites
- 5.1.2.2. Molecular Sieves
- 5.1.3. Chemical Compounds
- 5.1.3.1. Peroxides
- 5.1.3.2. Acids
- 5.1.3.3. Amines
- 5.1.3.4. Other Chemical Compounds
- 5.1.4. Other Materials
- 5.1.1. Metals and Organometallic Catalysts
- 5.2. Market Analysis, Insights and Forecast - by Application
- 5.2.1. Petroleum Refining
- 5.2.1.1. Fluid Catalytic Cracking (FCC)
- 5.2.1.2. Hydrocracking
- 5.2.1.3. Hydrotreating
- 5.2.1.4. Alkylation
- 5.2.1.5. Reforming
- 5.2.1.6. Isomerization
- 5.2.2. Chemical Synthesis
- 5.2.2.1. Organic Synthesis
- 5.2.2.2. Oxidation
- 5.2.2.3. Hydrogenation
- 5.2.2.4. Dehydrogenation
- 5.2.2.5. Synthesis Gas Processes
- 5.2.3. Polymerization
- 5.2.3.1. Polyolefins
- 5.2.3.2. Condensation Polymers
- 5.2.3.3. Thermosetting Polymers
- 5.2.3.4. Additional Polymers
- 5.2.1. Petroleum Refining
- 5.3. Market Analysis, Insights and Forecast - by Region
- 5.3.1. Asia Pacific
- 5.3.2. North America
- 5.3.3. Europe
- 5.3.4. South America
- 5.3.5. Middle East and Africa
- 5.1. Market Analysis, Insights and Forecast - by Material
- 6. Global Petroleum Refining & Chemicals Catalysts Industry Analysis, Insights and Forecast, 2021-2033
- 6.1. Market Analysis, Insights and Forecast - by Material
- 6.1.1. Metals and Organometallic Catalysts
- 6.1.1.1. Inexpensive Metals
- 6.1.1.2. Precious Metals
- 6.1.1.3. Metallic Compounds
- 6.1.2. Aluminosilicates
- 6.1.2.1. Zeolites
- 6.1.2.2. Molecular Sieves
- 6.1.3. Chemical Compounds
- 6.1.3.1. Peroxides
- 6.1.3.2. Acids
- 6.1.3.3. Amines
- 6.1.3.4. Other Chemical Compounds
- 6.1.4. Other Materials
- 6.1.1. Metals and Organometallic Catalysts
- 6.2. Market Analysis, Insights and Forecast - by Application
- 6.2.1. Petroleum Refining
- 6.2.1.1. Fluid Catalytic Cracking (FCC)
- 6.2.1.2. Hydrocracking
- 6.2.1.3. Hydrotreating
- 6.2.1.4. Alkylation
- 6.2.1.5. Reforming
- 6.2.1.6. Isomerization
- 6.2.2. Chemical Synthesis
- 6.2.2.1. Organic Synthesis
- 6.2.2.2. Oxidation
- 6.2.2.3. Hydrogenation
- 6.2.2.4. Dehydrogenation
- 6.2.2.5. Synthesis Gas Processes
- 6.2.3. Polymerization
- 6.2.3.1. Polyolefins
- 6.2.3.2. Condensation Polymers
- 6.2.3.3. Thermosetting Polymers
- 6.2.3.4. Additional Polymers
- 6.2.1. Petroleum Refining
- 6.1. Market Analysis, Insights and Forecast - by Material
- 7. Asia Pacific Petroleum Refining & Chemicals Catalysts Industry Analysis, Insights and Forecast, 2020-2032
- 7.1. Market Analysis, Insights and Forecast - by Material
- 7.1.1. Metals and Organometallic Catalysts
- 7.1.1.1. Inexpensive Metals
- 7.1.1.2. Precious Metals
- 7.1.1.3. Metallic Compounds
- 7.1.2. Aluminosilicates
- 7.1.2.1. Zeolites
- 7.1.2.2. Molecular Sieves
- 7.1.3. Chemical Compounds
- 7.1.3.1. Peroxides
- 7.1.3.2. Acids
- 7.1.3.3. Amines
- 7.1.3.4. Other Chemical Compounds
- 7.1.4. Other Materials
- 7.1.1. Metals and Organometallic Catalysts
- 7.2. Market Analysis, Insights and Forecast - by Application
- 7.2.1. Petroleum Refining
- 7.2.1.1. Fluid Catalytic Cracking (FCC)
- 7.2.1.2. Hydrocracking
- 7.2.1.3. Hydrotreating
- 7.2.1.4. Alkylation
- 7.2.1.5. Reforming
- 7.2.1.6. Isomerization
- 7.2.2. Chemical Synthesis
- 7.2.2.1. Organic Synthesis
- 7.2.2.2. Oxidation
- 7.2.2.3. Hydrogenation
- 7.2.2.4. Dehydrogenation
- 7.2.2.5. Synthesis Gas Processes
- 7.2.3. Polymerization
- 7.2.3.1. Polyolefins
- 7.2.3.2. Condensation Polymers
- 7.2.3.3. Thermosetting Polymers
- 7.2.3.4. Additional Polymers
- 7.2.1. Petroleum Refining
- 7.1. Market Analysis, Insights and Forecast - by Material
- 8. North America Petroleum Refining & Chemicals Catalysts Industry Analysis, Insights and Forecast, 2020-2032
- 8.1. Market Analysis, Insights and Forecast - by Material
- 8.1.1. Metals and Organometallic Catalysts
- 8.1.1.1. Inexpensive Metals
- 8.1.1.2. Precious Metals
- 8.1.1.3. Metallic Compounds
- 8.1.2. Aluminosilicates
- 8.1.2.1. Zeolites
- 8.1.2.2. Molecular Sieves
- 8.1.3. Chemical Compounds
- 8.1.3.1. Peroxides
- 8.1.3.2. Acids
- 8.1.3.3. Amines
- 8.1.3.4. Other Chemical Compounds
- 8.1.4. Other Materials
- 8.1.1. Metals and Organometallic Catalysts
- 8.2. Market Analysis, Insights and Forecast - by Application
- 8.2.1. Petroleum Refining
- 8.2.1.1. Fluid Catalytic Cracking (FCC)
- 8.2.1.2. Hydrocracking
- 8.2.1.3. Hydrotreating
- 8.2.1.4. Alkylation
- 8.2.1.5. Reforming
- 8.2.1.6. Isomerization
- 8.2.2. Chemical Synthesis
- 8.2.2.1. Organic Synthesis
- 8.2.2.2. Oxidation
- 8.2.2.3. Hydrogenation
- 8.2.2.4. Dehydrogenation
- 8.2.2.5. Synthesis Gas Processes
- 8.2.3. Polymerization
- 8.2.3.1. Polyolefins
- 8.2.3.2. Condensation Polymers
- 8.2.3.3. Thermosetting Polymers
- 8.2.3.4. Additional Polymers
- 8.2.1. Petroleum Refining
- 8.1. Market Analysis, Insights and Forecast - by Material
- 9. Europe Petroleum Refining & Chemicals Catalysts Industry Analysis, Insights and Forecast, 2020-2032
- 9.1. Market Analysis, Insights and Forecast - by Material
- 9.1.1. Metals and Organometallic Catalysts
- 9.1.1.1. Inexpensive Metals
- 9.1.1.2. Precious Metals
- 9.1.1.3. Metallic Compounds
- 9.1.2. Aluminosilicates
- 9.1.2.1. Zeolites
- 9.1.2.2. Molecular Sieves
- 9.1.3. Chemical Compounds
- 9.1.3.1. Peroxides
- 9.1.3.2. Acids
- 9.1.3.3. Amines
- 9.1.3.4. Other Chemical Compounds
- 9.1.4. Other Materials
- 9.1.1. Metals and Organometallic Catalysts
- 9.2. Market Analysis, Insights and Forecast - by Application
- 9.2.1. Petroleum Refining
- 9.2.1.1. Fluid Catalytic Cracking (FCC)
- 9.2.1.2. Hydrocracking
- 9.2.1.3. Hydrotreating
- 9.2.1.4. Alkylation
- 9.2.1.5. Reforming
- 9.2.1.6. Isomerization
- 9.2.2. Chemical Synthesis
- 9.2.2.1. Organic Synthesis
- 9.2.2.2. Oxidation
- 9.2.2.3. Hydrogenation
- 9.2.2.4. Dehydrogenation
- 9.2.2.5. Synthesis Gas Processes
- 9.2.3. Polymerization
- 9.2.3.1. Polyolefins
- 9.2.3.2. Condensation Polymers
- 9.2.3.3. Thermosetting Polymers
- 9.2.3.4. Additional Polymers
- 9.2.1. Petroleum Refining
- 9.1. Market Analysis, Insights and Forecast - by Material
- 10. South America Petroleum Refining & Chemicals Catalysts Industry Analysis, Insights and Forecast, 2020-2032
- 10.1. Market Analysis, Insights and Forecast - by Material
- 10.1.1. Metals and Organometallic Catalysts
- 10.1.1.1. Inexpensive Metals
- 10.1.1.2. Precious Metals
- 10.1.1.3. Metallic Compounds
- 10.1.2. Aluminosilicates
- 10.1.2.1. Zeolites
- 10.1.2.2. Molecular Sieves
- 10.1.3. Chemical Compounds
- 10.1.3.1. Peroxides
- 10.1.3.2. Acids
- 10.1.3.3. Amines
- 10.1.3.4. Other Chemical Compounds
- 10.1.4. Other Materials
- 10.1.1. Metals and Organometallic Catalysts
- 10.2. Market Analysis, Insights and Forecast - by Application
- 10.2.1. Petroleum Refining
- 10.2.1.1. Fluid Catalytic Cracking (FCC)
- 10.2.1.2. Hydrocracking
- 10.2.1.3. Hydrotreating
- 10.2.1.4. Alkylation
- 10.2.1.5. Reforming
- 10.2.1.6. Isomerization
- 10.2.2. Chemical Synthesis
- 10.2.2.1. Organic Synthesis
- 10.2.2.2. Oxidation
- 10.2.2.3. Hydrogenation
- 10.2.2.4. Dehydrogenation
- 10.2.2.5. Synthesis Gas Processes
- 10.2.3. Polymerization
- 10.2.3.1. Polyolefins
- 10.2.3.2. Condensation Polymers
- 10.2.3.3. Thermosetting Polymers
- 10.2.3.4. Additional Polymers
- 10.2.1. Petroleum Refining
- 10.1. Market Analysis, Insights and Forecast - by Material
- 11. Middle East and Africa Petroleum Refining & Chemicals Catalysts Industry Analysis, Insights and Forecast, 2020-2032
- 11.1. Market Analysis, Insights and Forecast - by Material
- 11.1.1. Metals and Organometallic Catalysts
- 11.1.1.1. Inexpensive Metals
- 11.1.1.2. Precious Metals
- 11.1.1.3. Metallic Compounds
- 11.1.2. Aluminosilicates
- 11.1.2.1. Zeolites
- 11.1.2.2. Molecular Sieves
- 11.1.3. Chemical Compounds
- 11.1.3.1. Peroxides
- 11.1.3.2. Acids
- 11.1.3.3. Amines
- 11.1.3.4. Other Chemical Compounds
- 11.1.4. Other Materials
- 11.1.1. Metals and Organometallic Catalysts
- 11.2. Market Analysis, Insights and Forecast - by Application
- 11.2.1. Petroleum Refining
- 11.2.1.1. Fluid Catalytic Cracking (FCC)
- 11.2.1.2. Hydrocracking
- 11.2.1.3. Hydrotreating
- 11.2.1.4. Alkylation
- 11.2.1.5. Reforming
- 11.2.1.6. Isomerization
- 11.2.2. Chemical Synthesis
- 11.2.2.1. Organic Synthesis
- 11.2.2.2. Oxidation
- 11.2.2.3. Hydrogenation
- 11.2.2.4. Dehydrogenation
- 11.2.2.5. Synthesis Gas Processes
- 11.2.3. Polymerization
- 11.2.3.1. Polyolefins
- 11.2.3.2. Condensation Polymers
- 11.2.3.3. Thermosetting Polymers
- 11.2.3.4. Additional Polymers
- 11.2.1. Petroleum Refining
- 11.1. Market Analysis, Insights and Forecast - by Material
- 12. Competitive Analysis
- 12.1. Company Profiles
- 12.1.1 Chevron Phillips Chemical Company
- 12.1.1.1. Company Overview
- 12.1.1.2. Products
- 12.1.1.3. Company Financials
- 12.1.1.4. SWOT Analysis
- 12.1.2 Honeywell International Inc
- 12.1.2.1. Company Overview
- 12.1.2.2. Products
- 12.1.2.3. Company Financials
- 12.1.2.4. SWOT Analysis
- 12.1.3 W R Grace & Co
- 12.1.3.1. Company Overview
- 12.1.3.2. Products
- 12.1.3.3. Company Financials
- 12.1.3.4. SWOT Analysis
- 12.1.4 Catalytic Distillation Technologies
- 12.1.4.1. Company Overview
- 12.1.4.2. Products
- 12.1.4.3. Company Financials
- 12.1.4.4. SWOT Analysis
- 12.1.5 Exxon Mobil Corporation
- 12.1.5.1. Company Overview
- 12.1.5.2. Products
- 12.1.5.3. Company Financials
- 12.1.5.4. SWOT Analysis
- 12.1.6 INEOS Technologies
- 12.1.6.1. Company Overview
- 12.1.6.2. Products
- 12.1.6.3. Company Financials
- 12.1.6.4. SWOT Analysis
- 12.1.7 Johnson Matthey Inc
- 12.1.7.1. Company Overview
- 12.1.7.2. Products
- 12.1.7.3. Company Financials
- 12.1.7.4. SWOT Analysis
- 12.1.8 Evonik Industries AG
- 12.1.8.1. Company Overview
- 12.1.8.2. Products
- 12.1.8.3. Company Financials
- 12.1.8.4. SWOT Analysis
- 12.1.9 Wako Chemicals USA Inc
- 12.1.9.1. Company Overview
- 12.1.9.2. Products
- 12.1.9.3. Company Financials
- 12.1.9.4. SWOT Analysis
- 12.1.10 KBR Inc
- 12.1.10.1. Company Overview
- 12.1.10.2. Products
- 12.1.10.3. Company Financials
- 12.1.10.4. SWOT Analysis
- 12.1.11 BASF SE
- 12.1.11.1. Company Overview
- 12.1.11.2. Products
- 12.1.11.3. Company Financials
- 12.1.11.4. SWOT Analysis
- 12.1.12 Eka Chemicals AB
- 12.1.12.1. Company Overview
- 12.1.12.2. Products
- 12.1.12.3. Company Financials
- 12.1.12.4. SWOT Analysis
- 12.1.13 Zeochem LLC
- 12.1.13.1. Company Overview
- 12.1.13.2. Products
- 12.1.13.3. Company Financials
- 12.1.13.4. SWOT Analysis
- 12.1.14 Zeolyst International*List Not Exhaustive
- 12.1.14.1. Company Overview
- 12.1.14.2. Products
- 12.1.14.3. Company Financials
- 12.1.14.4. SWOT Analysis
- 12.1.15 Chicago Bridge & Iron Company
- 12.1.15.1. Company Overview
- 12.1.15.2. Products
- 12.1.15.3. Company Financials
- 12.1.15.4. SWOT Analysis
- 12.1.16 Dow
- 12.1.16.1. Company Overview
- 12.1.16.2. Products
- 12.1.16.3. Company Financials
- 12.1.16.4. SWOT Analysis
- 12.1.17 Bayer Technology Services
- 12.1.17.1. Company Overview
- 12.1.17.2. Products
- 12.1.17.3. Company Financials
- 12.1.17.4. SWOT Analysis
- 12.1.18 Nova Chemicals Corp
- 12.1.18.1. Company Overview
- 12.1.18.2. Products
- 12.1.18.3. Company Financials
- 12.1.18.4. SWOT Analysis
- 12.1.19 Clariant International Ltd
- 12.1.19.1. Company Overview
- 12.1.19.2. Products
- 12.1.19.3. Company Financials
- 12.1.19.4. SWOT Analysis
- 12.1.20 Eastman Chemical Co
- 12.1.20.1. Company Overview
- 12.1.20.2. Products
- 12.1.20.3. Company Financials
- 12.1.20.4. SWOT Analysis
- 12.1.1 Chevron Phillips Chemical Company
- 12.2. Market Entropy
- 12.2.1 Company's Key Areas Served
- 12.2.2 Recent Developments
- 12.3. Company Market Share Analysis 2025
- 12.3.1 Top 5 Companies Market Share Analysis
- 12.3.2 Top 3 Companies Market Share Analysis
- 12.4. List of Potential Customers
- 13. Research Methodology
List of Figures
- Figure 1: Global Petroleum Refining & Chemicals Catalysts Industry Revenue Breakdown (million, %) by Region 2025 & 2033
- Figure 2: Asia Pacific Petroleum Refining & Chemicals Catalysts Industry Revenue (million), by Material 2025 & 2033
- Figure 3: Asia Pacific Petroleum Refining & Chemicals Catalysts Industry Revenue Share (%), by Material 2025 & 2033
- Figure 4: Asia Pacific Petroleum Refining & Chemicals Catalysts Industry Revenue (million), by Application 2025 & 2033
- Figure 5: Asia Pacific Petroleum Refining & Chemicals Catalysts Industry Revenue Share (%), by Application 2025 & 2033
- Figure 6: Asia Pacific Petroleum Refining & Chemicals Catalysts Industry Revenue (million), by Country 2025 & 2033
- Figure 7: Asia Pacific Petroleum Refining & Chemicals Catalysts Industry Revenue Share (%), by Country 2025 & 2033
- Figure 8: North America Petroleum Refining & Chemicals Catalysts Industry Revenue (million), by Material 2025 & 2033
- Figure 9: North America Petroleum Refining & Chemicals Catalysts Industry Revenue Share (%), by Material 2025 & 2033
- Figure 10: North America Petroleum Refining & Chemicals Catalysts Industry Revenue (million), by Application 2025 & 2033
- Figure 11: North America Petroleum Refining & Chemicals Catalysts Industry Revenue Share (%), by Application 2025 & 2033
- Figure 12: North America Petroleum Refining & Chemicals Catalysts Industry Revenue (million), by Country 2025 & 2033
- Figure 13: North America Petroleum Refining & Chemicals Catalysts Industry Revenue Share (%), by Country 2025 & 2033
- Figure 14: Europe Petroleum Refining & Chemicals Catalysts Industry Revenue (million), by Material 2025 & 2033
- Figure 15: Europe Petroleum Refining & Chemicals Catalysts Industry Revenue Share (%), by Material 2025 & 2033
- Figure 16: Europe Petroleum Refining & Chemicals Catalysts Industry Revenue (million), by Application 2025 & 2033
- Figure 17: Europe Petroleum Refining & Chemicals Catalysts Industry Revenue Share (%), by Application 2025 & 2033
- Figure 18: Europe Petroleum Refining & Chemicals Catalysts Industry Revenue (million), by Country 2025 & 2033
- Figure 19: Europe Petroleum Refining & Chemicals Catalysts Industry Revenue Share (%), by Country 2025 & 2033
- Figure 20: South America Petroleum Refining & Chemicals Catalysts Industry Revenue (million), by Material 2025 & 2033
- Figure 21: South America Petroleum Refining & Chemicals Catalysts Industry Revenue Share (%), by Material 2025 & 2033
- Figure 22: South America Petroleum Refining & Chemicals Catalysts Industry Revenue (million), by Application 2025 & 2033
- Figure 23: South America Petroleum Refining & Chemicals Catalysts Industry Revenue Share (%), by Application 2025 & 2033
- Figure 24: South America Petroleum Refining & Chemicals Catalysts Industry Revenue (million), by Country 2025 & 2033
- Figure 25: South America Petroleum Refining & Chemicals Catalysts Industry Revenue Share (%), by Country 2025 & 2033
- Figure 26: Middle East and Africa Petroleum Refining & Chemicals Catalysts Industry Revenue (million), by Material 2025 & 2033
- Figure 27: Middle East and Africa Petroleum Refining & Chemicals Catalysts Industry Revenue Share (%), by Material 2025 & 2033
- Figure 28: Middle East and Africa Petroleum Refining & Chemicals Catalysts Industry Revenue (million), by Application 2025 & 2033
- Figure 29: Middle East and Africa Petroleum Refining & Chemicals Catalysts Industry Revenue Share (%), by Application 2025 & 2033
- Figure 30: Middle East and Africa Petroleum Refining & Chemicals Catalysts Industry Revenue (million), by Country 2025 & 2033
- Figure 31: Middle East and Africa Petroleum Refining & Chemicals Catalysts Industry Revenue Share (%), by Country 2025 & 2033
List of Tables
- Table 1: Global Petroleum Refining & Chemicals Catalysts Industry Revenue million Forecast, by Material 2020 & 2033
- Table 2: Global Petroleum Refining & Chemicals Catalysts Industry Revenue million Forecast, by Application 2020 & 2033
- Table 3: Global Petroleum Refining & Chemicals Catalysts Industry Revenue million Forecast, by Region 2020 & 2033
- Table 4: Global Petroleum Refining & Chemicals Catalysts Industry Revenue million Forecast, by Material 2020 & 2033
- Table 5: Global Petroleum Refining & Chemicals Catalysts Industry Revenue million Forecast, by Application 2020 & 2033
- Table 6: Global Petroleum Refining & Chemicals Catalysts Industry Revenue million Forecast, by Country 2020 & 2033
- Table 7: China Petroleum Refining & Chemicals Catalysts Industry Revenue (million) Forecast, by Application 2020 & 2033
- Table 8: India Petroleum Refining & Chemicals Catalysts Industry Revenue (million) Forecast, by Application 2020 & 2033
- Table 9: Japan Petroleum Refining & Chemicals Catalysts Industry Revenue (million) Forecast, by Application 2020 & 2033
- Table 10: South Korea Petroleum Refining & Chemicals Catalysts Industry Revenue (million) Forecast, by Application 2020 & 2033
- Table 11: ASEAN Countries Petroleum Refining & Chemicals Catalysts Industry Revenue (million) Forecast, by Application 2020 & 2033
- Table 12: Rest of Asia Pacific Petroleum Refining & Chemicals Catalysts Industry Revenue (million) Forecast, by Application 2020 & 2033
- Table 13: Global Petroleum Refining & Chemicals Catalysts Industry Revenue million Forecast, by Material 2020 & 2033
- Table 14: Global Petroleum Refining & Chemicals Catalysts Industry Revenue million Forecast, by Application 2020 & 2033
- Table 15: Global Petroleum Refining & Chemicals Catalysts Industry Revenue million Forecast, by Country 2020 & 2033
- Table 16: United States Petroleum Refining & Chemicals Catalysts Industry Revenue (million) Forecast, by Application 2020 & 2033
- Table 17: Canada Petroleum Refining & Chemicals Catalysts Industry Revenue (million) Forecast, by Application 2020 & 2033
- Table 18: Mexico Petroleum Refining & Chemicals Catalysts Industry Revenue (million) Forecast, by Application 2020 & 2033
- Table 19: Global Petroleum Refining & Chemicals Catalysts Industry Revenue million Forecast, by Material 2020 & 2033
- Table 20: Global Petroleum Refining & Chemicals Catalysts Industry Revenue million Forecast, by Application 2020 & 2033
- Table 21: Global Petroleum Refining & Chemicals Catalysts Industry Revenue million Forecast, by Country 2020 & 2033
- Table 22: Germany Petroleum Refining & Chemicals Catalysts Industry Revenue (million) Forecast, by Application 2020 & 2033
- Table 23: United Kingdom Petroleum Refining & Chemicals Catalysts Industry Revenue (million) Forecast, by Application 2020 & 2033
- Table 24: Italy Petroleum Refining & Chemicals Catalysts Industry Revenue (million) Forecast, by Application 2020 & 2033
- Table 25: France Petroleum Refining & Chemicals Catalysts Industry Revenue (million) Forecast, by Application 2020 & 2033
- Table 26: Rest of Europe Petroleum Refining & Chemicals Catalysts Industry Revenue (million) Forecast, by Application 2020 & 2033
- Table 27: Global Petroleum Refining & Chemicals Catalysts Industry Revenue million Forecast, by Material 2020 & 2033
- Table 28: Global Petroleum Refining & Chemicals Catalysts Industry Revenue million Forecast, by Application 2020 & 2033
- Table 29: Global Petroleum Refining & Chemicals Catalysts Industry Revenue million Forecast, by Country 2020 & 2033
- Table 30: Brazil Petroleum Refining & Chemicals Catalysts Industry Revenue (million) Forecast, by Application 2020 & 2033
- Table 31: Argentina Petroleum Refining & Chemicals Catalysts Industry Revenue (million) Forecast, by Application 2020 & 2033
- Table 32: Rest of South America Petroleum Refining & Chemicals Catalysts Industry Revenue (million) Forecast, by Application 2020 & 2033
- Table 33: Global Petroleum Refining & Chemicals Catalysts Industry Revenue million Forecast, by Material 2020 & 2033
- Table 34: Global Petroleum Refining & Chemicals Catalysts Industry Revenue million Forecast, by Application 2020 & 2033
- Table 35: Global Petroleum Refining & Chemicals Catalysts Industry Revenue million Forecast, by Country 2020 & 2033
- Table 36: Saudi Arabia Petroleum Refining & Chemicals Catalysts Industry Revenue (million) Forecast, by Application 2020 & 2033
- Table 37: South Africa Petroleum Refining & Chemicals Catalysts Industry Revenue (million) Forecast, by Application 2020 & 2033
- Table 38: Rest of Middle East and Africa Petroleum Refining & Chemicals Catalysts Industry Revenue (million) Forecast, by Application 2020 & 2033
Frequently Asked Questions
1. What is the projected Compound Annual Growth Rate (CAGR) of the Petroleum Refining & Chemicals Catalysts Industry?
The projected CAGR is approximately 4.3%.
2. Which companies are prominent players in the Petroleum Refining & Chemicals Catalysts Industry?
Key companies in the market include Chevron Phillips Chemical Company, Honeywell International Inc, W R Grace & Co, Catalytic Distillation Technologies, Exxon Mobil Corporation, INEOS Technologies, Johnson Matthey Inc, Evonik Industries AG, Wako Chemicals USA Inc, KBR Inc, BASF SE, Eka Chemicals AB, Zeochem LLC, Zeolyst International*List Not Exhaustive, Chicago Bridge & Iron Company, Dow, Bayer Technology Services, Nova Chemicals Corp, Clariant International Ltd, Eastman Chemical Co.
3. What are the main segments of the Petroleum Refining & Chemicals Catalysts Industry?
The market segments include Material, Application.
4. Can you provide details about the market size?
The market size is estimated to be USD 10096.57 million as of 2022.
5. What are some drivers contributing to market growth?
Increasing Refinery Market Output in Africa; Middle East; and Asia-Pacific; Rising Demand for Maintaining High Octane Figures.
6. What are the notable trends driving market growth?
Petroleum Refining Application to Dominate the Market.
7. Are there any restraints impacting market growth?
High Manufacturing Costs; Other Restraints.
8. Can you provide examples of recent developments in the market?
N/A
9. What pricing options are available for accessing the report?
Pricing options include single-user, multi-user, and enterprise licenses priced at USD 4750, USD 5250, and USD 8750 respectively.
10. Is the market size provided in terms of value or volume?
The market size is provided in terms of value, measured in million.
11. Are there any specific market keywords associated with the report?
Yes, the market keyword associated with the report is "Petroleum Refining & Chemicals Catalysts Industry," which aids in identifying and referencing the specific market segment covered.
12. How do I determine which pricing option suits my needs best?
The pricing options vary based on user requirements and access needs. Individual users may opt for single-user licenses, while businesses requiring broader access may choose multi-user or enterprise licenses for cost-effective access to the report.
13. Are there any additional resources or data provided in the Petroleum Refining & Chemicals Catalysts Industry report?
While the report offers comprehensive insights, it's advisable to review the specific contents or supplementary materials provided to ascertain if additional resources or data are available.
14. How can I stay updated on further developments or reports in the Petroleum Refining & Chemicals Catalysts Industry?
To stay informed about further developments, trends, and reports in the Petroleum Refining & Chemicals Catalysts Industry, consider subscribing to industry newsletters, following relevant companies and organizations, or regularly checking reputable industry news sources and publications.
Methodology
Step 1 - Identification of Relevant Samples Size from Population Database


Step 2 - Approaches for Defining Global Market Size (Value, Volume* & Price*)

Note*: In applicable scenarios
Step 3 - Data Sources
Primary Research
- Web Analytics
- Survey Reports
- Research Institute
- Latest Research Reports
- Opinion Leaders
Secondary Research
- Annual Reports
- White Paper
- Latest Press Release
- Industry Association
- Paid Database
- Investor Presentations

Step 4 - Data Triangulation
Involves using different sources of information in order to increase the validity of a study
These sources are likely to be stakeholders in a program - participants, other researchers, program staff, other community members, and so on.
Then we put all data in single framework & apply various statistical tools to find out the dynamic on the market.
During the analysis stage, feedback from the stakeholder groups would be compared to determine areas of agreement as well as areas of divergence