

Key Insights
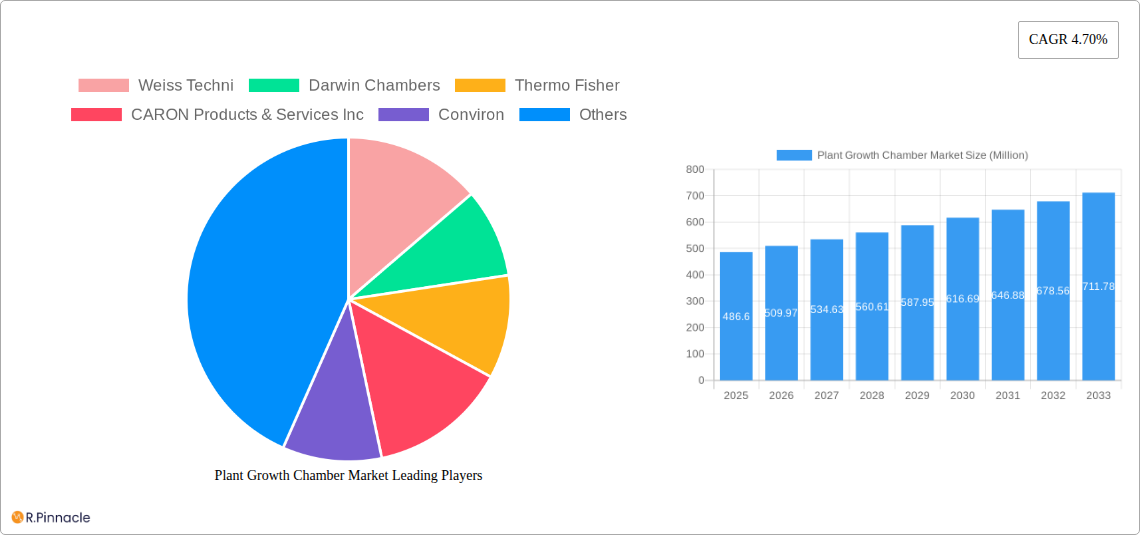
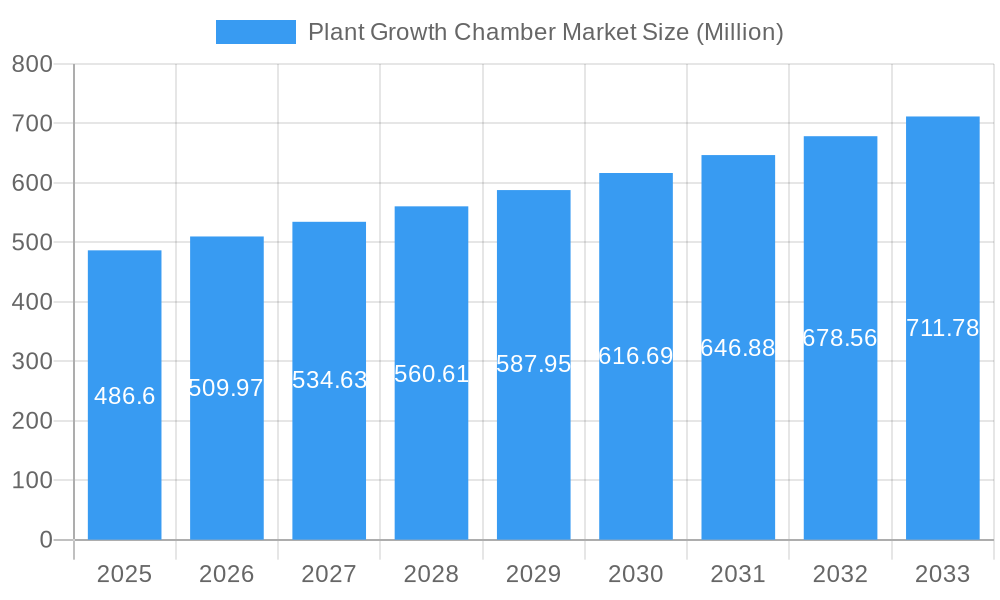
The global plant growth chamber market, valued at $486.60 million in 2025, is projected to experience robust growth, driven by a compound annual growth rate (CAGR) of 4.70% from 2025 to 2033. This expansion is fueled by several key factors. Firstly, the increasing demand for high-quality agricultural produce year-round is driving the adoption of plant growth chambers across research institutions, universities, and commercial horticulture settings. Precision agriculture and controlled-environment agriculture (CEA) are gaining momentum, leading to greater investment in advanced chamber technologies for optimizing plant growth, seed germination, and overall environmental control. The market is further segmented by equipment type (reach-in and walk-in chambers), application (short and tall plants), and function (plant growth, seed germination, environmental optimization, and tissue culture). The availability of sophisticated features such as automated climate control, lighting systems, and data monitoring capabilities are also contributing to market growth. North America and Europe currently hold significant market share, attributed to well-established research infrastructure and a strong focus on technological advancements in agriculture. However, the Asia-Pacific region is expected to witness significant growth in the coming years due to rising agricultural output and increasing adoption of controlled environment agriculture techniques.
Plant Growth Chamber Market Market Size (In Million)
Despite the positive outlook, the market faces certain challenges. High initial investment costs for advanced plant growth chambers and the need for specialized technical expertise can hinder market penetration, particularly among smaller-scale agricultural operations. Furthermore, competition from established players and emerging companies in the market will continue to shape the industry landscape. Nevertheless, ongoing advancements in chamber technology, including the integration of IoT (Internet of Things) and AI (Artificial Intelligence) for better data analysis and control, are anticipated to overcome these limitations and drive market growth further. The increasing focus on sustainable agriculture and food security also presents significant opportunities for the plant growth chamber market. The diversification of applications within pharmaceutical and biotechnology research will further expand the market reach in the forecast period.
Plant Growth Chamber Market Company Market Share
Plant Growth Chamber Market Report: 2019-2033
This comprehensive report provides a detailed analysis of the Plant Growth Chamber Market, offering valuable insights for industry professionals, investors, and researchers. Covering the period from 2019 to 2033, with a base year of 2025 and a forecast period of 2025-2033, this report delves into market dynamics, segmentation, competitive landscape, and future growth prospects. The market is expected to reach xx Million by 2033, exhibiting a CAGR of xx% during the forecast period.
Plant Growth Chamber Market Structure & Innovation Trends
The Plant Growth Chamber market is moderately fragmented, with key players like Weiss Techni, Darwin Chambers, Thermo Fisher, CARON Products & Services Inc, Conviron, Aralab, Percival Scientific Inc, Brs Bvba, BINDER GmbH, Hettich Benelux BV, Saveer Biotech Limited, and Freezers India holding significant market share. Exact market share percentages are detailed within the full report. However, no single company dominates the market. Innovation is driven by the need for improved environmental control, increased automation, and enhanced data analysis capabilities. Regulatory frameworks, particularly those concerning energy efficiency and environmental impact, are influencing market trends. Product substitutes, such as controlled environment greenhouses, exist but often lack the precision and control offered by plant growth chambers. The end-user demographics are predominantly research institutions, universities, pharmaceutical companies, and agricultural businesses. Recent M&A activities, such as the May 2021 merger of Weiss Umwelttechnik GmbH and Vötsch Industrietechnik GmbH, demonstrate a consolidation trend within the sector. These mergers often result in expanded product portfolios and increased market reach. The total value of M&A deals within the last five years is estimated at xx Million.
- Market Concentration: Moderately fragmented
- Innovation Drivers: Improved environmental control, automation, data analysis
- Regulatory Frameworks: Energy efficiency, environmental impact
- Product Substitutes: Controlled environment greenhouses
- End-User Demographics: Research institutions, universities, pharmaceutical companies, agricultural businesses
- M&A Activities: Significant consolidation trend, deal values estimated at xx Million
Plant Growth Chamber Market Dynamics & Trends
The Plant Growth Chamber market is experiencing robust growth fueled by several key factors. The increasing demand for controlled experiments in various fields such as plant biology, agriculture, and pharmaceuticals is a major driver. Advances in technology, including the integration of IoT sensors and AI-powered analytics, are enhancing the capabilities of plant growth chambers, further stimulating market expansion. The growing adoption of precision agriculture and vertical farming techniques is also contributing to market growth. Furthermore, consumer preference for higher quality and sustainably produced food is creating demand for innovative technologies that improve crop yields and reduce environmental impact. Competitive dynamics are shaped by product innovation, pricing strategies, and geographical reach. Market penetration is particularly high in developed regions with strong research infrastructure.
Dominant Regions & Segments in Plant Growth Chamber Market
North America currently dominates the Plant Growth Chamber market, driven by significant investments in agricultural research and strong technological advancements. Europe follows closely, showcasing a sizable market share due to its robust research institutions and stringent environmental regulations. Asia-Pacific is expected to show considerable growth in the coming years due to increasing agricultural activity and rising disposable incomes.
Key Drivers by Region:
- North America: Strong R&D investments, advanced technology adoption
- Europe: Robust research infrastructure, stringent regulations
- Asia-Pacific: Growing agricultural sector, rising disposable income
Dominant Segments:
- Equipment Type: Walk-in chambers currently hold a larger market share than reach-in chambers due to their capacity to accommodate larger research projects.
- Application: The demand for tall plant growth chambers is increasing due to research involving larger plant varieties.
- Function: Plant growth and tissue culture are the largest segments, driven by their crucial roles in various research and development activities.
Plant Growth Chamber Market Product Innovations
Recent innovations focus on improving environmental control, energy efficiency, and data acquisition. New models incorporate advanced sensors, automated control systems, and improved lighting technologies such as LED systems which offer better control over light spectra. The integration of IoT and AI capabilities offers remote monitoring, real-time data analysis, and predictive maintenance capabilities. These innovations improve research efficiency and reduce operational costs. The market is seeing a trend toward modular designs which provide greater flexibility and customization.
Report Scope & Segmentation Analysis
This report segments the Plant Growth Chamber market based on equipment type (Reach-in, Walk-in), application (Short Plants, Tall Plants), and function (Plant Growth, Seed Germination, Environment Optimization, Tissue Culture). Each segment's market size, growth projections, and competitive dynamics are analyzed in detail. For example, the Walk-in segment is projected to experience higher growth compared to the Reach-in segment due to increasing demand from large-scale research facilities and commercial applications. Similarly, the Tall Plants application segment is gaining traction due to the expanding market for specialty crops and vertical farms. The Plant Growth function continues to dominate, followed by tissue culture, indicating the significance of these applications within the overall market.
Key Drivers of Plant Growth Chamber Market Growth
Several factors are driving the growth of the Plant Growth Chamber market. Technological advancements, particularly in lighting, environmental control, and data analytics, are enhancing the capabilities of plant growth chambers. Increased government funding for agricultural research and development programs across various countries is stimulating market demand. The rising adoption of precision agriculture and vertical farming techniques is creating a need for sophisticated plant growth chambers. Lastly, growing consumer awareness of sustainable food production practices is fuelling interest in advanced technologies that can optimize crop yields while minimizing environmental impact.
Challenges in the Plant Growth Chamber Market Sector
The Plant Growth Chamber market faces challenges including high initial investment costs, stringent regulatory compliance requirements (e.g., energy efficiency standards), and supply chain disruptions impacting component availability. Competition among established players is intense, leading to price pressures. Furthermore, fluctuating raw material costs can impact the profitability of manufacturers. These challenges need to be addressed for sustained market growth.
Emerging Opportunities in Plant Growth Chamber Market
Emerging opportunities include the integration of advanced automation and AI technologies to improve efficiency and optimize plant growth. The expansion of vertical farming and urban agriculture presents significant growth potential. Additionally, there is a growing demand for specialized chambers tailored to specific crops and research needs. The development of energy-efficient plant growth chambers that meet sustainability goals offers a significant opportunity.
Leading Players in the Plant Growth Chamber Market Market
- Weiss Techni
- Darwin Chambers
- Thermo Fisher
- CARON Products & Services Inc
- Conviron
- Aralab
- Percival Scientific Inc
- Brs Bvba
- BINDER GmbH
- Hettich Benelux BV
- Saveer Biotech Limited
- Freezers India
Key Developments in Plant Growth Chamber Market Industry
- January 2022: Conviron launched the EVO series of plant growth chambers, enhancing spatial uniformity for plant growth.
- August 2021: Caron acquired Bigneat, expanding its product portfolio in laboratory equipment.
- May 2021: Weiss Umwelttechnik GmbH merged with Vötsch Industrietechnik GmbH, strengthening its position in environmental simulation.
Future Outlook for Plant Growth Chamber Market Market
The Plant Growth Chamber market is poised for continued growth, driven by technological advancements, increasing demand from research institutions, and the expansion of controlled environment agriculture. Strategic partnerships, investments in R&D, and the development of innovative products tailored to specific applications will be key to success in this dynamic market. The market is expected to witness a significant increase in the adoption of advanced technologies and automation, further enhancing its capabilities and driving market expansion.
Plant Growth Chamber Market Segmentation
- 1. Production Analysis
- 2. Consumption Analysis
- 3. Import Market Analysis (Value & Volume)
- 4. Export Market Analysis (Value & Volume)
- 5. Price Trend Analysis
Plant Growth Chamber Market Segmentation By Geography
-
1. North America
- 1.1. United States
- 1.2. Canada
- 1.3. Mexico
-
2. South America
- 2.1. Brazil
- 2.2. Argentina
- 2.3. Rest of South America
-
3. Europe
- 3.1. United Kingdom
- 3.2. Germany
- 3.3. France
- 3.4. Italy
- 3.5. Spain
- 3.6. Russia
- 3.7. Benelux
- 3.8. Nordics
- 3.9. Rest of Europe
-
4. Middle East & Africa
- 4.1. Turkey
- 4.2. Israel
- 4.3. GCC
- 4.4. North Africa
- 4.5. South Africa
- 4.6. Rest of Middle East & Africa
-
5. Asia Pacific
- 5.1. China
- 5.2. India
- 5.3. Japan
- 5.4. South Korea
- 5.5. ASEAN
- 5.6. Oceania
- 5.7. Rest of Asia Pacific
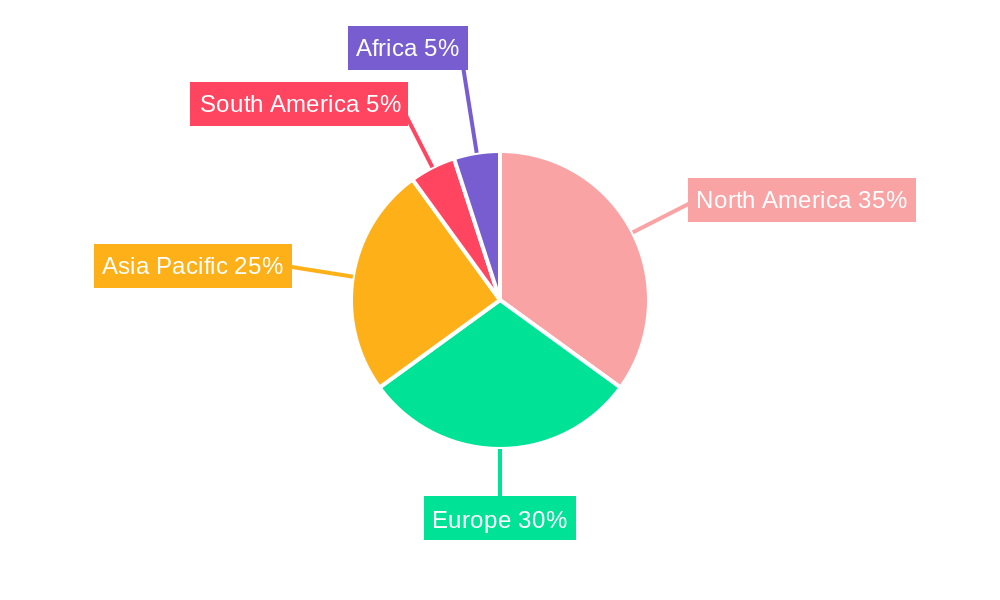
Plant Growth Chamber Market Regional Market Share
Geographic Coverage of Plant Growth Chamber Market
Plant Growth Chamber Market REPORT HIGHLIGHTS
| Aspects | Details |
|---|---|
| Study Period | 2020-2034 |
| Base Year | 2025 |
| Estimated Year | 2026 |
| Forecast Period | 2026-2034 |
| Historical Period | 2020-2025 |
| Growth Rate | CAGR of 4.70% from 2020-2034 |
| Segmentation |
|
Table of Contents
- 1. Introduction
- 1.1. Research Scope
- 1.2. Market Segmentation
- 1.3. Research Objective
- 1.4. Definitions and Assumptions
- 2. Executive Summary
- 2.1. Market Snapshot
- 3. Market Dynamics
- 3.1. Market Drivers
- 3.2. Market Restrains
- 3.3. Market Trends
- 3.4. Market Opportunities
- 4. Market Factor Analysis
- 4.1. Porters Five Forces
- 4.1.1. Bargaining Power of Suppliers
- 4.1.2. Bargaining Power of Buyers
- 4.1.3. Threat of New Entrants
- 4.1.4. Threat of Substitutes
- 4.1.5. Competitive Rivalry
- 4.2. PESTEL analysis
- 4.3. BCG Analysis
- 4.3.1. Stars (High Growth, High Market Share)
- 4.3.2. Cash Cows (Low Growth, High Market Share)
- 4.3.3. Question Mark (High Growth, Low Market Share)
- 4.3.4. Dogs (Low Growth, Low Market Share)
- 4.4. Ansoff Matrix Analysis
- 4.5. Supply Chain Analysis
- 4.6. Regulatory Landscape
- 4.7. Current Market Potential and Opportunity Assessment (TAM–SAM–SOM Framework)
- 4.8. PRI Analyst Note
- 4.1. Porters Five Forces
- 5. Market Analysis, Insights and Forecast 2021-2033
- 5.1. Market Analysis, Insights and Forecast - by Production Analysis
- 5.2. Market Analysis, Insights and Forecast - by Consumption Analysis
- 5.3. Market Analysis, Insights and Forecast - by Import Market Analysis (Value & Volume)
- 5.4. Market Analysis, Insights and Forecast - by Export Market Analysis (Value & Volume)
- 5.5. Market Analysis, Insights and Forecast - by Price Trend Analysis
- 5.6. Market Analysis, Insights and Forecast - by Region
- 5.6.1. North America
- 5.6.2. South America
- 5.6.3. Europe
- 5.6.4. Middle East & Africa
- 5.6.5. Asia Pacific
- 6. Global Plant Growth Chamber Market Analysis, Insights and Forecast, 2021-2033
- 6.1. Market Analysis, Insights and Forecast - by Production Analysis
- 6.2. Market Analysis, Insights and Forecast - by Consumption Analysis
- 6.3. Market Analysis, Insights and Forecast - by Import Market Analysis (Value & Volume)
- 6.4. Market Analysis, Insights and Forecast - by Export Market Analysis (Value & Volume)
- 6.5. Market Analysis, Insights and Forecast - by Price Trend Analysis
- 7. North America Plant Growth Chamber Market Analysis, Insights and Forecast, 2020-2032
- 7.1. Market Analysis, Insights and Forecast - by Production Analysis
- 7.2. Market Analysis, Insights and Forecast - by Consumption Analysis
- 7.3. Market Analysis, Insights and Forecast - by Import Market Analysis (Value & Volume)
- 7.4. Market Analysis, Insights and Forecast - by Export Market Analysis (Value & Volume)
- 7.5. Market Analysis, Insights and Forecast - by Price Trend Analysis
- 8. South America Plant Growth Chamber Market Analysis, Insights and Forecast, 2020-2032
- 8.1. Market Analysis, Insights and Forecast - by Production Analysis
- 8.2. Market Analysis, Insights and Forecast - by Consumption Analysis
- 8.3. Market Analysis, Insights and Forecast - by Import Market Analysis (Value & Volume)
- 8.4. Market Analysis, Insights and Forecast - by Export Market Analysis (Value & Volume)
- 8.5. Market Analysis, Insights and Forecast - by Price Trend Analysis
- 9. Europe Plant Growth Chamber Market Analysis, Insights and Forecast, 2020-2032
- 9.1. Market Analysis, Insights and Forecast - by Production Analysis
- 9.2. Market Analysis, Insights and Forecast - by Consumption Analysis
- 9.3. Market Analysis, Insights and Forecast - by Import Market Analysis (Value & Volume)
- 9.4. Market Analysis, Insights and Forecast - by Export Market Analysis (Value & Volume)
- 9.5. Market Analysis, Insights and Forecast - by Price Trend Analysis
- 10. Middle East & Africa Plant Growth Chamber Market Analysis, Insights and Forecast, 2020-2032
- 10.1. Market Analysis, Insights and Forecast - by Production Analysis
- 10.2. Market Analysis, Insights and Forecast - by Consumption Analysis
- 10.3. Market Analysis, Insights and Forecast - by Import Market Analysis (Value & Volume)
- 10.4. Market Analysis, Insights and Forecast - by Export Market Analysis (Value & Volume)
- 10.5. Market Analysis, Insights and Forecast - by Price Trend Analysis
- 11. Asia Pacific Plant Growth Chamber Market Analysis, Insights and Forecast, 2020-2032
- 11.1. Market Analysis, Insights and Forecast - by Production Analysis
- 11.2. Market Analysis, Insights and Forecast - by Consumption Analysis
- 11.3. Market Analysis, Insights and Forecast - by Import Market Analysis (Value & Volume)
- 11.4. Market Analysis, Insights and Forecast - by Export Market Analysis (Value & Volume)
- 11.5. Market Analysis, Insights and Forecast - by Price Trend Analysis
- 12. Competitive Analysis
- 12.1. Company Profiles
- 12.1.1 Weiss Techni
- 12.1.1.1. Company Overview
- 12.1.1.2. Products
- 12.1.1.3. Company Financials
- 12.1.1.4. SWOT Analysis
- 12.1.2 Darwin Chambers
- 12.1.2.1. Company Overview
- 12.1.2.2. Products
- 12.1.2.3. Company Financials
- 12.1.2.4. SWOT Analysis
- 12.1.3 Thermo Fisher
- 12.1.3.1. Company Overview
- 12.1.3.2. Products
- 12.1.3.3. Company Financials
- 12.1.3.4. SWOT Analysis
- 12.1.4 CARON Products & Services Inc
- 12.1.4.1. Company Overview
- 12.1.4.2. Products
- 12.1.4.3. Company Financials
- 12.1.4.4. SWOT Analysis
- 12.1.5 Conviron
- 12.1.5.1. Company Overview
- 12.1.5.2. Products
- 12.1.5.3. Company Financials
- 12.1.5.4. SWOT Analysis
- 12.1.6 Aralab
- 12.1.6.1. Company Overview
- 12.1.6.2. Products
- 12.1.6.3. Company Financials
- 12.1.6.4. SWOT Analysis
- 12.1.7 Percival Scientific Inc
- 12.1.7.1. Company Overview
- 12.1.7.2. Products
- 12.1.7.3. Company Financials
- 12.1.7.4. SWOT Analysis
- 12.1.8 Brs Bvba
- 12.1.8.1. Company Overview
- 12.1.8.2. Products
- 12.1.8.3. Company Financials
- 12.1.8.4. SWOT Analysis
- 12.1.9 BINDER GmbH
- 12.1.9.1. Company Overview
- 12.1.9.2. Products
- 12.1.9.3. Company Financials
- 12.1.9.4. SWOT Analysis
- 12.1.10 Hettich Benelux BV
- 12.1.10.1. Company Overview
- 12.1.10.2. Products
- 12.1.10.3. Company Financials
- 12.1.10.4. SWOT Analysis
- 12.1.11 Saveer Biotech Limited
- 12.1.11.1. Company Overview
- 12.1.11.2. Products
- 12.1.11.3. Company Financials
- 12.1.11.4. SWOT Analysis
- 12.1.12 Freezers India
- 12.1.12.1. Company Overview
- 12.1.12.2. Products
- 12.1.12.3. Company Financials
- 12.1.12.4. SWOT Analysis
- 12.1.1 Weiss Techni
- 12.2. Market Entropy
- 12.2.1 Company's Key Areas Served
- 12.2.2 Recent Developments
- 12.3. Company Market Share Analysis 2025
- 12.3.1 Top 5 Companies Market Share Analysis
- 12.3.2 Top 3 Companies Market Share Analysis
- 12.4. List of Potential Customers
- 13. Research Methodology
List of Figures
- Figure 1: Global Plant Growth Chamber Market Revenue Breakdown (Million, %) by Region 2025 & 2033
- Figure 2: North America Plant Growth Chamber Market Revenue (Million), by Production Analysis 2025 & 2033
- Figure 3: North America Plant Growth Chamber Market Revenue Share (%), by Production Analysis 2025 & 2033
- Figure 4: North America Plant Growth Chamber Market Revenue (Million), by Consumption Analysis 2025 & 2033
- Figure 5: North America Plant Growth Chamber Market Revenue Share (%), by Consumption Analysis 2025 & 2033
- Figure 6: North America Plant Growth Chamber Market Revenue (Million), by Import Market Analysis (Value & Volume) 2025 & 2033
- Figure 7: North America Plant Growth Chamber Market Revenue Share (%), by Import Market Analysis (Value & Volume) 2025 & 2033
- Figure 8: North America Plant Growth Chamber Market Revenue (Million), by Export Market Analysis (Value & Volume) 2025 & 2033
- Figure 9: North America Plant Growth Chamber Market Revenue Share (%), by Export Market Analysis (Value & Volume) 2025 & 2033
- Figure 10: North America Plant Growth Chamber Market Revenue (Million), by Price Trend Analysis 2025 & 2033
- Figure 11: North America Plant Growth Chamber Market Revenue Share (%), by Price Trend Analysis 2025 & 2033
- Figure 12: North America Plant Growth Chamber Market Revenue (Million), by Country 2025 & 2033
- Figure 13: North America Plant Growth Chamber Market Revenue Share (%), by Country 2025 & 2033
- Figure 14: South America Plant Growth Chamber Market Revenue (Million), by Production Analysis 2025 & 2033
- Figure 15: South America Plant Growth Chamber Market Revenue Share (%), by Production Analysis 2025 & 2033
- Figure 16: South America Plant Growth Chamber Market Revenue (Million), by Consumption Analysis 2025 & 2033
- Figure 17: South America Plant Growth Chamber Market Revenue Share (%), by Consumption Analysis 2025 & 2033
- Figure 18: South America Plant Growth Chamber Market Revenue (Million), by Import Market Analysis (Value & Volume) 2025 & 2033
- Figure 19: South America Plant Growth Chamber Market Revenue Share (%), by Import Market Analysis (Value & Volume) 2025 & 2033
- Figure 20: South America Plant Growth Chamber Market Revenue (Million), by Export Market Analysis (Value & Volume) 2025 & 2033
- Figure 21: South America Plant Growth Chamber Market Revenue Share (%), by Export Market Analysis (Value & Volume) 2025 & 2033
- Figure 22: South America Plant Growth Chamber Market Revenue (Million), by Price Trend Analysis 2025 & 2033
- Figure 23: South America Plant Growth Chamber Market Revenue Share (%), by Price Trend Analysis 2025 & 2033
- Figure 24: South America Plant Growth Chamber Market Revenue (Million), by Country 2025 & 2033
- Figure 25: South America Plant Growth Chamber Market Revenue Share (%), by Country 2025 & 2033
- Figure 26: Europe Plant Growth Chamber Market Revenue (Million), by Production Analysis 2025 & 2033
- Figure 27: Europe Plant Growth Chamber Market Revenue Share (%), by Production Analysis 2025 & 2033
- Figure 28: Europe Plant Growth Chamber Market Revenue (Million), by Consumption Analysis 2025 & 2033
- Figure 29: Europe Plant Growth Chamber Market Revenue Share (%), by Consumption Analysis 2025 & 2033
- Figure 30: Europe Plant Growth Chamber Market Revenue (Million), by Import Market Analysis (Value & Volume) 2025 & 2033
- Figure 31: Europe Plant Growth Chamber Market Revenue Share (%), by Import Market Analysis (Value & Volume) 2025 & 2033
- Figure 32: Europe Plant Growth Chamber Market Revenue (Million), by Export Market Analysis (Value & Volume) 2025 & 2033
- Figure 33: Europe Plant Growth Chamber Market Revenue Share (%), by Export Market Analysis (Value & Volume) 2025 & 2033
- Figure 34: Europe Plant Growth Chamber Market Revenue (Million), by Price Trend Analysis 2025 & 2033
- Figure 35: Europe Plant Growth Chamber Market Revenue Share (%), by Price Trend Analysis 2025 & 2033
- Figure 36: Europe Plant Growth Chamber Market Revenue (Million), by Country 2025 & 2033
- Figure 37: Europe Plant Growth Chamber Market Revenue Share (%), by Country 2025 & 2033
- Figure 38: Middle East & Africa Plant Growth Chamber Market Revenue (Million), by Production Analysis 2025 & 2033
- Figure 39: Middle East & Africa Plant Growth Chamber Market Revenue Share (%), by Production Analysis 2025 & 2033
- Figure 40: Middle East & Africa Plant Growth Chamber Market Revenue (Million), by Consumption Analysis 2025 & 2033
- Figure 41: Middle East & Africa Plant Growth Chamber Market Revenue Share (%), by Consumption Analysis 2025 & 2033
- Figure 42: Middle East & Africa Plant Growth Chamber Market Revenue (Million), by Import Market Analysis (Value & Volume) 2025 & 2033
- Figure 43: Middle East & Africa Plant Growth Chamber Market Revenue Share (%), by Import Market Analysis (Value & Volume) 2025 & 2033
- Figure 44: Middle East & Africa Plant Growth Chamber Market Revenue (Million), by Export Market Analysis (Value & Volume) 2025 & 2033
- Figure 45: Middle East & Africa Plant Growth Chamber Market Revenue Share (%), by Export Market Analysis (Value & Volume) 2025 & 2033
- Figure 46: Middle East & Africa Plant Growth Chamber Market Revenue (Million), by Price Trend Analysis 2025 & 2033
- Figure 47: Middle East & Africa Plant Growth Chamber Market Revenue Share (%), by Price Trend Analysis 2025 & 2033
- Figure 48: Middle East & Africa Plant Growth Chamber Market Revenue (Million), by Country 2025 & 2033
- Figure 49: Middle East & Africa Plant Growth Chamber Market Revenue Share (%), by Country 2025 & 2033
- Figure 50: Asia Pacific Plant Growth Chamber Market Revenue (Million), by Production Analysis 2025 & 2033
- Figure 51: Asia Pacific Plant Growth Chamber Market Revenue Share (%), by Production Analysis 2025 & 2033
- Figure 52: Asia Pacific Plant Growth Chamber Market Revenue (Million), by Consumption Analysis 2025 & 2033
- Figure 53: Asia Pacific Plant Growth Chamber Market Revenue Share (%), by Consumption Analysis 2025 & 2033
- Figure 54: Asia Pacific Plant Growth Chamber Market Revenue (Million), by Import Market Analysis (Value & Volume) 2025 & 2033
- Figure 55: Asia Pacific Plant Growth Chamber Market Revenue Share (%), by Import Market Analysis (Value & Volume) 2025 & 2033
- Figure 56: Asia Pacific Plant Growth Chamber Market Revenue (Million), by Export Market Analysis (Value & Volume) 2025 & 2033
- Figure 57: Asia Pacific Plant Growth Chamber Market Revenue Share (%), by Export Market Analysis (Value & Volume) 2025 & 2033
- Figure 58: Asia Pacific Plant Growth Chamber Market Revenue (Million), by Price Trend Analysis 2025 & 2033
- Figure 59: Asia Pacific Plant Growth Chamber Market Revenue Share (%), by Price Trend Analysis 2025 & 2033
- Figure 60: Asia Pacific Plant Growth Chamber Market Revenue (Million), by Country 2025 & 2033
- Figure 61: Asia Pacific Plant Growth Chamber Market Revenue Share (%), by Country 2025 & 2033
List of Tables
- Table 1: Global Plant Growth Chamber Market Revenue Million Forecast, by Production Analysis 2020 & 2033
- Table 2: Global Plant Growth Chamber Market Revenue Million Forecast, by Consumption Analysis 2020 & 2033
- Table 3: Global Plant Growth Chamber Market Revenue Million Forecast, by Import Market Analysis (Value & Volume) 2020 & 2033
- Table 4: Global Plant Growth Chamber Market Revenue Million Forecast, by Export Market Analysis (Value & Volume) 2020 & 2033
- Table 5: Global Plant Growth Chamber Market Revenue Million Forecast, by Price Trend Analysis 2020 & 2033
- Table 6: Global Plant Growth Chamber Market Revenue Million Forecast, by Region 2020 & 2033
- Table 7: Global Plant Growth Chamber Market Revenue Million Forecast, by Production Analysis 2020 & 2033
- Table 8: Global Plant Growth Chamber Market Revenue Million Forecast, by Consumption Analysis 2020 & 2033
- Table 9: Global Plant Growth Chamber Market Revenue Million Forecast, by Import Market Analysis (Value & Volume) 2020 & 2033
- Table 10: Global Plant Growth Chamber Market Revenue Million Forecast, by Export Market Analysis (Value & Volume) 2020 & 2033
- Table 11: Global Plant Growth Chamber Market Revenue Million Forecast, by Price Trend Analysis 2020 & 2033
- Table 12: Global Plant Growth Chamber Market Revenue Million Forecast, by Country 2020 & 2033
- Table 13: United States Plant Growth Chamber Market Revenue (Million) Forecast, by Application 2020 & 2033
- Table 14: Canada Plant Growth Chamber Market Revenue (Million) Forecast, by Application 2020 & 2033
- Table 15: Mexico Plant Growth Chamber Market Revenue (Million) Forecast, by Application 2020 & 2033
- Table 16: Global Plant Growth Chamber Market Revenue Million Forecast, by Production Analysis 2020 & 2033
- Table 17: Global Plant Growth Chamber Market Revenue Million Forecast, by Consumption Analysis 2020 & 2033
- Table 18: Global Plant Growth Chamber Market Revenue Million Forecast, by Import Market Analysis (Value & Volume) 2020 & 2033
- Table 19: Global Plant Growth Chamber Market Revenue Million Forecast, by Export Market Analysis (Value & Volume) 2020 & 2033
- Table 20: Global Plant Growth Chamber Market Revenue Million Forecast, by Price Trend Analysis 2020 & 2033
- Table 21: Global Plant Growth Chamber Market Revenue Million Forecast, by Country 2020 & 2033
- Table 22: Brazil Plant Growth Chamber Market Revenue (Million) Forecast, by Application 2020 & 2033
- Table 23: Argentina Plant Growth Chamber Market Revenue (Million) Forecast, by Application 2020 & 2033
- Table 24: Rest of South America Plant Growth Chamber Market Revenue (Million) Forecast, by Application 2020 & 2033
- Table 25: Global Plant Growth Chamber Market Revenue Million Forecast, by Production Analysis 2020 & 2033
- Table 26: Global Plant Growth Chamber Market Revenue Million Forecast, by Consumption Analysis 2020 & 2033
- Table 27: Global Plant Growth Chamber Market Revenue Million Forecast, by Import Market Analysis (Value & Volume) 2020 & 2033
- Table 28: Global Plant Growth Chamber Market Revenue Million Forecast, by Export Market Analysis (Value & Volume) 2020 & 2033
- Table 29: Global Plant Growth Chamber Market Revenue Million Forecast, by Price Trend Analysis 2020 & 2033
- Table 30: Global Plant Growth Chamber Market Revenue Million Forecast, by Country 2020 & 2033
- Table 31: United Kingdom Plant Growth Chamber Market Revenue (Million) Forecast, by Application 2020 & 2033
- Table 32: Germany Plant Growth Chamber Market Revenue (Million) Forecast, by Application 2020 & 2033
- Table 33: France Plant Growth Chamber Market Revenue (Million) Forecast, by Application 2020 & 2033
- Table 34: Italy Plant Growth Chamber Market Revenue (Million) Forecast, by Application 2020 & 2033
- Table 35: Spain Plant Growth Chamber Market Revenue (Million) Forecast, by Application 2020 & 2033
- Table 36: Russia Plant Growth Chamber Market Revenue (Million) Forecast, by Application 2020 & 2033
- Table 37: Benelux Plant Growth Chamber Market Revenue (Million) Forecast, by Application 2020 & 2033
- Table 38: Nordics Plant Growth Chamber Market Revenue (Million) Forecast, by Application 2020 & 2033
- Table 39: Rest of Europe Plant Growth Chamber Market Revenue (Million) Forecast, by Application 2020 & 2033
- Table 40: Global Plant Growth Chamber Market Revenue Million Forecast, by Production Analysis 2020 & 2033
- Table 41: Global Plant Growth Chamber Market Revenue Million Forecast, by Consumption Analysis 2020 & 2033
- Table 42: Global Plant Growth Chamber Market Revenue Million Forecast, by Import Market Analysis (Value & Volume) 2020 & 2033
- Table 43: Global Plant Growth Chamber Market Revenue Million Forecast, by Export Market Analysis (Value & Volume) 2020 & 2033
- Table 44: Global Plant Growth Chamber Market Revenue Million Forecast, by Price Trend Analysis 2020 & 2033
- Table 45: Global Plant Growth Chamber Market Revenue Million Forecast, by Country 2020 & 2033
- Table 46: Turkey Plant Growth Chamber Market Revenue (Million) Forecast, by Application 2020 & 2033
- Table 47: Israel Plant Growth Chamber Market Revenue (Million) Forecast, by Application 2020 & 2033
- Table 48: GCC Plant Growth Chamber Market Revenue (Million) Forecast, by Application 2020 & 2033
- Table 49: North Africa Plant Growth Chamber Market Revenue (Million) Forecast, by Application 2020 & 2033
- Table 50: South Africa Plant Growth Chamber Market Revenue (Million) Forecast, by Application 2020 & 2033
- Table 51: Rest of Middle East & Africa Plant Growth Chamber Market Revenue (Million) Forecast, by Application 2020 & 2033
- Table 52: Global Plant Growth Chamber Market Revenue Million Forecast, by Production Analysis 2020 & 2033
- Table 53: Global Plant Growth Chamber Market Revenue Million Forecast, by Consumption Analysis 2020 & 2033
- Table 54: Global Plant Growth Chamber Market Revenue Million Forecast, by Import Market Analysis (Value & Volume) 2020 & 2033
- Table 55: Global Plant Growth Chamber Market Revenue Million Forecast, by Export Market Analysis (Value & Volume) 2020 & 2033
- Table 56: Global Plant Growth Chamber Market Revenue Million Forecast, by Price Trend Analysis 2020 & 2033
- Table 57: Global Plant Growth Chamber Market Revenue Million Forecast, by Country 2020 & 2033
- Table 58: China Plant Growth Chamber Market Revenue (Million) Forecast, by Application 2020 & 2033
- Table 59: India Plant Growth Chamber Market Revenue (Million) Forecast, by Application 2020 & 2033
- Table 60: Japan Plant Growth Chamber Market Revenue (Million) Forecast, by Application 2020 & 2033
- Table 61: South Korea Plant Growth Chamber Market Revenue (Million) Forecast, by Application 2020 & 2033
- Table 62: ASEAN Plant Growth Chamber Market Revenue (Million) Forecast, by Application 2020 & 2033
- Table 63: Oceania Plant Growth Chamber Market Revenue (Million) Forecast, by Application 2020 & 2033
- Table 64: Rest of Asia Pacific Plant Growth Chamber Market Revenue (Million) Forecast, by Application 2020 & 2033
Frequently Asked Questions
1. What is the projected Compound Annual Growth Rate (CAGR) of the Plant Growth Chamber Market?
The projected CAGR is approximately 4.70%.
2. Which companies are prominent players in the Plant Growth Chamber Market?
Key companies in the market include Weiss Techni, Darwin Chambers, Thermo Fisher, CARON Products & Services Inc, Conviron, Aralab, Percival Scientific Inc, Brs Bvba, BINDER GmbH, Hettich Benelux BV, Saveer Biotech Limited, Freezers India.
3. What are the main segments of the Plant Growth Chamber Market?
The market segments include Production Analysis, Consumption Analysis, Import Market Analysis (Value & Volume), Export Market Analysis (Value & Volume), Price Trend Analysis.
4. Can you provide details about the market size?
The market size is estimated to be USD 486.60 Million as of 2022.
5. What are some drivers contributing to market growth?
Seed Treatment As A Solution To Enhance Yield; Growing Awareness For Seed Treatment Among The Farmers; Rising Trend Of Organic Farming.
6. What are the notable trends driving market growth?
Increasing Demand for Food and Decreasing Arable Land.
7. Are there any restraints impacting market growth?
Limitations Across Farm-Level Seed Treatment; Rising Environmental Concerns.
8. Can you provide examples of recent developments in the market?
January 2022: Conviron launched a new EVO series of plant growth chambers, featuring a range of LE intensities, delivering a high degree of spatial uniformity for plant growth suitable for both short, medium, and tall plants.
9. What pricing options are available for accessing the report?
Pricing options include single-user, multi-user, and enterprise licenses priced at USD 4750, USD 5250, and USD 8750 respectively.
10. Is the market size provided in terms of value or volume?
The market size is provided in terms of value, measured in Million.
11. Are there any specific market keywords associated with the report?
Yes, the market keyword associated with the report is "Plant Growth Chamber Market," which aids in identifying and referencing the specific market segment covered.
12. How do I determine which pricing option suits my needs best?
The pricing options vary based on user requirements and access needs. Individual users may opt for single-user licenses, while businesses requiring broader access may choose multi-user or enterprise licenses for cost-effective access to the report.
13. Are there any additional resources or data provided in the Plant Growth Chamber Market report?
While the report offers comprehensive insights, it's advisable to review the specific contents or supplementary materials provided to ascertain if additional resources or data are available.
14. How can I stay updated on further developments or reports in the Plant Growth Chamber Market?
To stay informed about further developments, trends, and reports in the Plant Growth Chamber Market, consider subscribing to industry newsletters, following relevant companies and organizations, or regularly checking reputable industry news sources and publications.
Methodology
Step 1 - Identification of Relevant Samples Size from Population Database


Step 2 - Approaches for Defining Global Market Size (Value, Volume* & Price*)

Note*: In applicable scenarios
Step 3 - Data Sources
Primary Research
- Web Analytics
- Survey Reports
- Research Institute
- Latest Research Reports
- Opinion Leaders
Secondary Research
- Annual Reports
- White Paper
- Latest Press Release
- Industry Association
- Paid Database
- Investor Presentations

Step 4 - Data Triangulation
Involves using different sources of information in order to increase the validity of a study
These sources are likely to be stakeholders in a program - participants, other researchers, program staff, other community members, and so on.
Then we put all data in single framework & apply various statistical tools to find out the dynamic on the market.
During the analysis stage, feedback from the stakeholder groups would be compared to determine areas of agreement as well as areas of divergence