


Key Insights
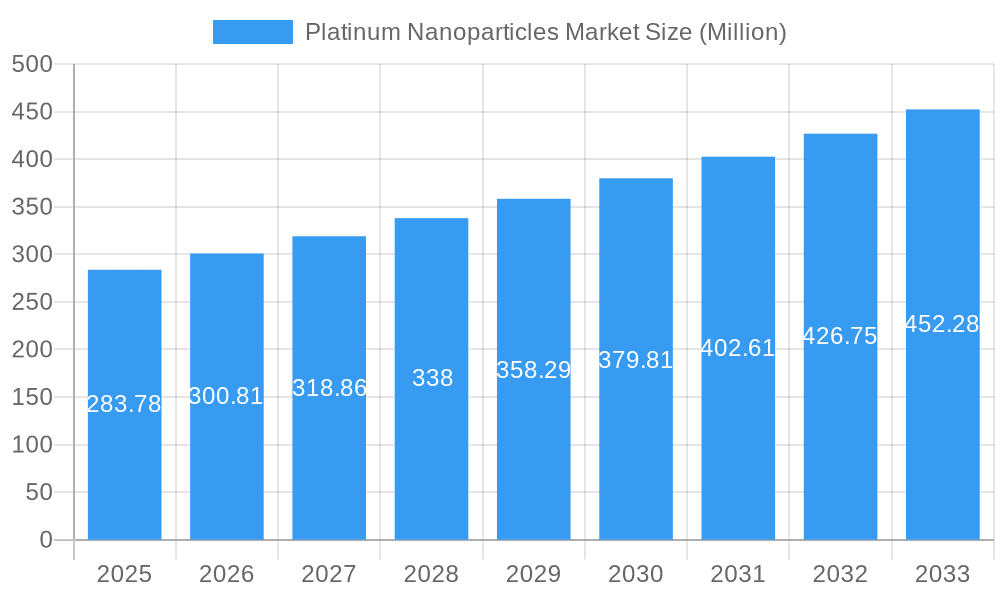
The Platinum Nanoparticles market, valued at $283.78 million in 2025, is projected to experience robust growth, driven by increasing demand across diverse sectors. A compound annual growth rate (CAGR) of 6% from 2025 to 2033 indicates a significant expansion of the market to over $470 million by 2033. This growth is fueled primarily by the unique catalytic properties of platinum nanoparticles, making them crucial in applications ranging from automotive catalysis (exhaust emission control) and healthcare (drug delivery and diagnostics) to chemical processes and advanced materials manufacturing. The market segmentation reveals a strong presence of spherical nanoparticles, although other shapes like cubes and squares are gaining traction due to their specialized functionalities. Geographically, North America and Europe currently hold significant market shares, attributed to well-established research infrastructure and early adoption of nanotechnology. However, the Asia-Pacific region is poised for rapid growth, fueled by rising industrialization and increasing investments in nanotechnology research and development within countries like China, India, and Japan. Competitive landscape analysis suggests a mix of established chemical companies and specialized nanomaterial producers, creating a dynamic and innovative market.
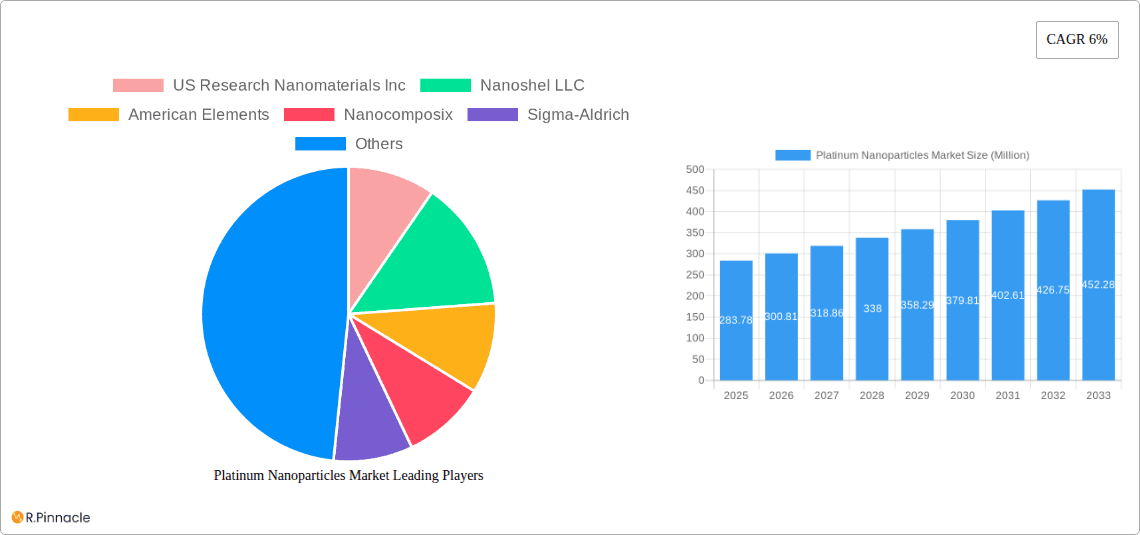
Platinum Nanoparticles Market Market Size (In Million)

The continued advancements in nanotechnology, coupled with increasing research and development efforts focused on improving the synthesis, functionalization, and characterization of platinum nanoparticles, will likely accelerate market growth. Stringent environmental regulations related to emissions and waste management are also driving the demand for efficient catalytic converters using platinum nanoparticles. While cost constraints and safety concerns surrounding the handling and disposal of nanoparticles remain challenges, the overall market outlook remains positive, driven by the versatile applications and significant potential for innovation. Future growth will likely depend on overcoming these hurdles, further enhancing the functionalities of these nanoparticles, and exploring new applications in emerging fields such as energy storage and electronics. The development of sustainable and cost-effective production methods will also play a vital role in shaping the market's trajectory.
Platinum Nanoparticles Market Company Market Share
Platinum Nanoparticles Market Report: A Comprehensive Analysis (2019-2033)
This comprehensive report provides an in-depth analysis of the Platinum Nanoparticles Market, offering invaluable insights for industry professionals, investors, and strategic decision-makers. Covering the period from 2019 to 2033, with a base year of 2025, this report meticulously examines market dynamics, growth drivers, challenges, and future opportunities. The report segments the market by product type (Spherical, Cube, Square, Others) and end-user industry (Automotive, Health Care, Chemical, Others), providing granular data for informed strategic planning. The market is projected to reach xx Million by 2033, exhibiting a CAGR of xx% during the forecast period (2025-2033).
Platinum Nanoparticles Market Market Structure & Innovation Trends
The Platinum Nanoparticles market exhibits a moderately concentrated structure, with key players holding significant market share. US Research Nanomaterials Inc., Nanoshel LLC, and American Elements are among the leading companies, collectively accounting for an estimated xx% of the market in 2025. Innovation is driven by the increasing demand for advanced materials in diverse sectors, including healthcare and automotive. Stringent regulatory frameworks concerning nanoparticle safety and environmental impact influence product development and market access. Product substitutes, such as alternative catalytic materials, present competitive pressures. The market has witnessed several M&A activities in recent years, with deal values totaling approximately xx Million in the last five years. End-user demographics show a strong correlation between market growth and technological advancements in key sectors.
- Market Concentration: Moderately concentrated, with top 3 players holding xx% market share (2025).
- Innovation Drivers: Demand for advanced materials in healthcare and automotive.
- Regulatory Landscape: Stringent regulations impacting product development and market access.
- M&A Activity: Total deal value of approximately xx Million over the past five years.
Platinum Nanoparticles Market Market Dynamics & Trends
The Platinum Nanoparticles market is experiencing robust growth fueled by several key factors. Technological advancements in synthesis methods are leading to improved particle quality and reduced production costs. The rising demand for efficient catalysts in the automotive industry and targeted drug delivery systems in healthcare are significant market drivers. Consumer preferences are shifting towards sustainable and environmentally friendly materials, which is creating opportunities for platinum nanoparticles with enhanced biocompatibility and recyclability. Competitive dynamics are characterized by ongoing innovation, strategic partnerships, and expansion into new markets. The market is expected to witness a CAGR of xx% from 2025 to 2033, with market penetration increasing significantly in emerging economies.
Dominant Regions & Segments in Platinum Nanoparticles Market
North America currently holds the largest market share in the Platinum Nanoparticles market, driven by strong demand from the healthcare and automotive sectors. The region benefits from well-established research infrastructure and a high concentration of leading companies. Within product segments, spherical platinum nanoparticles dominate, accounting for an estimated xx% of the market in 2025 due to their ease of synthesis and broad applicability. In terms of end-user industries, the healthcare sector shows the fastest growth rate, fueled by advancements in nanomedicine and drug delivery.
- Key Drivers for North America Dominance: Strong R&D infrastructure, high demand from healthcare and automotive.
- Spherical Nanoparticles Dominance: Ease of synthesis and wide-ranging applications.
- Healthcare Sector Growth: Advancements in nanomedicine and drug delivery.
Platinum Nanoparticles Market Product Innovations
Recent product innovations focus on improving the monodispersity and surface functionalization of platinum nanoparticles. This enhances their catalytic activity, biocompatibility, and suitability for specific applications. New applications are emerging in areas like biosensors, fuel cells, and water purification. The competitive advantage lies in developing highly customized nanoparticles with superior performance characteristics tailored to specific end-user needs.
Report Scope & Segmentation Analysis
This report comprehensively analyzes the Platinum Nanoparticles market, segmented by product type (Spherical, Cube, Square, Others) and end-user industry (Automotive, Healthcare, Chemical, Others). Each segment's growth trajectory, market size, and competitive landscape are analyzed. The report projects significant growth across all segments, with the healthcare sector anticipated to experience the most rapid expansion.
- Product Segmentation: Spherical, Cube, Square, Others – Each segment exhibits distinct growth potential and competitive dynamics.
- End-user Industry Segmentation: Automotive, Healthcare, Chemical, Others – Market size and growth projections for each segment are provided.
Key Drivers of Platinum Nanoparticles Market Growth
Several factors propel the growth of the Platinum Nanoparticles market. Technological advancements in nanoparticle synthesis and functionalization are leading to improved performance and cost-effectiveness. The increasing demand for efficient catalysts in various industrial processes and the expanding use of platinum nanoparticles in biomedical applications are key drivers. Favorable government regulations and supportive policies in several countries are also fostering market growth.
Challenges in the Platinum Nanoparticles Market Sector
The Platinum Nanoparticles market faces several challenges. The high cost of platinum and the complexities involved in its synthesis can limit widespread adoption. Concerns about the potential toxicity of nanoparticles and the need for robust safety and environmental regulations pose barriers. Intense competition among established players and emerging companies also presents challenges.
Emerging Opportunities in Platinum Nanoparticles Market
Emerging opportunities exist in developing novel applications for platinum nanoparticles in areas like electronics, energy storage, and environmental remediation. The growing demand for sustainable and environmentally friendly materials presents opportunities for developing platinum nanoparticles with improved biocompatibility and recyclability. Expansion into emerging markets with high growth potential offers significant opportunities for market players.
Leading Players in the Platinum Nanoparticles Market Market
- US Research Nanomaterials Inc.
- Nanoshel LLC
- American Elements
- Nanocomposix
- Sigma-Aldrich
- NanoBio Chemicals India Pvt Ltd
- TANAKA HOLDINGS Co Ltd
- Nanostructured & Amorphous Materials Inc
- Metrohm India Limited
- HiQ-Nano s r l
- Strem Chemicals Inc
- PlasmaChem GmbH
- Meliorum Technologies Inc
- Particular GMBH
- NANOCHEMAZONE
Key Developments in Platinum Nanoparticles Market Industry
- 2022 Q4: Nanocomposix launched a new line of functionalized platinum nanoparticles for biomedical applications.
- 2023 Q1: American Elements announced a strategic partnership to expand its distribution network in Asia.
- 2023 Q2: Sigma-Aldrich introduced a new high-purity platinum nanoparticle product with enhanced catalytic activity. (Add further developments with year/month and impact)
Future Outlook for Platinum Nanoparticles Market Market
The Platinum Nanoparticles market is poised for significant growth in the coming years, driven by technological advancements, expanding applications, and increasing demand from various sectors. Strategic partnerships, product innovations, and expansion into new markets will be crucial for success in this dynamic market. The market's future potential is substantial, offering attractive opportunities for investors and businesses.
Platinum Nanoparticles Market Segmentation
-
1. Product
- 1.1. Spherical
- 1.2. Cube
- 1.3. Square
- 1.4. Others
-
2. End-user Industry
- 2.1. Automotive
- 2.2. Health Care
- 2.3. Chemical
- 2.4. Others
Platinum Nanoparticles Market Segmentation By Geography
-
1. Asia Pacific
- 1.1. China
- 1.2. India
- 1.3. Japan
- 1.4. South Korea
- 1.5. Rest of Asia Pacific
-
2. North America
- 2.1. United States
- 2.2. Canada
- 2.3. Mexico
-
3. Europe
- 3.1. Germany
- 3.2. United Kingdom
- 3.3. France
- 3.4. Italy
- 3.5. Rest of Europe
-
4. South America
- 4.1. Brazil
- 4.2. Argentina
- 4.3. Rest of South America
-
5. Middle East and Africa
- 5.1. Saudi Arabia
- 5.2. South Africa
- 5.3. Rest of Middle East and Africa
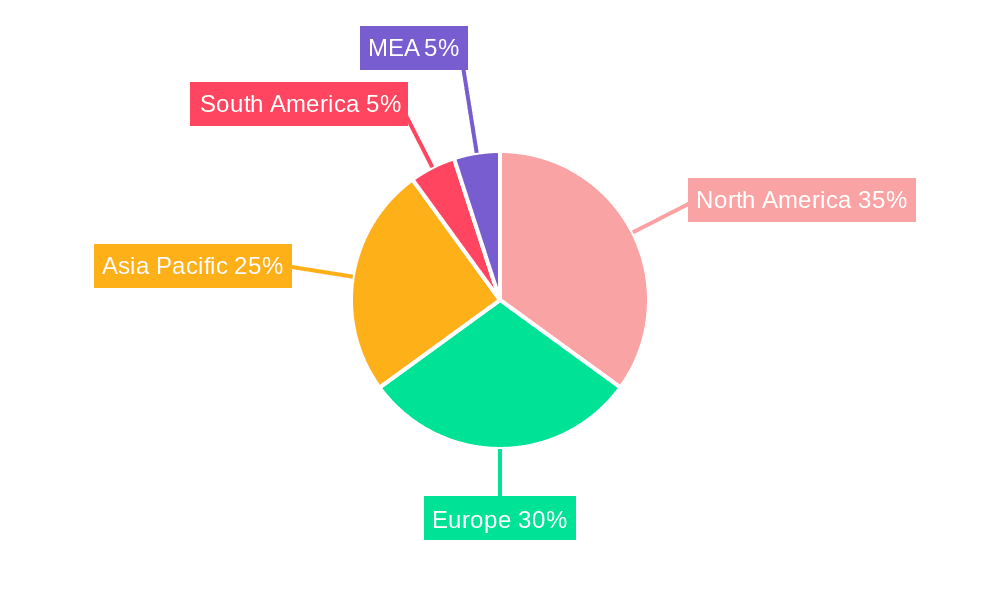
Platinum Nanoparticles Market Regional Market Share
Geographic Coverage of Platinum Nanoparticles Market
Platinum Nanoparticles Market REPORT HIGHLIGHTS
| Aspects | Details |
|---|---|
| Study Period | 2020-2034 |
| Base Year | 2025 |
| Estimated Year | 2026 |
| Forecast Period | 2026-2034 |
| Historical Period | 2020-2025 |
| Growth Rate | CAGR of 6% from 2020-2034 |
| Segmentation |
|
Table of Contents
- 1. Introduction
- 1.1. Research Scope
- 1.2. Market Segmentation
- 1.3. Research Methodology
- 1.4. Definitions and Assumptions
- 2. Executive Summary
- 2.1. Introduction
- 3. Market Dynamics
- 3.1. Introduction
- 3.2. Market Drivers
- 3.2.1. ; Growing Health Care Industry; Other Drivers
- 3.3. Market Restrains
- 3.3.1. ; Toxic Nature of Platinum Nanoparticles; Unfavorable Conditions in Non-medical End-user Industries Arising Due to COVID-19 Outbreak
- 3.4. Market Trends
- 3.4.1. Health Care Segment to Dominate the Market
- 4. Market Factor Analysis
- 4.1. Porters Five Forces
- 4.2. Supply/Value Chain
- 4.3. PESTEL analysis
- 4.4. Market Entropy
- 4.5. Patent/Trademark Analysis
- 5. Global Platinum Nanoparticles Market Analysis, Insights and Forecast, 2020-2032
- 5.1. Market Analysis, Insights and Forecast - by Product
- 5.1.1. Spherical
- 5.1.2. Cube
- 5.1.3. Square
- 5.1.4. Others
- 5.2. Market Analysis, Insights and Forecast - by End-user Industry
- 5.2.1. Automotive
- 5.2.2. Health Care
- 5.2.3. Chemical
- 5.2.4. Others
- 5.3. Market Analysis, Insights and Forecast - by Region
- 5.3.1. Asia Pacific
- 5.3.2. North America
- 5.3.3. Europe
- 5.3.4. South America
- 5.3.5. Middle East and Africa
- 5.1. Market Analysis, Insights and Forecast - by Product
- 6. Asia Pacific Platinum Nanoparticles Market Analysis, Insights and Forecast, 2020-2032
- 6.1. Market Analysis, Insights and Forecast - by Product
- 6.1.1. Spherical
- 6.1.2. Cube
- 6.1.3. Square
- 6.1.4. Others
- 6.2. Market Analysis, Insights and Forecast - by End-user Industry
- 6.2.1. Automotive
- 6.2.2. Health Care
- 6.2.3. Chemical
- 6.2.4. Others
- 6.1. Market Analysis, Insights and Forecast - by Product
- 7. North America Platinum Nanoparticles Market Analysis, Insights and Forecast, 2020-2032
- 7.1. Market Analysis, Insights and Forecast - by Product
- 7.1.1. Spherical
- 7.1.2. Cube
- 7.1.3. Square
- 7.1.4. Others
- 7.2. Market Analysis, Insights and Forecast - by End-user Industry
- 7.2.1. Automotive
- 7.2.2. Health Care
- 7.2.3. Chemical
- 7.2.4. Others
- 7.1. Market Analysis, Insights and Forecast - by Product
- 8. Europe Platinum Nanoparticles Market Analysis, Insights and Forecast, 2020-2032
- 8.1. Market Analysis, Insights and Forecast - by Product
- 8.1.1. Spherical
- 8.1.2. Cube
- 8.1.3. Square
- 8.1.4. Others
- 8.2. Market Analysis, Insights and Forecast - by End-user Industry
- 8.2.1. Automotive
- 8.2.2. Health Care
- 8.2.3. Chemical
- 8.2.4. Others
- 8.1. Market Analysis, Insights and Forecast - by Product
- 9. South America Platinum Nanoparticles Market Analysis, Insights and Forecast, 2020-2032
- 9.1. Market Analysis, Insights and Forecast - by Product
- 9.1.1. Spherical
- 9.1.2. Cube
- 9.1.3. Square
- 9.1.4. Others
- 9.2. Market Analysis, Insights and Forecast - by End-user Industry
- 9.2.1. Automotive
- 9.2.2. Health Care
- 9.2.3. Chemical
- 9.2.4. Others
- 9.1. Market Analysis, Insights and Forecast - by Product
- 10. Middle East and Africa Platinum Nanoparticles Market Analysis, Insights and Forecast, 2020-2032
- 10.1. Market Analysis, Insights and Forecast - by Product
- 10.1.1. Spherical
- 10.1.2. Cube
- 10.1.3. Square
- 10.1.4. Others
- 10.2. Market Analysis, Insights and Forecast - by End-user Industry
- 10.2.1. Automotive
- 10.2.2. Health Care
- 10.2.3. Chemical
- 10.2.4. Others
- 10.1. Market Analysis, Insights and Forecast - by Product
- 11. Competitive Analysis
- 11.1. Global Market Share Analysis 2025
- 11.2. Company Profiles
- 11.2.1 US Research Nanomaterials Inc
- 11.2.1.1. Overview
- 11.2.1.2. Products
- 11.2.1.3. SWOT Analysis
- 11.2.1.4. Recent Developments
- 11.2.1.5. Financials (Based on Availability)
- 11.2.2 Nanoshel LLC
- 11.2.2.1. Overview
- 11.2.2.2. Products
- 11.2.2.3. SWOT Analysis
- 11.2.2.4. Recent Developments
- 11.2.2.5. Financials (Based on Availability)
- 11.2.3 American Elements
- 11.2.3.1. Overview
- 11.2.3.2. Products
- 11.2.3.3. SWOT Analysis
- 11.2.3.4. Recent Developments
- 11.2.3.5. Financials (Based on Availability)
- 11.2.4 Nanocomposix
- 11.2.4.1. Overview
- 11.2.4.2. Products
- 11.2.4.3. SWOT Analysis
- 11.2.4.4. Recent Developments
- 11.2.4.5. Financials (Based on Availability)
- 11.2.5 Sigma-Aldrich
- 11.2.5.1. Overview
- 11.2.5.2. Products
- 11.2.5.3. SWOT Analysis
- 11.2.5.4. Recent Developments
- 11.2.5.5. Financials (Based on Availability)
- 11.2.6 NanoBio Chemicals India Pvt Ltd
- 11.2.6.1. Overview
- 11.2.6.2. Products
- 11.2.6.3. SWOT Analysis
- 11.2.6.4. Recent Developments
- 11.2.6.5. Financials (Based on Availability)
- 11.2.7 TANAKA HOLDINGS Co Ltd
- 11.2.7.1. Overview
- 11.2.7.2. Products
- 11.2.7.3. SWOT Analysis
- 11.2.7.4. Recent Developments
- 11.2.7.5. Financials (Based on Availability)
- 11.2.8 Nanostructured & Amorphous Materials Inc
- 11.2.8.1. Overview
- 11.2.8.2. Products
- 11.2.8.3. SWOT Analysis
- 11.2.8.4. Recent Developments
- 11.2.8.5. Financials (Based on Availability)
- 11.2.9 Metrohm India Limited
- 11.2.9.1. Overview
- 11.2.9.2. Products
- 11.2.9.3. SWOT Analysis
- 11.2.9.4. Recent Developments
- 11.2.9.5. Financials (Based on Availability)
- 11.2.10 HiQ-Nano s r l
- 11.2.10.1. Overview
- 11.2.10.2. Products
- 11.2.10.3. SWOT Analysis
- 11.2.10.4. Recent Developments
- 11.2.10.5. Financials (Based on Availability)
- 11.2.11 Strem Chemicals Inc
- 11.2.11.1. Overview
- 11.2.11.2. Products
- 11.2.11.3. SWOT Analysis
- 11.2.11.4. Recent Developments
- 11.2.11.5. Financials (Based on Availability)
- 11.2.12 PlasmaChem GmbH
- 11.2.12.1. Overview
- 11.2.12.2. Products
- 11.2.12.3. SWOT Analysis
- 11.2.12.4. Recent Developments
- 11.2.12.5. Financials (Based on Availability)
- 11.2.13 Meliorum Technologies Inc
- 11.2.13.1. Overview
- 11.2.13.2. Products
- 11.2.13.3. SWOT Analysis
- 11.2.13.4. Recent Developments
- 11.2.13.5. Financials (Based on Availability)
- 11.2.14 Particular GMBH
- 11.2.14.1. Overview
- 11.2.14.2. Products
- 11.2.14.3. SWOT Analysis
- 11.2.14.4. Recent Developments
- 11.2.14.5. Financials (Based on Availability)
- 11.2.15 NANOCHEMAZONE
- 11.2.15.1. Overview
- 11.2.15.2. Products
- 11.2.15.3. SWOT Analysis
- 11.2.15.4. Recent Developments
- 11.2.15.5. Financials (Based on Availability)
- 11.2.1 US Research Nanomaterials Inc
List of Figures
- Figure 1: Global Platinum Nanoparticles Market Revenue Breakdown (Million, %) by Region 2025 & 2033
- Figure 2: Global Platinum Nanoparticles Market Volume Breakdown (K Tons, %) by Region 2025 & 2033
- Figure 3: Asia Pacific Platinum Nanoparticles Market Revenue (Million), by Product 2025 & 2033
- Figure 4: Asia Pacific Platinum Nanoparticles Market Volume (K Tons), by Product 2025 & 2033
- Figure 5: Asia Pacific Platinum Nanoparticles Market Revenue Share (%), by Product 2025 & 2033
- Figure 6: Asia Pacific Platinum Nanoparticles Market Volume Share (%), by Product 2025 & 2033
- Figure 7: Asia Pacific Platinum Nanoparticles Market Revenue (Million), by End-user Industry 2025 & 2033
- Figure 8: Asia Pacific Platinum Nanoparticles Market Volume (K Tons), by End-user Industry 2025 & 2033
- Figure 9: Asia Pacific Platinum Nanoparticles Market Revenue Share (%), by End-user Industry 2025 & 2033
- Figure 10: Asia Pacific Platinum Nanoparticles Market Volume Share (%), by End-user Industry 2025 & 2033
- Figure 11: Asia Pacific Platinum Nanoparticles Market Revenue (Million), by Country 2025 & 2033
- Figure 12: Asia Pacific Platinum Nanoparticles Market Volume (K Tons), by Country 2025 & 2033
- Figure 13: Asia Pacific Platinum Nanoparticles Market Revenue Share (%), by Country 2025 & 2033
- Figure 14: Asia Pacific Platinum Nanoparticles Market Volume Share (%), by Country 2025 & 2033
- Figure 15: North America Platinum Nanoparticles Market Revenue (Million), by Product 2025 & 2033
- Figure 16: North America Platinum Nanoparticles Market Volume (K Tons), by Product 2025 & 2033
- Figure 17: North America Platinum Nanoparticles Market Revenue Share (%), by Product 2025 & 2033
- Figure 18: North America Platinum Nanoparticles Market Volume Share (%), by Product 2025 & 2033
- Figure 19: North America Platinum Nanoparticles Market Revenue (Million), by End-user Industry 2025 & 2033
- Figure 20: North America Platinum Nanoparticles Market Volume (K Tons), by End-user Industry 2025 & 2033
- Figure 21: North America Platinum Nanoparticles Market Revenue Share (%), by End-user Industry 2025 & 2033
- Figure 22: North America Platinum Nanoparticles Market Volume Share (%), by End-user Industry 2025 & 2033
- Figure 23: North America Platinum Nanoparticles Market Revenue (Million), by Country 2025 & 2033
- Figure 24: North America Platinum Nanoparticles Market Volume (K Tons), by Country 2025 & 2033
- Figure 25: North America Platinum Nanoparticles Market Revenue Share (%), by Country 2025 & 2033
- Figure 26: North America Platinum Nanoparticles Market Volume Share (%), by Country 2025 & 2033
- Figure 27: Europe Platinum Nanoparticles Market Revenue (Million), by Product 2025 & 2033
- Figure 28: Europe Platinum Nanoparticles Market Volume (K Tons), by Product 2025 & 2033
- Figure 29: Europe Platinum Nanoparticles Market Revenue Share (%), by Product 2025 & 2033
- Figure 30: Europe Platinum Nanoparticles Market Volume Share (%), by Product 2025 & 2033
- Figure 31: Europe Platinum Nanoparticles Market Revenue (Million), by End-user Industry 2025 & 2033
- Figure 32: Europe Platinum Nanoparticles Market Volume (K Tons), by End-user Industry 2025 & 2033
- Figure 33: Europe Platinum Nanoparticles Market Revenue Share (%), by End-user Industry 2025 & 2033
- Figure 34: Europe Platinum Nanoparticles Market Volume Share (%), by End-user Industry 2025 & 2033
- Figure 35: Europe Platinum Nanoparticles Market Revenue (Million), by Country 2025 & 2033
- Figure 36: Europe Platinum Nanoparticles Market Volume (K Tons), by Country 2025 & 2033
- Figure 37: Europe Platinum Nanoparticles Market Revenue Share (%), by Country 2025 & 2033
- Figure 38: Europe Platinum Nanoparticles Market Volume Share (%), by Country 2025 & 2033
- Figure 39: South America Platinum Nanoparticles Market Revenue (Million), by Product 2025 & 2033
- Figure 40: South America Platinum Nanoparticles Market Volume (K Tons), by Product 2025 & 2033
- Figure 41: South America Platinum Nanoparticles Market Revenue Share (%), by Product 2025 & 2033
- Figure 42: South America Platinum Nanoparticles Market Volume Share (%), by Product 2025 & 2033
- Figure 43: South America Platinum Nanoparticles Market Revenue (Million), by End-user Industry 2025 & 2033
- Figure 44: South America Platinum Nanoparticles Market Volume (K Tons), by End-user Industry 2025 & 2033
- Figure 45: South America Platinum Nanoparticles Market Revenue Share (%), by End-user Industry 2025 & 2033
- Figure 46: South America Platinum Nanoparticles Market Volume Share (%), by End-user Industry 2025 & 2033
- Figure 47: South America Platinum Nanoparticles Market Revenue (Million), by Country 2025 & 2033
- Figure 48: South America Platinum Nanoparticles Market Volume (K Tons), by Country 2025 & 2033
- Figure 49: South America Platinum Nanoparticles Market Revenue Share (%), by Country 2025 & 2033
- Figure 50: South America Platinum Nanoparticles Market Volume Share (%), by Country 2025 & 2033
- Figure 51: Middle East and Africa Platinum Nanoparticles Market Revenue (Million), by Product 2025 & 2033
- Figure 52: Middle East and Africa Platinum Nanoparticles Market Volume (K Tons), by Product 2025 & 2033
- Figure 53: Middle East and Africa Platinum Nanoparticles Market Revenue Share (%), by Product 2025 & 2033
- Figure 54: Middle East and Africa Platinum Nanoparticles Market Volume Share (%), by Product 2025 & 2033
- Figure 55: Middle East and Africa Platinum Nanoparticles Market Revenue (Million), by End-user Industry 2025 & 2033
- Figure 56: Middle East and Africa Platinum Nanoparticles Market Volume (K Tons), by End-user Industry 2025 & 2033
- Figure 57: Middle East and Africa Platinum Nanoparticles Market Revenue Share (%), by End-user Industry 2025 & 2033
- Figure 58: Middle East and Africa Platinum Nanoparticles Market Volume Share (%), by End-user Industry 2025 & 2033
- Figure 59: Middle East and Africa Platinum Nanoparticles Market Revenue (Million), by Country 2025 & 2033
- Figure 60: Middle East and Africa Platinum Nanoparticles Market Volume (K Tons), by Country 2025 & 2033
- Figure 61: Middle East and Africa Platinum Nanoparticles Market Revenue Share (%), by Country 2025 & 2033
- Figure 62: Middle East and Africa Platinum Nanoparticles Market Volume Share (%), by Country 2025 & 2033
List of Tables
- Table 1: Global Platinum Nanoparticles Market Revenue Million Forecast, by Product 2020 & 2033
- Table 2: Global Platinum Nanoparticles Market Volume K Tons Forecast, by Product 2020 & 2033
- Table 3: Global Platinum Nanoparticles Market Revenue Million Forecast, by End-user Industry 2020 & 2033
- Table 4: Global Platinum Nanoparticles Market Volume K Tons Forecast, by End-user Industry 2020 & 2033
- Table 5: Global Platinum Nanoparticles Market Revenue Million Forecast, by Region 2020 & 2033
- Table 6: Global Platinum Nanoparticles Market Volume K Tons Forecast, by Region 2020 & 2033
- Table 7: Global Platinum Nanoparticles Market Revenue Million Forecast, by Product 2020 & 2033
- Table 8: Global Platinum Nanoparticles Market Volume K Tons Forecast, by Product 2020 & 2033
- Table 9: Global Platinum Nanoparticles Market Revenue Million Forecast, by End-user Industry 2020 & 2033
- Table 10: Global Platinum Nanoparticles Market Volume K Tons Forecast, by End-user Industry 2020 & 2033
- Table 11: Global Platinum Nanoparticles Market Revenue Million Forecast, by Country 2020 & 2033
- Table 12: Global Platinum Nanoparticles Market Volume K Tons Forecast, by Country 2020 & 2033
- Table 13: China Platinum Nanoparticles Market Revenue (Million) Forecast, by Application 2020 & 2033
- Table 14: China Platinum Nanoparticles Market Volume (K Tons) Forecast, by Application 2020 & 2033
- Table 15: India Platinum Nanoparticles Market Revenue (Million) Forecast, by Application 2020 & 2033
- Table 16: India Platinum Nanoparticles Market Volume (K Tons) Forecast, by Application 2020 & 2033
- Table 17: Japan Platinum Nanoparticles Market Revenue (Million) Forecast, by Application 2020 & 2033
- Table 18: Japan Platinum Nanoparticles Market Volume (K Tons) Forecast, by Application 2020 & 2033
- Table 19: South Korea Platinum Nanoparticles Market Revenue (Million) Forecast, by Application 2020 & 2033
- Table 20: South Korea Platinum Nanoparticles Market Volume (K Tons) Forecast, by Application 2020 & 2033
- Table 21: Rest of Asia Pacific Platinum Nanoparticles Market Revenue (Million) Forecast, by Application 2020 & 2033
- Table 22: Rest of Asia Pacific Platinum Nanoparticles Market Volume (K Tons) Forecast, by Application 2020 & 2033
- Table 23: Global Platinum Nanoparticles Market Revenue Million Forecast, by Product 2020 & 2033
- Table 24: Global Platinum Nanoparticles Market Volume K Tons Forecast, by Product 2020 & 2033
- Table 25: Global Platinum Nanoparticles Market Revenue Million Forecast, by End-user Industry 2020 & 2033
- Table 26: Global Platinum Nanoparticles Market Volume K Tons Forecast, by End-user Industry 2020 & 2033
- Table 27: Global Platinum Nanoparticles Market Revenue Million Forecast, by Country 2020 & 2033
- Table 28: Global Platinum Nanoparticles Market Volume K Tons Forecast, by Country 2020 & 2033
- Table 29: United States Platinum Nanoparticles Market Revenue (Million) Forecast, by Application 2020 & 2033
- Table 30: United States Platinum Nanoparticles Market Volume (K Tons) Forecast, by Application 2020 & 2033
- Table 31: Canada Platinum Nanoparticles Market Revenue (Million) Forecast, by Application 2020 & 2033
- Table 32: Canada Platinum Nanoparticles Market Volume (K Tons) Forecast, by Application 2020 & 2033
- Table 33: Mexico Platinum Nanoparticles Market Revenue (Million) Forecast, by Application 2020 & 2033
- Table 34: Mexico Platinum Nanoparticles Market Volume (K Tons) Forecast, by Application 2020 & 2033
- Table 35: Global Platinum Nanoparticles Market Revenue Million Forecast, by Product 2020 & 2033
- Table 36: Global Platinum Nanoparticles Market Volume K Tons Forecast, by Product 2020 & 2033
- Table 37: Global Platinum Nanoparticles Market Revenue Million Forecast, by End-user Industry 2020 & 2033
- Table 38: Global Platinum Nanoparticles Market Volume K Tons Forecast, by End-user Industry 2020 & 2033
- Table 39: Global Platinum Nanoparticles Market Revenue Million Forecast, by Country 2020 & 2033
- Table 40: Global Platinum Nanoparticles Market Volume K Tons Forecast, by Country 2020 & 2033
- Table 41: Germany Platinum Nanoparticles Market Revenue (Million) Forecast, by Application 2020 & 2033
- Table 42: Germany Platinum Nanoparticles Market Volume (K Tons) Forecast, by Application 2020 & 2033
- Table 43: United Kingdom Platinum Nanoparticles Market Revenue (Million) Forecast, by Application 2020 & 2033
- Table 44: United Kingdom Platinum Nanoparticles Market Volume (K Tons) Forecast, by Application 2020 & 2033
- Table 45: France Platinum Nanoparticles Market Revenue (Million) Forecast, by Application 2020 & 2033
- Table 46: France Platinum Nanoparticles Market Volume (K Tons) Forecast, by Application 2020 & 2033
- Table 47: Italy Platinum Nanoparticles Market Revenue (Million) Forecast, by Application 2020 & 2033
- Table 48: Italy Platinum Nanoparticles Market Volume (K Tons) Forecast, by Application 2020 & 2033
- Table 49: Rest of Europe Platinum Nanoparticles Market Revenue (Million) Forecast, by Application 2020 & 2033
- Table 50: Rest of Europe Platinum Nanoparticles Market Volume (K Tons) Forecast, by Application 2020 & 2033
- Table 51: Global Platinum Nanoparticles Market Revenue Million Forecast, by Product 2020 & 2033
- Table 52: Global Platinum Nanoparticles Market Volume K Tons Forecast, by Product 2020 & 2033
- Table 53: Global Platinum Nanoparticles Market Revenue Million Forecast, by End-user Industry 2020 & 2033
- Table 54: Global Platinum Nanoparticles Market Volume K Tons Forecast, by End-user Industry 2020 & 2033
- Table 55: Global Platinum Nanoparticles Market Revenue Million Forecast, by Country 2020 & 2033
- Table 56: Global Platinum Nanoparticles Market Volume K Tons Forecast, by Country 2020 & 2033
- Table 57: Brazil Platinum Nanoparticles Market Revenue (Million) Forecast, by Application 2020 & 2033
- Table 58: Brazil Platinum Nanoparticles Market Volume (K Tons) Forecast, by Application 2020 & 2033
- Table 59: Argentina Platinum Nanoparticles Market Revenue (Million) Forecast, by Application 2020 & 2033
- Table 60: Argentina Platinum Nanoparticles Market Volume (K Tons) Forecast, by Application 2020 & 2033
- Table 61: Rest of South America Platinum Nanoparticles Market Revenue (Million) Forecast, by Application 2020 & 2033
- Table 62: Rest of South America Platinum Nanoparticles Market Volume (K Tons) Forecast, by Application 2020 & 2033
- Table 63: Global Platinum Nanoparticles Market Revenue Million Forecast, by Product 2020 & 2033
- Table 64: Global Platinum Nanoparticles Market Volume K Tons Forecast, by Product 2020 & 2033
- Table 65: Global Platinum Nanoparticles Market Revenue Million Forecast, by End-user Industry 2020 & 2033
- Table 66: Global Platinum Nanoparticles Market Volume K Tons Forecast, by End-user Industry 2020 & 2033
- Table 67: Global Platinum Nanoparticles Market Revenue Million Forecast, by Country 2020 & 2033
- Table 68: Global Platinum Nanoparticles Market Volume K Tons Forecast, by Country 2020 & 2033
- Table 69: Saudi Arabia Platinum Nanoparticles Market Revenue (Million) Forecast, by Application 2020 & 2033
- Table 70: Saudi Arabia Platinum Nanoparticles Market Volume (K Tons) Forecast, by Application 2020 & 2033
- Table 71: South Africa Platinum Nanoparticles Market Revenue (Million) Forecast, by Application 2020 & 2033
- Table 72: South Africa Platinum Nanoparticles Market Volume (K Tons) Forecast, by Application 2020 & 2033
- Table 73: Rest of Middle East and Africa Platinum Nanoparticles Market Revenue (Million) Forecast, by Application 2020 & 2033
- Table 74: Rest of Middle East and Africa Platinum Nanoparticles Market Volume (K Tons) Forecast, by Application 2020 & 2033
Frequently Asked Questions
1. What is the projected Compound Annual Growth Rate (CAGR) of the Platinum Nanoparticles Market?
The projected CAGR is approximately 6%.
2. Which companies are prominent players in the Platinum Nanoparticles Market?
Key companies in the market include US Research Nanomaterials Inc, Nanoshel LLC, American Elements, Nanocomposix, Sigma-Aldrich, NanoBio Chemicals India Pvt Ltd, TANAKA HOLDINGS Co Ltd, Nanostructured & Amorphous Materials Inc, Metrohm India Limited, HiQ-Nano s r l, Strem Chemicals Inc, PlasmaChem GmbH, Meliorum Technologies Inc, Particular GMBH, NANOCHEMAZONE.
3. What are the main segments of the Platinum Nanoparticles Market?
The market segments include Product, End-user Industry.
4. Can you provide details about the market size?
The market size is estimated to be USD 283.78 Million as of 2022.
5. What are some drivers contributing to market growth?
; Growing Health Care Industry; Other Drivers.
6. What are the notable trends driving market growth?
Health Care Segment to Dominate the Market.
7. Are there any restraints impacting market growth?
; Toxic Nature of Platinum Nanoparticles; Unfavorable Conditions in Non-medical End-user Industries Arising Due to COVID-19 Outbreak.
8. Can you provide examples of recent developments in the market?
N/A
9. What pricing options are available for accessing the report?
Pricing options include single-user, multi-user, and enterprise licenses priced at USD 4750, USD 5250, and USD 8750 respectively.
10. Is the market size provided in terms of value or volume?
The market size is provided in terms of value, measured in Million and volume, measured in K Tons.
11. Are there any specific market keywords associated with the report?
Yes, the market keyword associated with the report is "Platinum Nanoparticles Market," which aids in identifying and referencing the specific market segment covered.
12. How do I determine which pricing option suits my needs best?
The pricing options vary based on user requirements and access needs. Individual users may opt for single-user licenses, while businesses requiring broader access may choose multi-user or enterprise licenses for cost-effective access to the report.
13. Are there any additional resources or data provided in the Platinum Nanoparticles Market report?
While the report offers comprehensive insights, it's advisable to review the specific contents or supplementary materials provided to ascertain if additional resources or data are available.
14. How can I stay updated on further developments or reports in the Platinum Nanoparticles Market?
To stay informed about further developments, trends, and reports in the Platinum Nanoparticles Market, consider subscribing to industry newsletters, following relevant companies and organizations, or regularly checking reputable industry news sources and publications.
Methodology
Step 1 - Identification of Relevant Samples Size from Population Database


Step 2 - Approaches for Defining Global Market Size (Value, Volume* & Price*)

Note*: In applicable scenarios
Step 3 - Data Sources
Primary Research
- Web Analytics
- Survey Reports
- Research Institute
- Latest Research Reports
- Opinion Leaders
Secondary Research
- Annual Reports
- White Paper
- Latest Press Release
- Industry Association
- Paid Database
- Investor Presentations

Step 4 - Data Triangulation
Involves using different sources of information in order to increase the validity of a study
These sources are likely to be stakeholders in a program - participants, other researchers, program staff, other community members, and so on.
Then we put all data in single framework & apply various statistical tools to find out the dynamic on the market.
During the analysis stage, feedback from the stakeholder groups would be compared to determine areas of agreement as well as areas of divergence