

Key Insights
The global Polyacrylamide (PAM) market is poised for robust growth, projected to reach an estimated USD 8.7 Billion by 2025, driven by a CAGR of 6% from 2025 to 2033. This expansion is primarily fueled by the increasing demand for effective water treatment solutions, particularly in industrial and municipal sectors grappling with stringent environmental regulations and growing water scarcity concerns. The oil and gas industry also remains a significant contributor, with polyacrylamide's application in Enhanced Oil Recovery (EOR) techniques playing a crucial role in maximizing hydrocarbon extraction from mature fields. Furthermore, its utility as a flocculant in mining operations for tailings management and water reclamation is bolstering market demand.
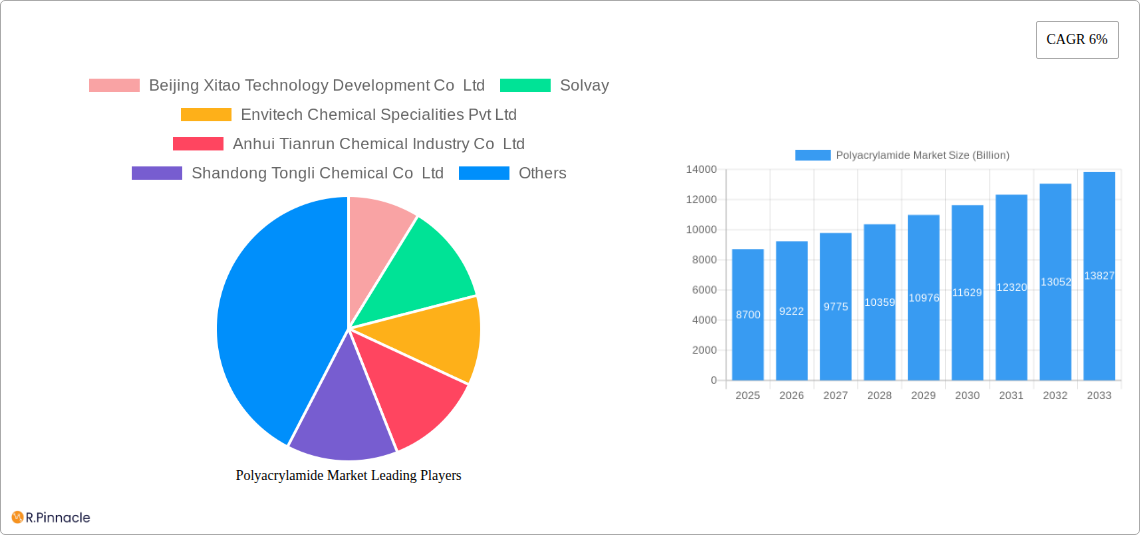
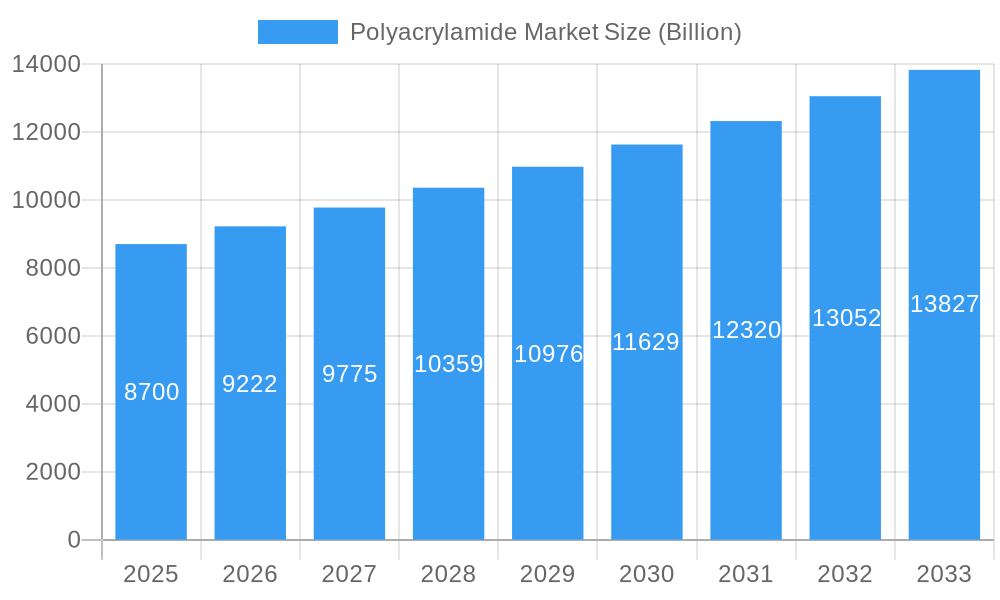
Polyacrylamide Market Market Size (In Billion)
The market's trajectory is further shaped by evolving trends such as the rising adoption of anionic and non-ionic polyacrylamide for specialized applications and the increasing focus on developing biodegradable and environmentally friendly PAM variants. However, the market faces certain restraints, including the fluctuating raw material prices, particularly for acrylonitrile, and the capital-intensive nature of production facilities. Despite these challenges, the diverse applications spanning water treatment, oil and gas, pulp and paper, and mining, coupled with a competitive landscape featuring key players like BASF SE, SNF Group, and Kemira, indicate a dynamic and expanding global polyacrylamide market. The Asia Pacific region, led by China, is expected to maintain its dominance due to rapid industrialization and significant investments in infrastructure and environmental remediation projects.
Polyacrylamide Market Company Market Share
This in-depth report offers an exhaustive analysis of the global polyacrylamide market, providing critical insights into its market size, growth drivers, competitive landscape, and future projections. Covering the historical period of 2019-2024, the base year of 2025, and a forecast period extending to 2033, this research is indispensable for stakeholders seeking to understand the intricate dynamics of this vital chemical sector. The report meticulously segments the market by physical form (Powder, Liquid, Emulsion/Dispersions), application (Enhanced Oil Recovery, Flocculants for Water Treatment, Soil Conditioner, Binders and Stabilizers in Cosmetics, Other Applications), and end-user industry (Water Treatment, Oil and Gas, Pulp and Paper, Mining, Other End-user Industries), offering granular data and actionable intelligence.
Polyacrylamide Market Market Structure & Innovation Trends
The polyacrylamide market exhibits a moderately concentrated structure, with a blend of established global players and regional specialists vying for market share. Innovation is primarily driven by the demand for environmentally friendly and high-performance polyacrylamide grades. Key innovation trends include the development of bio-based polyacrylamides and advanced formulations for specific industrial applications. Regulatory frameworks, particularly concerning environmental impact and water quality, significantly influence product development and market access. Substitutes for polyacrylamide exist across various applications, but its superior performance and cost-effectiveness in many areas maintain its competitive edge. End-user demographics are increasingly focused on sustainability and resource efficiency, pushing manufacturers towards greener solutions. Mergers and acquisitions (M&A) are a recurring theme, aimed at consolidating market presence, expanding product portfolios, and achieving economies of scale. Significant M&A deal values are observed as companies strategically acquire raw material suppliers or complementary technology providers. The market share distribution is dynamic, influenced by product differentiation and regional demand.
Polyacrylamide Market Market Dynamics & Trends
The polyacrylamide market is poised for robust growth, projected to expand at a CAGR of xx% from 2025 to 2033, reaching an estimated market value of XXX Billion USD. This expansion is fueled by a confluence of powerful market growth drivers. The escalating global demand for clean water is a primary catalyst, with polyacrylamide's crucial role as flocculants for water treatment being paramount. Industrial wastewater treatment, municipal water purification, and desalination processes all rely heavily on efficient and cost-effective coagulants and flocculants, where polyacrylamide excels. The oil and gas industry also presents a significant demand driver, particularly for enhanced oil recovery (EOR) applications, where polyacrylamide polymers are injected to increase the viscosity of water and improve oil displacement. As global energy demands persist, EOR techniques are becoming increasingly vital, bolstering the polyacrylamide market.
Technological disruptions are shaping the market through the development of novel polyacrylamide formulations. Innovations in anionic, cationic, and non-ionic polyacrylamides, along with advancements in emulsion and dispersion technologies, are leading to enhanced performance characteristics such as higher molecular weight, improved solubility, and greater shear stability. These advancements cater to increasingly stringent application requirements and performance expectations across various end-user industries. Consumer preferences are shifting towards sustainable and environmentally responsible chemical solutions. This trend is compelling manufacturers to invest in bio-based polyacrylamide production and explore eco-friendly manufacturing processes. The growing awareness of water scarcity and the need for effective wastewater management are further accelerating the adoption of polyacrylamide in municipal and industrial treatment facilities.
Competitive dynamics within the polyacrylamide market are intense, characterized by strategic partnerships, product differentiation, and a focus on cost optimization. Major players are investing heavily in research and development to introduce specialized grades of polyacrylamide that offer superior performance and address specific industry challenges. The market penetration of polyacrylamide is expected to deepen across existing applications and expand into new, emerging sectors. The increasing adoption of advanced water treatment technologies, coupled with stringent environmental regulations worldwide, ensures a sustained demand for polyacrylamide. Furthermore, the mining sector's need for efficient mineral processing and tailings management, as well as the pulp and paper industry's requirement for retention and drainage aids, contribute to the market's steady upward trajectory.
Dominant Regions & Segments in Polyacrylamide Market
The North America region is projected to maintain its dominance in the polyacrylamide market, driven by substantial investments in water infrastructure, a mature oil and gas sector, and stringent environmental regulations that mandate effective water treatment. The United States in particular, with its vast industrial base and significant oil and gas exploration activities, represents a key market.
- Physical Form: The Liquid segment of the polyacrylamide market is anticipated to exhibit the strongest growth. This dominance is attributed to the ease of handling, dosing, and dissolution of liquid forms in various industrial processes, especially in large-scale water treatment facilities and EOR operations. The Powder segment remains significant due to its cost-effectiveness and extended shelf life, while Emulsion/Dispersions are gaining traction for specialized applications requiring controlled release and enhanced stability.
- Application: The Flocculants for Water Treatment application segment holds the largest market share. Growing global concerns about water scarcity, increasing industrialization, and the need to comply with strict wastewater discharge regulations are the primary drivers. This segment encompasses municipal water treatment, industrial wastewater treatment, and desalination. Enhanced Oil Recovery (EOR) is another pivotal application, experiencing steady growth due to the demand for optimizing oil extraction from mature reservoirs. The Soil Conditioner application is witnessing a gradual rise, driven by agricultural sustainability initiatives and the need for improved soil water retention and erosion control.
- End-user Industry: The Water Treatment end-user industry is the most dominant segment in the polyacrylamide market. This is directly linked to the critical role of polyacrylamide in ensuring access to clean water and managing wastewater effectively across municipal and industrial sectors. The Oil and Gas industry is the second-largest contributor, primarily due to the extensive use of polyacrylamide in EOR. The Pulp and Paper industry represents a significant market, utilizing polyacrylamide as retention and drainage aids, and the Mining sector employs it for solid-liquid separation and tailings management.
Polyacrylamide Market Product Innovations
Product innovations in the polyacrylamide market are centered on developing advanced, high-performance polymers with enhanced functionalities and improved environmental profiles. Key developments include the creation of specialized polyacrylamide grades with higher molecular weights for superior flocculation efficiency, improved shear stability for challenging applications like EOR, and tailored charge densities for precise water chemistry management. The increasing focus on sustainability has spurred innovation in bio-based polyacrylamides derived from renewable feedstocks, offering a greener alternative to traditional petrochemical-based products. These innovations aim to provide manufacturers with competitive advantages by offering solutions that reduce chemical consumption, improve process efficiency, and meet stringent environmental regulations, thereby expanding market reach and application possibilities.
Report Scope & Segmentation Analysis
This report provides a comprehensive analysis of the polyacrylamide market, segmented across Physical Form, Application, and End-user Industry. The Physical Form segmentation includes Powder, Liquid, and Emulsion/Dispersions, each with distinct market dynamics and growth trajectories influenced by application-specific requirements and handling preferences. The Application segmentation meticulously examines Enhanced Oil Recovery (EOR), Flocculants for Water Treatment, Soil Conditioner, Binders and Stabilizers in Cosmetics, and Other Applications, highlighting the varying demand drivers and growth potentials within each. The End-user Industry segmentation focuses on Water Treatment, Oil and Gas, Pulp and Paper, Mining, and Other End-user Industries, detailing the specific needs and market penetration within each sector. Growth projections and market sizes for each segment are provided, along with an analysis of competitive dynamics to offer a granular understanding of the market landscape.
Key Drivers of Polyacrylamide Market Growth
The polyacrylamide market is propelled by several key growth drivers. Increasing global water scarcity and the stringent regulations on wastewater discharge are paramount, driving demand for efficient water treatment chemicals. The growing energy demand and the need to optimize oil extraction through enhanced oil recovery (EOR) techniques provide a substantial impetus to the market. Furthermore, advancements in polyacrylamide synthesis and formulation technologies, leading to higher performance and specialized grades, are expanding its applicability. The global focus on sustainable practices and the development of bio-based polyacrylamide are creating new market opportunities.
Challenges in the Polyacrylamide Market Sector
Despite its robust growth, the polyacrylamide market faces several challenges. Fluctuations in raw material prices, particularly for acrylic acid and acrylamide monomers, can impact profitability and market stability. Stringent environmental regulations and the perceived environmental impact of certain polyacrylamide formulations can pose hurdles, necessitating continuous innovation in eco-friendly alternatives. Intense competition among manufacturers, leading to price pressures, also presents a challenge. Additionally, supply chain disruptions and logistical complexities, especially in global markets, can affect product availability and delivery timelines.
Emerging Opportunities in Polyacrylamide Market
Emerging opportunities in the polyacrylamide market are diverse and promising. The development and widespread adoption of bio-based and biodegradable polyacrylamides offer significant potential for sustainable growth. Expansion into new geographical markets with developing industrial and water treatment infrastructure presents a substantial opportunity. The increasing application of polyacrylamide in agriculture for soil conditioning and water retention is an emerging area of growth. Furthermore, advancements in smart polymers and responsive polyacrylamide formulations for specialized applications in fields like healthcare and advanced materials are opening new avenues for market expansion.
Leading Players in the Polyacrylamide Market Market
- Beijing Xitao Technology Development Co Ltd
- Solvay
- Envitech Chemical Specialities Pvt Ltd
- Anhui Tianrun Chemical Industry Co Ltd
- Shandong Tongli Chemical Co Ltd
- Yixing Cleanwater Chemicals Co Ltd
- Ashland
- Liaocheng Yongxing Environmental Protection Science&Technology Co Ltd
- BASF SE
- Qingdao Oubo Chemical Co Ltd
- AnHui JuCheng Fine Chemicals Co Ltd
- Kemira
- Solenis
- Beijing Hengju Chemical Group Corporation
- CHINAFLOC
- SNF Group
Key Developments in Polyacrylamide Market Industry
- February 2022: Kemira announced the initiation of full-scale production of its newly developed polymer-based (polyacrylamide) on biobased feedstock. With this production, Kemira further strengthened its position as the provider of sustainable chemistry solutions for water-intensive industries.
- January 2022: Solenis acquired 100% of the outstanding shares of SCL GmbH (“SCL”), which produces DMA3, a primary raw material for cationic polyacrylamide production. The aim of this acquisition was to help Solenis fulfill a strategic insourcing objective and support Solenis’ polyacrylamide strategic global growth plan.
Future Outlook for Polyacrylamide Market Market
The future outlook for the polyacrylamide market is highly optimistic, driven by sustained global demand for water treatment solutions, ongoing energy extraction activities, and a growing emphasis on sustainable chemical innovations. The market is expected to witness continuous growth fueled by technological advancements in developing high-performance and environmentally friendly polyacrylamide grades, particularly bio-based alternatives. Strategic expansions into emerging economies and the exploration of novel applications in agriculture, cosmetics, and other industrial sectors will further contribute to market expansion. Investments in research and development, coupled with strategic mergers and acquisitions, will enable key players to enhance their product portfolios and solidify their market positions, ensuring a dynamic and thriving polyacrylamide market for years to come.
Polyacrylamide Market Segmentation
-
1. Physical Form
- 1.1. Powder
- 1.2. Liquid
- 1.3. Emulsion/Dispersions
-
2. Application
- 2.1. Enhanced Oil Recovery
- 2.2. Flocculants for Water Treatment
- 2.3. Soil Conditioner
- 2.4. Binders and Stabilizers in Cosmetics
- 2.5. Other Applications
-
3. End-user Industry
- 3.1. Water Treatment
- 3.2. Oil and Gas
- 3.3. Pulp and Paper
- 3.4. Mining
- 3.5. Other End-user Industries
Polyacrylamide Market Segmentation By Geography
-
1. Asia Pacific
- 1.1. China
- 1.2. India
- 1.3. Japan
- 1.4. South Korea
- 1.5. Rest of Asia Pacific
-
2. North America
- 2.1. United States
- 2.2. Canada
- 2.3. Mexico
-
3. Europe
- 3.1. Germany
- 3.2. United Kingdom
- 3.3. France
- 3.4. Russia
- 3.5. Netherlands
- 3.6. Rest of Europe
-
4. South America
- 4.1. Brazil
- 4.2. Argentina
- 4.3. Rest of South America
-
5. Middle East and Africa
- 5.1. Saudi Arabia
- 5.2. South Africa
- 5.3. Rest of Middle East and Africa
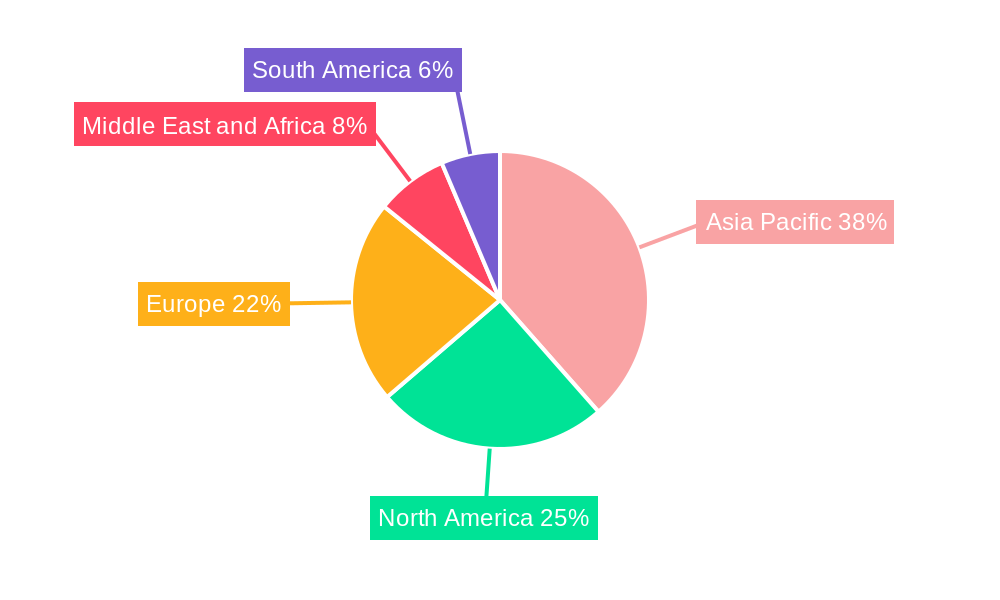
Polyacrylamide Market Regional Market Share
Geographic Coverage of Polyacrylamide Market
Polyacrylamide Market REPORT HIGHLIGHTS
| Aspects | Details |
|---|---|
| Study Period | 2020-2034 |
| Base Year | 2025 |
| Estimated Year | 2026 |
| Forecast Period | 2026-2034 |
| Historical Period | 2020-2025 |
| Growth Rate | CAGR of 6% from 2020-2034 |
| Segmentation |
|
Table of Contents
- 1. Introduction
- 1.1. Research Scope
- 1.2. Market Segmentation
- 1.3. Research Objective
- 1.4. Definitions and Assumptions
- 2. Executive Summary
- 2.1. Market Snapshot
- 3. Market Dynamics
- 3.1. Market Drivers
- 3.2. Market Restrains
- 3.3. Market Trends
- 3.4. Market Opportunities
- 4. Market Factor Analysis
- 4.1. Porters Five Forces
- 4.1.1. Bargaining Power of Suppliers
- 4.1.2. Bargaining Power of Buyers
- 4.1.3. Threat of New Entrants
- 4.1.4. Threat of Substitutes
- 4.1.5. Competitive Rivalry
- 4.2. PESTEL analysis
- 4.3. BCG Analysis
- 4.3.1. Stars (High Growth, High Market Share)
- 4.3.2. Cash Cows (Low Growth, High Market Share)
- 4.3.3. Question Mark (High Growth, Low Market Share)
- 4.3.4. Dogs (Low Growth, Low Market Share)
- 4.4. Ansoff Matrix Analysis
- 4.5. Supply Chain Analysis
- 4.6. Regulatory Landscape
- 4.7. Current Market Potential and Opportunity Assessment (TAM–SAM–SOM Framework)
- 4.8. PRI Analyst Note
- 4.1. Porters Five Forces
- 5. Market Analysis, Insights and Forecast 2021-2033
- 5.1. Market Analysis, Insights and Forecast - by Physical Form
- 5.1.1. Powder
- 5.1.2. Liquid
- 5.1.3. Emulsion/Dispersions
- 5.2. Market Analysis, Insights and Forecast - by Application
- 5.2.1. Enhanced Oil Recovery
- 5.2.2. Flocculants for Water Treatment
- 5.2.3. Soil Conditioner
- 5.2.4. Binders and Stabilizers in Cosmetics
- 5.2.5. Other Applications
- 5.3. Market Analysis, Insights and Forecast - by End-user Industry
- 5.3.1. Water Treatment
- 5.3.2. Oil and Gas
- 5.3.3. Pulp and Paper
- 5.3.4. Mining
- 5.3.5. Other End-user Industries
- 5.4. Market Analysis, Insights and Forecast - by Region
- 5.4.1. Asia Pacific
- 5.4.2. North America
- 5.4.3. Europe
- 5.4.4. South America
- 5.4.5. Middle East and Africa
- 5.1. Market Analysis, Insights and Forecast - by Physical Form
- 6. Global Polyacrylamide Market Analysis, Insights and Forecast, 2021-2033
- 6.1. Market Analysis, Insights and Forecast - by Physical Form
- 6.1.1. Powder
- 6.1.2. Liquid
- 6.1.3. Emulsion/Dispersions
- 6.2. Market Analysis, Insights and Forecast - by Application
- 6.2.1. Enhanced Oil Recovery
- 6.2.2. Flocculants for Water Treatment
- 6.2.3. Soil Conditioner
- 6.2.4. Binders and Stabilizers in Cosmetics
- 6.2.5. Other Applications
- 6.3. Market Analysis, Insights and Forecast - by End-user Industry
- 6.3.1. Water Treatment
- 6.3.2. Oil and Gas
- 6.3.3. Pulp and Paper
- 6.3.4. Mining
- 6.3.5. Other End-user Industries
- 6.1. Market Analysis, Insights and Forecast - by Physical Form
- 7. Asia Pacific Polyacrylamide Market Analysis, Insights and Forecast, 2020-2032
- 7.1. Market Analysis, Insights and Forecast - by Physical Form
- 7.1.1. Powder
- 7.1.2. Liquid
- 7.1.3. Emulsion/Dispersions
- 7.2. Market Analysis, Insights and Forecast - by Application
- 7.2.1. Enhanced Oil Recovery
- 7.2.2. Flocculants for Water Treatment
- 7.2.3. Soil Conditioner
- 7.2.4. Binders and Stabilizers in Cosmetics
- 7.2.5. Other Applications
- 7.3. Market Analysis, Insights and Forecast - by End-user Industry
- 7.3.1. Water Treatment
- 7.3.2. Oil and Gas
- 7.3.3. Pulp and Paper
- 7.3.4. Mining
- 7.3.5. Other End-user Industries
- 7.1. Market Analysis, Insights and Forecast - by Physical Form
- 8. North America Polyacrylamide Market Analysis, Insights and Forecast, 2020-2032
- 8.1. Market Analysis, Insights and Forecast - by Physical Form
- 8.1.1. Powder
- 8.1.2. Liquid
- 8.1.3. Emulsion/Dispersions
- 8.2. Market Analysis, Insights and Forecast - by Application
- 8.2.1. Enhanced Oil Recovery
- 8.2.2. Flocculants for Water Treatment
- 8.2.3. Soil Conditioner
- 8.2.4. Binders and Stabilizers in Cosmetics
- 8.2.5. Other Applications
- 8.3. Market Analysis, Insights and Forecast - by End-user Industry
- 8.3.1. Water Treatment
- 8.3.2. Oil and Gas
- 8.3.3. Pulp and Paper
- 8.3.4. Mining
- 8.3.5. Other End-user Industries
- 8.1. Market Analysis, Insights and Forecast - by Physical Form
- 9. Europe Polyacrylamide Market Analysis, Insights and Forecast, 2020-2032
- 9.1. Market Analysis, Insights and Forecast - by Physical Form
- 9.1.1. Powder
- 9.1.2. Liquid
- 9.1.3. Emulsion/Dispersions
- 9.2. Market Analysis, Insights and Forecast - by Application
- 9.2.1. Enhanced Oil Recovery
- 9.2.2. Flocculants for Water Treatment
- 9.2.3. Soil Conditioner
- 9.2.4. Binders and Stabilizers in Cosmetics
- 9.2.5. Other Applications
- 9.3. Market Analysis, Insights and Forecast - by End-user Industry
- 9.3.1. Water Treatment
- 9.3.2. Oil and Gas
- 9.3.3. Pulp and Paper
- 9.3.4. Mining
- 9.3.5. Other End-user Industries
- 9.1. Market Analysis, Insights and Forecast - by Physical Form
- 10. South America Polyacrylamide Market Analysis, Insights and Forecast, 2020-2032
- 10.1. Market Analysis, Insights and Forecast - by Physical Form
- 10.1.1. Powder
- 10.1.2. Liquid
- 10.1.3. Emulsion/Dispersions
- 10.2. Market Analysis, Insights and Forecast - by Application
- 10.2.1. Enhanced Oil Recovery
- 10.2.2. Flocculants for Water Treatment
- 10.2.3. Soil Conditioner
- 10.2.4. Binders and Stabilizers in Cosmetics
- 10.2.5. Other Applications
- 10.3. Market Analysis, Insights and Forecast - by End-user Industry
- 10.3.1. Water Treatment
- 10.3.2. Oil and Gas
- 10.3.3. Pulp and Paper
- 10.3.4. Mining
- 10.3.5. Other End-user Industries
- 10.1. Market Analysis, Insights and Forecast - by Physical Form
- 11. Middle East and Africa Polyacrylamide Market Analysis, Insights and Forecast, 2020-2032
- 11.1. Market Analysis, Insights and Forecast - by Physical Form
- 11.1.1. Powder
- 11.1.2. Liquid
- 11.1.3. Emulsion/Dispersions
- 11.2. Market Analysis, Insights and Forecast - by Application
- 11.2.1. Enhanced Oil Recovery
- 11.2.2. Flocculants for Water Treatment
- 11.2.3. Soil Conditioner
- 11.2.4. Binders and Stabilizers in Cosmetics
- 11.2.5. Other Applications
- 11.3. Market Analysis, Insights and Forecast - by End-user Industry
- 11.3.1. Water Treatment
- 11.3.2. Oil and Gas
- 11.3.3. Pulp and Paper
- 11.3.4. Mining
- 11.3.5. Other End-user Industries
- 11.1. Market Analysis, Insights and Forecast - by Physical Form
- 12. Competitive Analysis
- 12.1. Company Profiles
- 12.1.1 Beijing Xitao Technology Development Co Ltd
- 12.1.1.1. Company Overview
- 12.1.1.2. Products
- 12.1.1.3. Company Financials
- 12.1.1.4. SWOT Analysis
- 12.1.2 Solvay
- 12.1.2.1. Company Overview
- 12.1.2.2. Products
- 12.1.2.3. Company Financials
- 12.1.2.4. SWOT Analysis
- 12.1.3 Envitech Chemical Specialities Pvt Ltd
- 12.1.3.1. Company Overview
- 12.1.3.2. Products
- 12.1.3.3. Company Financials
- 12.1.3.4. SWOT Analysis
- 12.1.4 Anhui Tianrun Chemical Industry Co Ltd
- 12.1.4.1. Company Overview
- 12.1.4.2. Products
- 12.1.4.3. Company Financials
- 12.1.4.4. SWOT Analysis
- 12.1.5 Shandong Tongli Chemical Co Ltd
- 12.1.5.1. Company Overview
- 12.1.5.2. Products
- 12.1.5.3. Company Financials
- 12.1.5.4. SWOT Analysis
- 12.1.6 Yixing Cleanwater Chemicals Co Ltd
- 12.1.6.1. Company Overview
- 12.1.6.2. Products
- 12.1.6.3. Company Financials
- 12.1.6.4. SWOT Analysis
- 12.1.7 Ashland
- 12.1.7.1. Company Overview
- 12.1.7.2. Products
- 12.1.7.3. Company Financials
- 12.1.7.4. SWOT Analysis
- 12.1.8 Liaocheng Yongxing Environmental Protection Science&Technology Co Ltd
- 12.1.8.1. Company Overview
- 12.1.8.2. Products
- 12.1.8.3. Company Financials
- 12.1.8.4. SWOT Analysis
- 12.1.9 BASF SE
- 12.1.9.1. Company Overview
- 12.1.9.2. Products
- 12.1.9.3. Company Financials
- 12.1.9.4. SWOT Analysis
- 12.1.10 Qingdao Oubo Chemical Co Ltd
- 12.1.10.1. Company Overview
- 12.1.10.2. Products
- 12.1.10.3. Company Financials
- 12.1.10.4. SWOT Analysis
- 12.1.11 AnHui JuCheng Fine Chemicals Co Ltd
- 12.1.11.1. Company Overview
- 12.1.11.2. Products
- 12.1.11.3. Company Financials
- 12.1.11.4. SWOT Analysis
- 12.1.12 Kemira
- 12.1.12.1. Company Overview
- 12.1.12.2. Products
- 12.1.12.3. Company Financials
- 12.1.12.4. SWOT Analysis
- 12.1.13 Solenis
- 12.1.13.1. Company Overview
- 12.1.13.2. Products
- 12.1.13.3. Company Financials
- 12.1.13.4. SWOT Analysis
- 12.1.14 Beijing Hengju Chemical Group Corporation
- 12.1.14.1. Company Overview
- 12.1.14.2. Products
- 12.1.14.3. Company Financials
- 12.1.14.4. SWOT Analysis
- 12.1.15 CHINAFLOC
- 12.1.15.1. Company Overview
- 12.1.15.2. Products
- 12.1.15.3. Company Financials
- 12.1.15.4. SWOT Analysis
- 12.1.16 SNF Group
- 12.1.16.1. Company Overview
- 12.1.16.2. Products
- 12.1.16.3. Company Financials
- 12.1.16.4. SWOT Analysis
- 12.1.1 Beijing Xitao Technology Development Co Ltd
- 12.2. Market Entropy
- 12.2.1 Company's Key Areas Served
- 12.2.2 Recent Developments
- 12.3. Company Market Share Analysis 2025
- 12.3.1 Top 5 Companies Market Share Analysis
- 12.3.2 Top 3 Companies Market Share Analysis
- 12.4. List of Potential Customers
- 13. Research Methodology
List of Figures
- Figure 1: Global Polyacrylamide Market Revenue Breakdown (Billion, %) by Region 2025 & 2033
- Figure 2: Global Polyacrylamide Market Volume Breakdown (K Tons, %) by Region 2025 & 2033
- Figure 3: Asia Pacific Polyacrylamide Market Revenue (Billion), by Physical Form 2025 & 2033
- Figure 4: Asia Pacific Polyacrylamide Market Volume (K Tons), by Physical Form 2025 & 2033
- Figure 5: Asia Pacific Polyacrylamide Market Revenue Share (%), by Physical Form 2025 & 2033
- Figure 6: Asia Pacific Polyacrylamide Market Volume Share (%), by Physical Form 2025 & 2033
- Figure 7: Asia Pacific Polyacrylamide Market Revenue (Billion), by Application 2025 & 2033
- Figure 8: Asia Pacific Polyacrylamide Market Volume (K Tons), by Application 2025 & 2033
- Figure 9: Asia Pacific Polyacrylamide Market Revenue Share (%), by Application 2025 & 2033
- Figure 10: Asia Pacific Polyacrylamide Market Volume Share (%), by Application 2025 & 2033
- Figure 11: Asia Pacific Polyacrylamide Market Revenue (Billion), by End-user Industry 2025 & 2033
- Figure 12: Asia Pacific Polyacrylamide Market Volume (K Tons), by End-user Industry 2025 & 2033
- Figure 13: Asia Pacific Polyacrylamide Market Revenue Share (%), by End-user Industry 2025 & 2033
- Figure 14: Asia Pacific Polyacrylamide Market Volume Share (%), by End-user Industry 2025 & 2033
- Figure 15: Asia Pacific Polyacrylamide Market Revenue (Billion), by Country 2025 & 2033
- Figure 16: Asia Pacific Polyacrylamide Market Volume (K Tons), by Country 2025 & 2033
- Figure 17: Asia Pacific Polyacrylamide Market Revenue Share (%), by Country 2025 & 2033
- Figure 18: Asia Pacific Polyacrylamide Market Volume Share (%), by Country 2025 & 2033
- Figure 19: North America Polyacrylamide Market Revenue (Billion), by Physical Form 2025 & 2033
- Figure 20: North America Polyacrylamide Market Volume (K Tons), by Physical Form 2025 & 2033
- Figure 21: North America Polyacrylamide Market Revenue Share (%), by Physical Form 2025 & 2033
- Figure 22: North America Polyacrylamide Market Volume Share (%), by Physical Form 2025 & 2033
- Figure 23: North America Polyacrylamide Market Revenue (Billion), by Application 2025 & 2033
- Figure 24: North America Polyacrylamide Market Volume (K Tons), by Application 2025 & 2033
- Figure 25: North America Polyacrylamide Market Revenue Share (%), by Application 2025 & 2033
- Figure 26: North America Polyacrylamide Market Volume Share (%), by Application 2025 & 2033
- Figure 27: North America Polyacrylamide Market Revenue (Billion), by End-user Industry 2025 & 2033
- Figure 28: North America Polyacrylamide Market Volume (K Tons), by End-user Industry 2025 & 2033
- Figure 29: North America Polyacrylamide Market Revenue Share (%), by End-user Industry 2025 & 2033
- Figure 30: North America Polyacrylamide Market Volume Share (%), by End-user Industry 2025 & 2033
- Figure 31: North America Polyacrylamide Market Revenue (Billion), by Country 2025 & 2033
- Figure 32: North America Polyacrylamide Market Volume (K Tons), by Country 2025 & 2033
- Figure 33: North America Polyacrylamide Market Revenue Share (%), by Country 2025 & 2033
- Figure 34: North America Polyacrylamide Market Volume Share (%), by Country 2025 & 2033
- Figure 35: Europe Polyacrylamide Market Revenue (Billion), by Physical Form 2025 & 2033
- Figure 36: Europe Polyacrylamide Market Volume (K Tons), by Physical Form 2025 & 2033
- Figure 37: Europe Polyacrylamide Market Revenue Share (%), by Physical Form 2025 & 2033
- Figure 38: Europe Polyacrylamide Market Volume Share (%), by Physical Form 2025 & 2033
- Figure 39: Europe Polyacrylamide Market Revenue (Billion), by Application 2025 & 2033
- Figure 40: Europe Polyacrylamide Market Volume (K Tons), by Application 2025 & 2033
- Figure 41: Europe Polyacrylamide Market Revenue Share (%), by Application 2025 & 2033
- Figure 42: Europe Polyacrylamide Market Volume Share (%), by Application 2025 & 2033
- Figure 43: Europe Polyacrylamide Market Revenue (Billion), by End-user Industry 2025 & 2033
- Figure 44: Europe Polyacrylamide Market Volume (K Tons), by End-user Industry 2025 & 2033
- Figure 45: Europe Polyacrylamide Market Revenue Share (%), by End-user Industry 2025 & 2033
- Figure 46: Europe Polyacrylamide Market Volume Share (%), by End-user Industry 2025 & 2033
- Figure 47: Europe Polyacrylamide Market Revenue (Billion), by Country 2025 & 2033
- Figure 48: Europe Polyacrylamide Market Volume (K Tons), by Country 2025 & 2033
- Figure 49: Europe Polyacrylamide Market Revenue Share (%), by Country 2025 & 2033
- Figure 50: Europe Polyacrylamide Market Volume Share (%), by Country 2025 & 2033
- Figure 51: South America Polyacrylamide Market Revenue (Billion), by Physical Form 2025 & 2033
- Figure 52: South America Polyacrylamide Market Volume (K Tons), by Physical Form 2025 & 2033
- Figure 53: South America Polyacrylamide Market Revenue Share (%), by Physical Form 2025 & 2033
- Figure 54: South America Polyacrylamide Market Volume Share (%), by Physical Form 2025 & 2033
- Figure 55: South America Polyacrylamide Market Revenue (Billion), by Application 2025 & 2033
- Figure 56: South America Polyacrylamide Market Volume (K Tons), by Application 2025 & 2033
- Figure 57: South America Polyacrylamide Market Revenue Share (%), by Application 2025 & 2033
- Figure 58: South America Polyacrylamide Market Volume Share (%), by Application 2025 & 2033
- Figure 59: South America Polyacrylamide Market Revenue (Billion), by End-user Industry 2025 & 2033
- Figure 60: South America Polyacrylamide Market Volume (K Tons), by End-user Industry 2025 & 2033
- Figure 61: South America Polyacrylamide Market Revenue Share (%), by End-user Industry 2025 & 2033
- Figure 62: South America Polyacrylamide Market Volume Share (%), by End-user Industry 2025 & 2033
- Figure 63: South America Polyacrylamide Market Revenue (Billion), by Country 2025 & 2033
- Figure 64: South America Polyacrylamide Market Volume (K Tons), by Country 2025 & 2033
- Figure 65: South America Polyacrylamide Market Revenue Share (%), by Country 2025 & 2033
- Figure 66: South America Polyacrylamide Market Volume Share (%), by Country 2025 & 2033
- Figure 67: Middle East and Africa Polyacrylamide Market Revenue (Billion), by Physical Form 2025 & 2033
- Figure 68: Middle East and Africa Polyacrylamide Market Volume (K Tons), by Physical Form 2025 & 2033
- Figure 69: Middle East and Africa Polyacrylamide Market Revenue Share (%), by Physical Form 2025 & 2033
- Figure 70: Middle East and Africa Polyacrylamide Market Volume Share (%), by Physical Form 2025 & 2033
- Figure 71: Middle East and Africa Polyacrylamide Market Revenue (Billion), by Application 2025 & 2033
- Figure 72: Middle East and Africa Polyacrylamide Market Volume (K Tons), by Application 2025 & 2033
- Figure 73: Middle East and Africa Polyacrylamide Market Revenue Share (%), by Application 2025 & 2033
- Figure 74: Middle East and Africa Polyacrylamide Market Volume Share (%), by Application 2025 & 2033
- Figure 75: Middle East and Africa Polyacrylamide Market Revenue (Billion), by End-user Industry 2025 & 2033
- Figure 76: Middle East and Africa Polyacrylamide Market Volume (K Tons), by End-user Industry 2025 & 2033
- Figure 77: Middle East and Africa Polyacrylamide Market Revenue Share (%), by End-user Industry 2025 & 2033
- Figure 78: Middle East and Africa Polyacrylamide Market Volume Share (%), by End-user Industry 2025 & 2033
- Figure 79: Middle East and Africa Polyacrylamide Market Revenue (Billion), by Country 2025 & 2033
- Figure 80: Middle East and Africa Polyacrylamide Market Volume (K Tons), by Country 2025 & 2033
- Figure 81: Middle East and Africa Polyacrylamide Market Revenue Share (%), by Country 2025 & 2033
- Figure 82: Middle East and Africa Polyacrylamide Market Volume Share (%), by Country 2025 & 2033
List of Tables
- Table 1: Global Polyacrylamide Market Revenue Billion Forecast, by Physical Form 2020 & 2033
- Table 2: Global Polyacrylamide Market Volume K Tons Forecast, by Physical Form 2020 & 2033
- Table 3: Global Polyacrylamide Market Revenue Billion Forecast, by Application 2020 & 2033
- Table 4: Global Polyacrylamide Market Volume K Tons Forecast, by Application 2020 & 2033
- Table 5: Global Polyacrylamide Market Revenue Billion Forecast, by End-user Industry 2020 & 2033
- Table 6: Global Polyacrylamide Market Volume K Tons Forecast, by End-user Industry 2020 & 2033
- Table 7: Global Polyacrylamide Market Revenue Billion Forecast, by Region 2020 & 2033
- Table 8: Global Polyacrylamide Market Volume K Tons Forecast, by Region 2020 & 2033
- Table 9: Global Polyacrylamide Market Revenue Billion Forecast, by Physical Form 2020 & 2033
- Table 10: Global Polyacrylamide Market Volume K Tons Forecast, by Physical Form 2020 & 2033
- Table 11: Global Polyacrylamide Market Revenue Billion Forecast, by Application 2020 & 2033
- Table 12: Global Polyacrylamide Market Volume K Tons Forecast, by Application 2020 & 2033
- Table 13: Global Polyacrylamide Market Revenue Billion Forecast, by End-user Industry 2020 & 2033
- Table 14: Global Polyacrylamide Market Volume K Tons Forecast, by End-user Industry 2020 & 2033
- Table 15: Global Polyacrylamide Market Revenue Billion Forecast, by Country 2020 & 2033
- Table 16: Global Polyacrylamide Market Volume K Tons Forecast, by Country 2020 & 2033
- Table 17: China Polyacrylamide Market Revenue (Billion) Forecast, by Application 2020 & 2033
- Table 18: China Polyacrylamide Market Volume (K Tons) Forecast, by Application 2020 & 2033
- Table 19: India Polyacrylamide Market Revenue (Billion) Forecast, by Application 2020 & 2033
- Table 20: India Polyacrylamide Market Volume (K Tons) Forecast, by Application 2020 & 2033
- Table 21: Japan Polyacrylamide Market Revenue (Billion) Forecast, by Application 2020 & 2033
- Table 22: Japan Polyacrylamide Market Volume (K Tons) Forecast, by Application 2020 & 2033
- Table 23: South Korea Polyacrylamide Market Revenue (Billion) Forecast, by Application 2020 & 2033
- Table 24: South Korea Polyacrylamide Market Volume (K Tons) Forecast, by Application 2020 & 2033
- Table 25: Rest of Asia Pacific Polyacrylamide Market Revenue (Billion) Forecast, by Application 2020 & 2033
- Table 26: Rest of Asia Pacific Polyacrylamide Market Volume (K Tons) Forecast, by Application 2020 & 2033
- Table 27: Global Polyacrylamide Market Revenue Billion Forecast, by Physical Form 2020 & 2033
- Table 28: Global Polyacrylamide Market Volume K Tons Forecast, by Physical Form 2020 & 2033
- Table 29: Global Polyacrylamide Market Revenue Billion Forecast, by Application 2020 & 2033
- Table 30: Global Polyacrylamide Market Volume K Tons Forecast, by Application 2020 & 2033
- Table 31: Global Polyacrylamide Market Revenue Billion Forecast, by End-user Industry 2020 & 2033
- Table 32: Global Polyacrylamide Market Volume K Tons Forecast, by End-user Industry 2020 & 2033
- Table 33: Global Polyacrylamide Market Revenue Billion Forecast, by Country 2020 & 2033
- Table 34: Global Polyacrylamide Market Volume K Tons Forecast, by Country 2020 & 2033
- Table 35: United States Polyacrylamide Market Revenue (Billion) Forecast, by Application 2020 & 2033
- Table 36: United States Polyacrylamide Market Volume (K Tons) Forecast, by Application 2020 & 2033
- Table 37: Canada Polyacrylamide Market Revenue (Billion) Forecast, by Application 2020 & 2033
- Table 38: Canada Polyacrylamide Market Volume (K Tons) Forecast, by Application 2020 & 2033
- Table 39: Mexico Polyacrylamide Market Revenue (Billion) Forecast, by Application 2020 & 2033
- Table 40: Mexico Polyacrylamide Market Volume (K Tons) Forecast, by Application 2020 & 2033
- Table 41: Global Polyacrylamide Market Revenue Billion Forecast, by Physical Form 2020 & 2033
- Table 42: Global Polyacrylamide Market Volume K Tons Forecast, by Physical Form 2020 & 2033
- Table 43: Global Polyacrylamide Market Revenue Billion Forecast, by Application 2020 & 2033
- Table 44: Global Polyacrylamide Market Volume K Tons Forecast, by Application 2020 & 2033
- Table 45: Global Polyacrylamide Market Revenue Billion Forecast, by End-user Industry 2020 & 2033
- Table 46: Global Polyacrylamide Market Volume K Tons Forecast, by End-user Industry 2020 & 2033
- Table 47: Global Polyacrylamide Market Revenue Billion Forecast, by Country 2020 & 2033
- Table 48: Global Polyacrylamide Market Volume K Tons Forecast, by Country 2020 & 2033
- Table 49: Germany Polyacrylamide Market Revenue (Billion) Forecast, by Application 2020 & 2033
- Table 50: Germany Polyacrylamide Market Volume (K Tons) Forecast, by Application 2020 & 2033
- Table 51: United Kingdom Polyacrylamide Market Revenue (Billion) Forecast, by Application 2020 & 2033
- Table 52: United Kingdom Polyacrylamide Market Volume (K Tons) Forecast, by Application 2020 & 2033
- Table 53: France Polyacrylamide Market Revenue (Billion) Forecast, by Application 2020 & 2033
- Table 54: France Polyacrylamide Market Volume (K Tons) Forecast, by Application 2020 & 2033
- Table 55: Russia Polyacrylamide Market Revenue (Billion) Forecast, by Application 2020 & 2033
- Table 56: Russia Polyacrylamide Market Volume (K Tons) Forecast, by Application 2020 & 2033
- Table 57: Netherlands Polyacrylamide Market Revenue (Billion) Forecast, by Application 2020 & 2033
- Table 58: Netherlands Polyacrylamide Market Volume (K Tons) Forecast, by Application 2020 & 2033
- Table 59: Rest of Europe Polyacrylamide Market Revenue (Billion) Forecast, by Application 2020 & 2033
- Table 60: Rest of Europe Polyacrylamide Market Volume (K Tons) Forecast, by Application 2020 & 2033
- Table 61: Global Polyacrylamide Market Revenue Billion Forecast, by Physical Form 2020 & 2033
- Table 62: Global Polyacrylamide Market Volume K Tons Forecast, by Physical Form 2020 & 2033
- Table 63: Global Polyacrylamide Market Revenue Billion Forecast, by Application 2020 & 2033
- Table 64: Global Polyacrylamide Market Volume K Tons Forecast, by Application 2020 & 2033
- Table 65: Global Polyacrylamide Market Revenue Billion Forecast, by End-user Industry 2020 & 2033
- Table 66: Global Polyacrylamide Market Volume K Tons Forecast, by End-user Industry 2020 & 2033
- Table 67: Global Polyacrylamide Market Revenue Billion Forecast, by Country 2020 & 2033
- Table 68: Global Polyacrylamide Market Volume K Tons Forecast, by Country 2020 & 2033
- Table 69: Brazil Polyacrylamide Market Revenue (Billion) Forecast, by Application 2020 & 2033
- Table 70: Brazil Polyacrylamide Market Volume (K Tons) Forecast, by Application 2020 & 2033
- Table 71: Argentina Polyacrylamide Market Revenue (Billion) Forecast, by Application 2020 & 2033
- Table 72: Argentina Polyacrylamide Market Volume (K Tons) Forecast, by Application 2020 & 2033
- Table 73: Rest of South America Polyacrylamide Market Revenue (Billion) Forecast, by Application 2020 & 2033
- Table 74: Rest of South America Polyacrylamide Market Volume (K Tons) Forecast, by Application 2020 & 2033
- Table 75: Global Polyacrylamide Market Revenue Billion Forecast, by Physical Form 2020 & 2033
- Table 76: Global Polyacrylamide Market Volume K Tons Forecast, by Physical Form 2020 & 2033
- Table 77: Global Polyacrylamide Market Revenue Billion Forecast, by Application 2020 & 2033
- Table 78: Global Polyacrylamide Market Volume K Tons Forecast, by Application 2020 & 2033
- Table 79: Global Polyacrylamide Market Revenue Billion Forecast, by End-user Industry 2020 & 2033
- Table 80: Global Polyacrylamide Market Volume K Tons Forecast, by End-user Industry 2020 & 2033
- Table 81: Global Polyacrylamide Market Revenue Billion Forecast, by Country 2020 & 2033
- Table 82: Global Polyacrylamide Market Volume K Tons Forecast, by Country 2020 & 2033
- Table 83: Saudi Arabia Polyacrylamide Market Revenue (Billion) Forecast, by Application 2020 & 2033
- Table 84: Saudi Arabia Polyacrylamide Market Volume (K Tons) Forecast, by Application 2020 & 2033
- Table 85: South Africa Polyacrylamide Market Revenue (Billion) Forecast, by Application 2020 & 2033
- Table 86: South Africa Polyacrylamide Market Volume (K Tons) Forecast, by Application 2020 & 2033
- Table 87: Rest of Middle East and Africa Polyacrylamide Market Revenue (Billion) Forecast, by Application 2020 & 2033
- Table 88: Rest of Middle East and Africa Polyacrylamide Market Volume (K Tons) Forecast, by Application 2020 & 2033
Frequently Asked Questions
1. What is the projected Compound Annual Growth Rate (CAGR) of the Polyacrylamide Market?
The projected CAGR is approximately 6%.
2. Which companies are prominent players in the Polyacrylamide Market?
Key companies in the market include Beijing Xitao Technology Development Co Ltd, Solvay, Envitech Chemical Specialities Pvt Ltd, Anhui Tianrun Chemical Industry Co Ltd, Shandong Tongli Chemical Co Ltd, Yixing Cleanwater Chemicals Co Ltd, Ashland, Liaocheng Yongxing Environmental Protection Science&Technology Co Ltd, BASF SE, Qingdao Oubo Chemical Co Ltd, AnHui JuCheng Fine Chemicals Co Ltd, Kemira, Solenis, Beijing Hengju Chemical Group Corporation, CHINAFLOC, SNF Group.
3. What are the main segments of the Polyacrylamide Market?
The market segments include Physical Form, Application, End-user Industry.
4. Can you provide details about the market size?
The market size is estimated to be USD 5.7 Billion as of 2022.
5. What are some drivers contributing to market growth?
Growing Utilization in the Oil and Gas Industry for Enhanced Oil Recovery; Increasing Demand for Polyacrylamide as a Flocculant in Water Treatment Industry.
6. What are the notable trends driving market growth?
Water Treatment Industry to Dominate the Market.
7. Are there any restraints impacting market growth?
Health Concerns Caused by Exposure to Acrylamide Monomer.
8. Can you provide examples of recent developments in the market?
February 2022: Kemira announced the initiation of full-scale production of its newly developed polymer-based (polyacrylamide) on biobased feedstock. With this production, Kemira further strengthened its position as the provider of sustainable chemistry solutions for water-intensive industries.
9. What pricing options are available for accessing the report?
Pricing options include single-user, multi-user, and enterprise licenses priced at USD 4750, USD 5250, and USD 8750 respectively.
10. Is the market size provided in terms of value or volume?
The market size is provided in terms of value, measured in Billion and volume, measured in K Tons.
11. Are there any specific market keywords associated with the report?
Yes, the market keyword associated with the report is "Polyacrylamide Market," which aids in identifying and referencing the specific market segment covered.
12. How do I determine which pricing option suits my needs best?
The pricing options vary based on user requirements and access needs. Individual users may opt for single-user licenses, while businesses requiring broader access may choose multi-user or enterprise licenses for cost-effective access to the report.
13. Are there any additional resources or data provided in the Polyacrylamide Market report?
While the report offers comprehensive insights, it's advisable to review the specific contents or supplementary materials provided to ascertain if additional resources or data are available.
14. How can I stay updated on further developments or reports in the Polyacrylamide Market?
To stay informed about further developments, trends, and reports in the Polyacrylamide Market, consider subscribing to industry newsletters, following relevant companies and organizations, or regularly checking reputable industry news sources and publications.
Methodology
Step 1 - Identification of Relevant Samples Size from Population Database


Step 2 - Approaches for Defining Global Market Size (Value, Volume* & Price*)

Note*: In applicable scenarios
Step 3 - Data Sources
Primary Research
- Web Analytics
- Survey Reports
- Research Institute
- Latest Research Reports
- Opinion Leaders
Secondary Research
- Annual Reports
- White Paper
- Latest Press Release
- Industry Association
- Paid Database
- Investor Presentations

Step 4 - Data Triangulation
Involves using different sources of information in order to increase the validity of a study
These sources are likely to be stakeholders in a program - participants, other researchers, program staff, other community members, and so on.
Then we put all data in single framework & apply various statistical tools to find out the dynamic on the market.
During the analysis stage, feedback from the stakeholder groups would be compared to determine areas of agreement as well as areas of divergence