

Key Insights
The global Potash Ores Market is poised for robust expansion, projected to reach a substantial USD 66.11 billion in 2025. This growth is underpinned by a compelling Compound Annual Growth Rate (CAGR) of 8.9%, indicating sustained demand and increasing market value throughout the forecast period. A primary driver for this upward trajectory is the escalating global demand for fertilizers, essential for boosting agricultural productivity to meet the needs of a growing world population. Furthermore, advancements in mining and processing technologies are enhancing efficiency and reducing operational costs, making potash extraction more economically viable and contributing to market expansion. The market is also benefiting from the increasing adoption of precision agriculture techniques, which optimize fertilizer application, thereby driving demand for high-quality potash products.
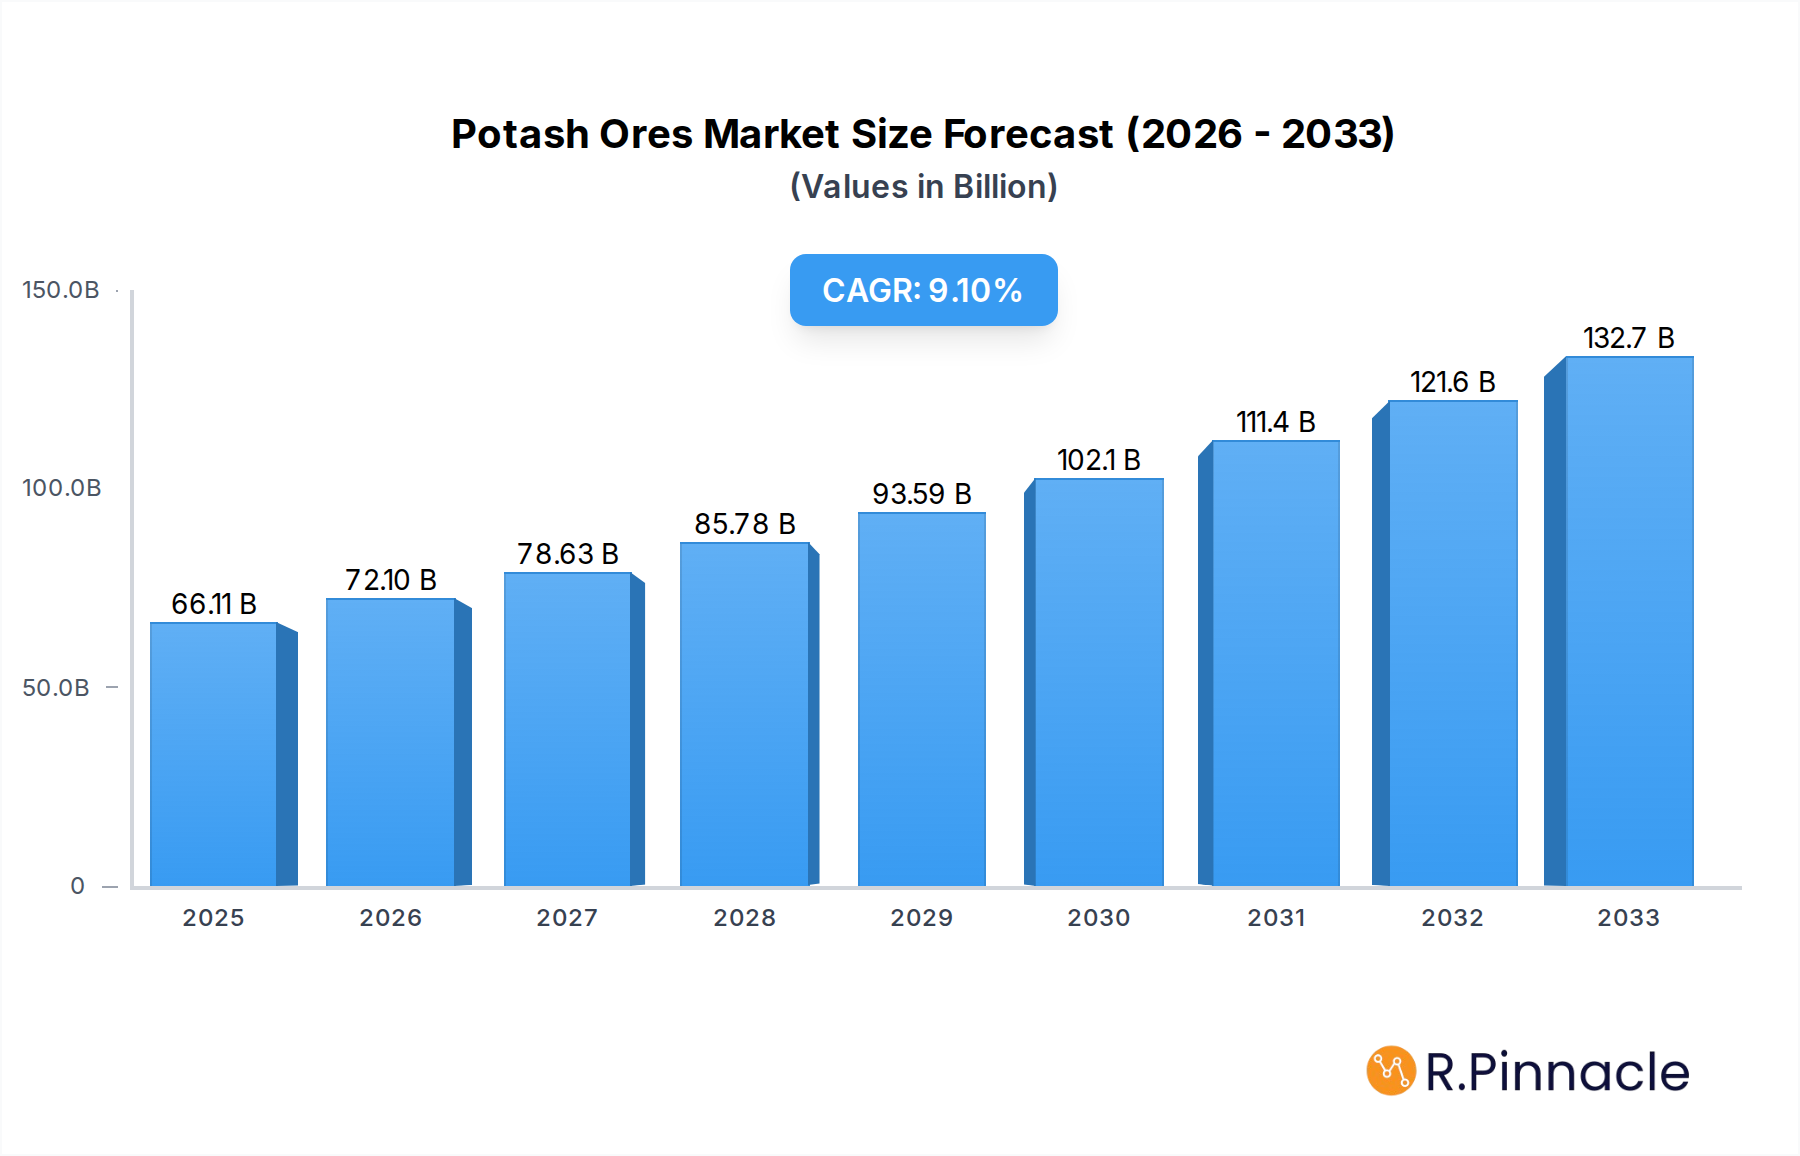
Potash Ores Market Market Size (In Billion)
The market's positive outlook is further reinforced by several emerging trends, including a growing focus on sustainable potash production methods and the development of specialized potash derivatives for various industrial applications beyond agriculture. However, the market also faces certain restraints, such as the volatile nature of commodity prices, significant capital investment required for new mine development, and stringent environmental regulations impacting extraction processes. Despite these challenges, key industry players like Nutrien Limited, The Mosaic Co., and Sociedad Química y Minera (SQM) are actively investing in research and development and strategic expansions to capitalize on market opportunities across diverse regions, including the high-growth Asia Pacific and North America. The market is segmented by production analysis, consumption analysis, import/export dynamics, and price trends, all contributing to a dynamic and evolving global potash landscape.

Potash Ores Market Company Market Share
This comprehensive report offers an in-depth analysis of the global Potash Ores Market, providing critical insights into its structure, dynamics, regional dominance, product innovations, and future outlook. Covering a study period from 2019 to 2033, with a base year of 2025 and a forecast period extending to 2033, this report is an indispensable resource for industry stakeholders seeking to understand and capitalize on the evolving potash landscape. The market is projected to witness significant growth, driven by increasing global food demand and the essential role of potash in enhancing crop yields.
Potash Ores Market Market Structure & Innovation Trends
The global Potash Ores Market exhibits a moderately concentrated structure, with a few key players holding substantial market share. Major companies like Nutrien Limited, The Mosaic Co, and Sociedad Química y Minera (SQM) dominate production and distribution. Innovation is a crucial driver, with companies investing heavily in advanced extraction techniques and the development of specialty potash fertilizers to meet diverse agricultural needs and environmental regulations. Regulatory frameworks, primarily focused on environmental impact and sustainable mining practices, significantly influence market operations. Product substitutes, such as organic fertilizers and other nutrient sources, pose a competitive challenge, though their efficacy and scalability remain areas of ongoing research. End-user demographics are dominated by agricultural sectors worldwide, with a growing emphasis on precision agriculture and nutrient management. Mergers and acquisitions (M&A) remain a strategic tool for market consolidation and expansion. For instance, the acquisition of Brazilian distributor Fertilizantes Heringer SA by EuroChem Group in March 2022, valued at an estimated $XXX billion, underscores the trend of strengthening distribution networks in key agricultural markets. The overall M&A deal value in the potash sector is projected to reach $XXX billion by 2033.
Potash Ores Market Market Dynamics & Trends
The Potash Ores Market is experiencing robust growth, primarily fueled by the ever-increasing global population and the subsequent surge in demand for food production. This fundamental driver necessitates higher agricultural output, making potash, a vital nutrient for plant growth, an indispensable component of modern farming. The compound annual growth rate (CAGR) for the global Potash Ores Market is estimated to be XX.X% from 2025 to 2033. Technological disruptions are continuously shaping the market, with advancements in mining technologies leading to more efficient and environmentally friendly extraction processes. Innovations in fertilizer formulations, such as slow-release and enhanced-efficiency potash products, are gaining traction, allowing farmers to optimize nutrient application and reduce environmental runoff. Consumer preferences are shifting towards sustainable agricultural practices, pushing the demand for responsibly sourced and efficiently utilized fertilizers. Competitive dynamics are characterized by strategic partnerships and vertical integration, as companies aim to secure supply chains and expand their market reach. For example, The Mosaic Company's partnership with Sound Agriculture in March 2021, aimed at developing a bio-inspired nutrient efficiency product, highlights the industry's focus on innovative solutions that enhance fertilizer efficacy and sustainability. Market penetration of advanced potash products is expected to reach XX% by 2033, driven by increasing awareness and adoption among farmers seeking to improve yields and reduce input costs. The market penetration of precision agriculture technologies, which leverage precise nutrient application, is also a significant trend influencing potash demand.
Dominant Regions & Segments in Potash Ores Market
North America, particularly Canada, is a dominant region in the Potash Ores Market, owing to its vast reserves and established mining infrastructure. The region consistently leads in Production Analysis:, contributing over XX% of the global potash output. Key drivers include favorable geological conditions, supportive government policies for resource extraction, and significant investments in advanced mining technologies. In terms of Consumption Analysis:, Asia-Pacific, led by China and India, emerges as the dominant segment. The region's massive agricultural base, growing population, and increasing disposable incomes drive a substantial demand for fertilizers to boost food security. Economic policies promoting agricultural modernization and infrastructure development for better fertilizer distribution are critical growth factors. The Import Market Analysis (Value & Volume): is significantly influenced by countries with high consumption and limited domestic production, such as India and Brazil. These nations represent substantial import volumes, projected to reach $XXX billion by 2033. Infrastructure development, including port facilities and logistics networks, plays a crucial role in facilitating efficient import operations. For Export Market Analysis (Value & Volume)::, Canada and Russia are leading exporters, leveraging their extensive reserves and established export channels. Strategic trade agreements and geopolitical stability are key factors influencing export volumes, which are expected to reach $XXX billion by 2033. The Price Trend Analysis: indicates a cyclical pattern influenced by supply-demand dynamics, geopolitical events, and global commodity prices. However, a long-term upward trend is anticipated due to persistent demand growth and potential supply constraints. Infrastructure development for efficient distribution and transportation remains a universal imperative across all dominant regions.
Potash Ores Market Product Innovations
Product innovation in the Potash Ores Market is focused on enhancing nutrient use efficiency, environmental sustainability, and crop-specific applications. Key developments include the introduction of slow-release and controlled-release potash formulations, which minimize nutrient loss and maximize uptake by plants, leading to higher yields and reduced environmental impact. Specialty potash products tailored for specific crops and soil conditions are also gaining prominence. For instance, the partnership between Mosaic and Sound Agriculture aims to leverage bio-inspired chemistry to activate soil microbiomes, enabling plants to access essential nutrients more effectively and allowing growers to optimize fertilizer inputs. These innovations offer competitive advantages by addressing the evolving needs of modern agriculture, including precision farming techniques and the drive for sustainable practices. The integration of advanced technologies into fertilizer production is a defining trend.
Report Scope & Segmentation Analysis
This report meticulously segments the Potash Ores Market across crucial analytical dimensions. The Production Analysis: delves into the volume and sources of potash extraction globally. The Consumption Analysis: examines the demand for potash across various agricultural regions and applications. The Import Market Analysis (Value & Volume): provides detailed insights into the trade flows and financial transactions of potash imports. Similarly, the Export Market Analysis (Value & Volume):: focuses on global potash export dynamics. The Price Trend Analysis: tracks historical and projected price movements of potash ores. Growth projections for each segment are based on the forecast period of 2025–2033, considering current market sizes and competitive landscapes. The global potash market size is projected to reach $XXX billion by 2033.
Key Drivers of Potash Ores Market Growth
The Potash Ores Market is propelled by several key drivers. Firstly, the escalating global population and the subsequent demand for increased food production necessitate enhanced agricultural productivity, directly boosting the need for potash, a crucial plant nutrient. Secondly, technological advancements in agriculture, particularly the adoption of precision farming techniques, are driving the demand for more efficient and targeted fertilizer applications, including specialty potash products. Thirdly, government initiatives and policies aimed at boosting agricultural output and ensuring food security in various nations provide a supportive environment for market growth. Furthermore, rising disposable incomes in developing economies lead to increased consumption of nutrient-rich foods, indirectly fueling potash demand. Finally, the inherent role of potash in improving crop quality and resilience against stress factors makes it an indispensable input for sustainable agriculture.
Challenges in the Potash Ores Market Sector
Despite its growth trajectory, the Potash Ores Market faces several challenges. Regulatory hurdles, particularly concerning environmental impact and sustainable mining practices, can lead to increased operational costs and longer permitting times. Supply chain disruptions, stemming from geopolitical tensions, transportation issues, or unforeseen natural events, can significantly impact market stability and pricing. Intense competition among key players and the availability of alternative nutrient sources, while not a direct substitute for potash's unique role, exert pressure on market share and pricing strategies. Moreover, the capital-intensive nature of potash mining and exploration requires substantial investment, posing a barrier to entry for new players. Fluctuations in energy prices also impact production costs.
Emerging Opportunities in Potash Ores Market
The Potash Ores Market is ripe with emerging opportunities. The increasing focus on sustainable agriculture and the growing demand for organic fertilizers present opportunities for companies to develop and market bio-based potash alternatives or enhance the efficiency of existing potash products. The expansion of agricultural frontiers in emerging economies, coupled with government efforts to modernize farming practices, opens up new markets for potash. Technological innovations, such as the development of advanced extraction methods and the use of artificial intelligence in optimizing fertilizer application, offer avenues for operational efficiency and market differentiation. Furthermore, the growing consumer preference for nutrient-dense foods will continue to drive demand for high-quality fertilizers like potash. Exploration and development of new potash deposits in untapped regions also represent significant opportunities.
Leading Players in the Potash Ores Market Market
- The Mosaic Co
- Coromandel International Ltd
- Nutrien Limited
- Sociedad Química y Minera (SQM)
- Petrokemija DD Fertilizer Factory
- Sinofert Holdings Ltd
- Eurochem
- Intrepid Potash Inc
- K+S AKTIENGESELLSCHAFT
Key Developments in Potash Ores Market Industry
- March 2022: EuroChem Group announced the completion of its purchase of controlling stake (51.48%) in Brazilian distributor Fertilizantes Heringer SA, significantly strengthening its production and distribution capabilities in Brazil. This strategic move aims to bolster market presence in a key agricultural region.
- March 2021: Mosaic announced a partnership with Sound Agriculture to develop and distribute a novel nutrient efficiency product. Sound Agriculture will focus on manufacturing the active ingredient and product formulation, while Mosaic will lead field development, regulatory affairs, sales, and marketing. The product leverages bio-inspired chemistry to activate soil microbiomes, enabling plants to access nutrients more effectively and allowing growers to optimize fertilizer inputs. It is anticipated for release in the US market in 2023.
- February 2019: Nutrien Ltd. acquired Van Horn, Inc. (Van Horn), a prominent US retailer and agricultural services provider serving over 5,000 customers across 18 counties. This acquisition was aimed at expanding Nutrien's Retail business footprint and customer base in the United States.
Future Outlook for Potash Ores Market Market
The future outlook for the Potash Ores Market is exceptionally positive, driven by a confluence of factors that ensure sustained demand and growth. The imperative to feed a growing global population, coupled with the ongoing need to improve agricultural productivity and resilience, will continue to position potash as an indispensable nutrient. Innovations in fertilizer technology, focusing on enhanced efficiency, sustainability, and precision application, will unlock new market opportunities and enhance the value proposition of potash products. Emerging economies, with their expanding agricultural sectors and increasing adoption of modern farming practices, represent significant untapped potential. Strategic investments in exploration, extraction, and distribution infrastructure will be crucial for companies to capitalize on this growth. The market is poised for continued expansion, with a focus on meeting the evolving needs of global agriculture while adhering to environmental stewardship principles.
Potash Ores Market Segmentation
- 1. Production Analysis
- 2. Consumption Analysis
- 3. Import Market Analysis (Value & Volume)
- 4. Export Market Analysis (Value & Volume)
- 5. Price Trend Analysis
Potash Ores Market Segmentation By Geography
-
1. North America
- 1.1. United States
- 1.2. Canada
- 1.3. Mexico
-
2. South America
- 2.1. Brazil
- 2.2. Argentina
- 2.3. Rest of South America
-
3. Europe
- 3.1. United Kingdom
- 3.2. Germany
- 3.3. France
- 3.4. Italy
- 3.5. Spain
- 3.6. Russia
- 3.7. Benelux
- 3.8. Nordics
- 3.9. Rest of Europe
-
4. Middle East & Africa
- 4.1. Turkey
- 4.2. Israel
- 4.3. GCC
- 4.4. North Africa
- 4.5. South Africa
- 4.6. Rest of Middle East & Africa
-
5. Asia Pacific
- 5.1. China
- 5.2. India
- 5.3. Japan
- 5.4. South Korea
- 5.5. ASEAN
- 5.6. Oceania
- 5.7. Rest of Asia Pacific
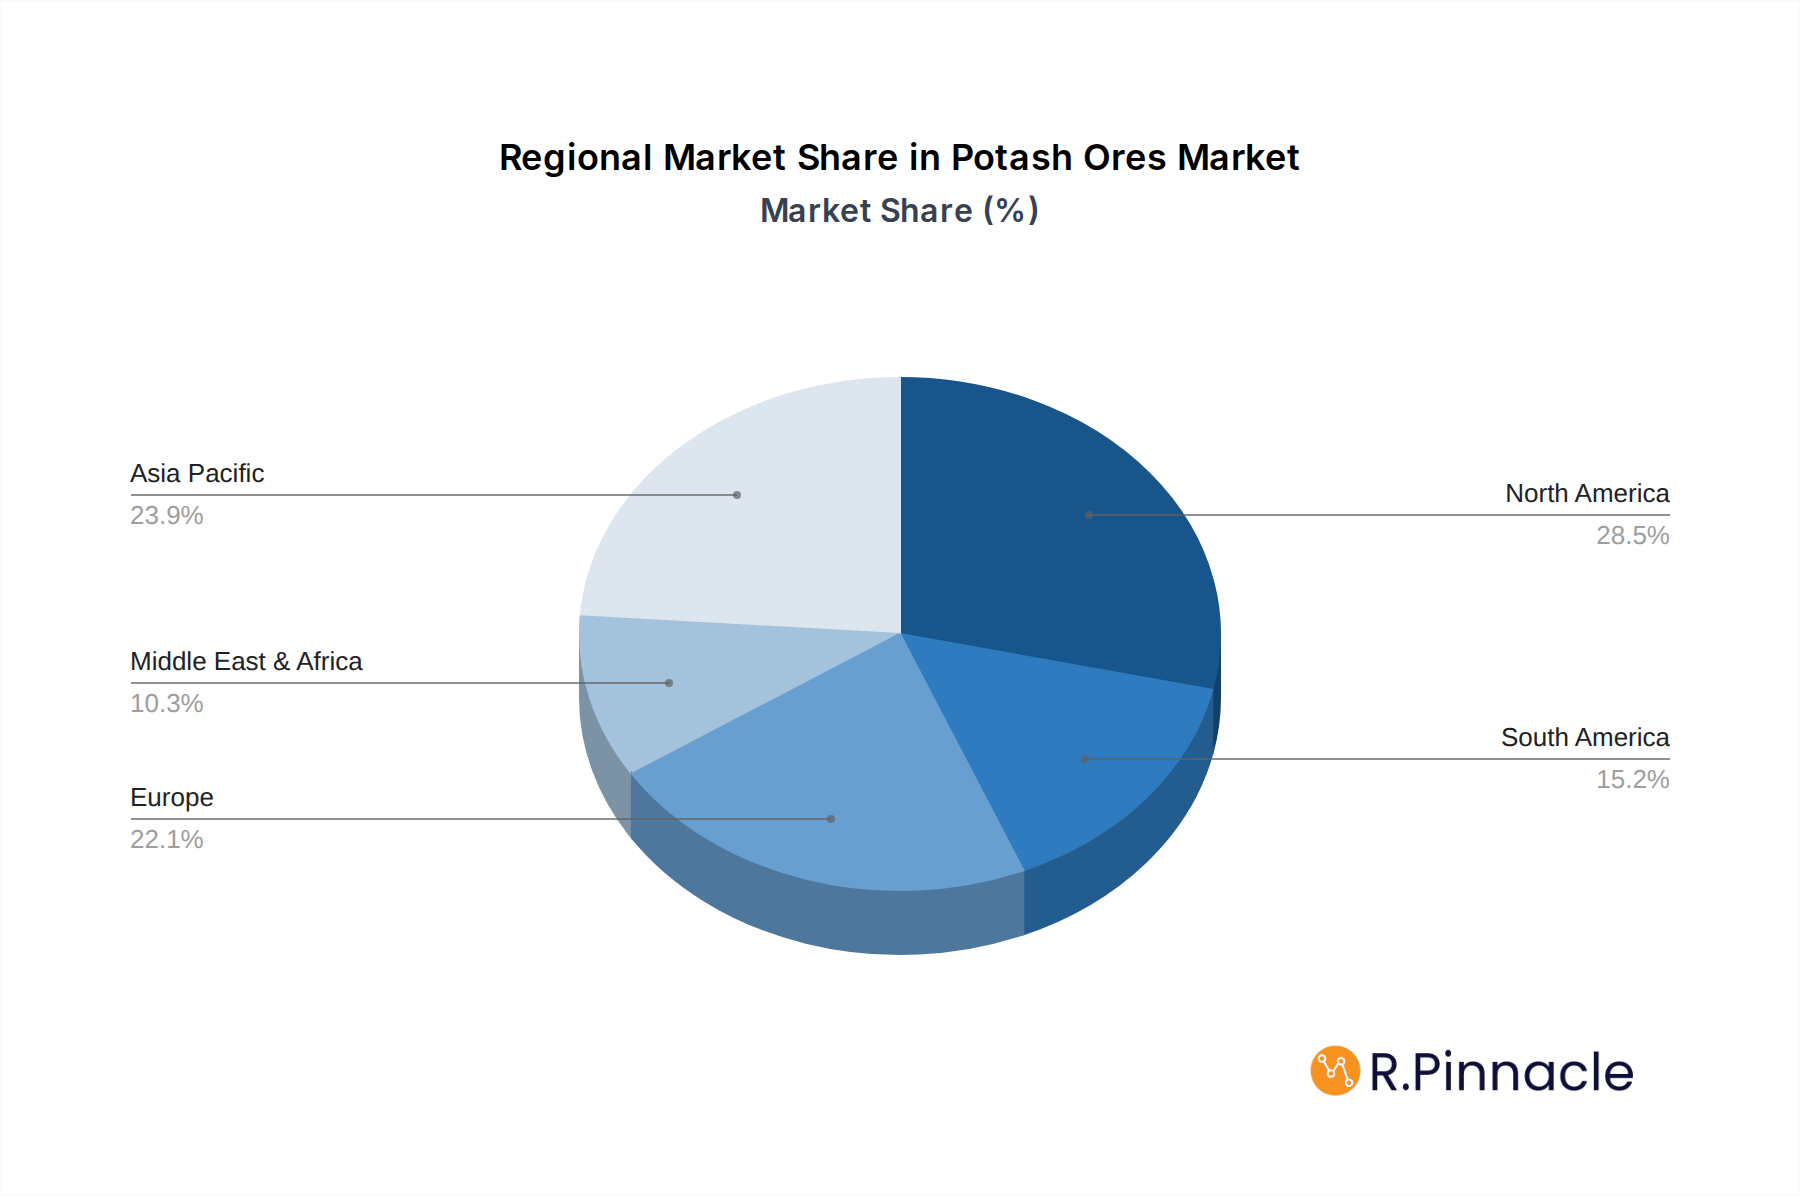
Potash Ores Market Regional Market Share
Geographic Coverage of Potash Ores Market
Potash Ores Market REPORT HIGHLIGHTS
| Aspects | Details |
|---|---|
| Study Period | 2020-2034 |
| Base Year | 2025 |
| Estimated Year | 2026 |
| Forecast Period | 2026-2034 |
| Historical Period | 2020-2025 |
| Growth Rate | CAGR of 8.9% from 2020-2034 |
| Segmentation |
|
Table of Contents
- 1. Introduction
- 1.1. Research Scope
- 1.2. Market Segmentation
- 1.3. Research Objective
- 1.4. Definitions and Assumptions
- 2. Executive Summary
- 2.1. Market Snapshot
- 3. Market Dynamics
- 3.1. Market Drivers
- 3.2. Market Restrains
- 3.3. Market Trends
- 3.4. Market Opportunities
- 4. Market Factor Analysis
- 4.1. Porters Five Forces
- 4.1.1. Bargaining Power of Suppliers
- 4.1.2. Bargaining Power of Buyers
- 4.1.3. Threat of New Entrants
- 4.1.4. Threat of Substitutes
- 4.1.5. Competitive Rivalry
- 4.2. PESTEL analysis
- 4.3. BCG Analysis
- 4.3.1. Stars (High Growth, High Market Share)
- 4.3.2. Cash Cows (Low Growth, High Market Share)
- 4.3.3. Question Mark (High Growth, Low Market Share)
- 4.3.4. Dogs (Low Growth, Low Market Share)
- 4.4. Ansoff Matrix Analysis
- 4.5. Supply Chain Analysis
- 4.6. Regulatory Landscape
- 4.7. Current Market Potential and Opportunity Assessment (TAM–SAM–SOM Framework)
- 4.8. PRI Analyst Note
- 4.1. Porters Five Forces
- 5. Market Analysis, Insights and Forecast 2021-2033
- 5.1. Market Analysis, Insights and Forecast - by Production Analysis
- 5.2. Market Analysis, Insights and Forecast - by Consumption Analysis
- 5.3. Market Analysis, Insights and Forecast - by Import Market Analysis (Value & Volume)
- 5.4. Market Analysis, Insights and Forecast - by Export Market Analysis (Value & Volume)
- 5.5. Market Analysis, Insights and Forecast - by Price Trend Analysis
- 5.6. Market Analysis, Insights and Forecast - by Region
- 5.6.1. North America
- 5.6.2. South America
- 5.6.3. Europe
- 5.6.4. Middle East & Africa
- 5.6.5. Asia Pacific
- 6. Global Potash Ores Market Analysis, Insights and Forecast, 2021-2033
- 6.1. Market Analysis, Insights and Forecast - by Production Analysis
- 6.2. Market Analysis, Insights and Forecast - by Consumption Analysis
- 6.3. Market Analysis, Insights and Forecast - by Import Market Analysis (Value & Volume)
- 6.4. Market Analysis, Insights and Forecast - by Export Market Analysis (Value & Volume)
- 6.5. Market Analysis, Insights and Forecast - by Price Trend Analysis
- 7. North America Potash Ores Market Analysis, Insights and Forecast, 2020-2032
- 7.1. Market Analysis, Insights and Forecast - by Production Analysis
- 7.2. Market Analysis, Insights and Forecast - by Consumption Analysis
- 7.3. Market Analysis, Insights and Forecast - by Import Market Analysis (Value & Volume)
- 7.4. Market Analysis, Insights and Forecast - by Export Market Analysis (Value & Volume)
- 7.5. Market Analysis, Insights and Forecast - by Price Trend Analysis
- 8. South America Potash Ores Market Analysis, Insights and Forecast, 2020-2032
- 8.1. Market Analysis, Insights and Forecast - by Production Analysis
- 8.2. Market Analysis, Insights and Forecast - by Consumption Analysis
- 8.3. Market Analysis, Insights and Forecast - by Import Market Analysis (Value & Volume)
- 8.4. Market Analysis, Insights and Forecast - by Export Market Analysis (Value & Volume)
- 8.5. Market Analysis, Insights and Forecast - by Price Trend Analysis
- 9. Europe Potash Ores Market Analysis, Insights and Forecast, 2020-2032
- 9.1. Market Analysis, Insights and Forecast - by Production Analysis
- 9.2. Market Analysis, Insights and Forecast - by Consumption Analysis
- 9.3. Market Analysis, Insights and Forecast - by Import Market Analysis (Value & Volume)
- 9.4. Market Analysis, Insights and Forecast - by Export Market Analysis (Value & Volume)
- 9.5. Market Analysis, Insights and Forecast - by Price Trend Analysis
- 10. Middle East & Africa Potash Ores Market Analysis, Insights and Forecast, 2020-2032
- 10.1. Market Analysis, Insights and Forecast - by Production Analysis
- 10.2. Market Analysis, Insights and Forecast - by Consumption Analysis
- 10.3. Market Analysis, Insights and Forecast - by Import Market Analysis (Value & Volume)
- 10.4. Market Analysis, Insights and Forecast - by Export Market Analysis (Value & Volume)
- 10.5. Market Analysis, Insights and Forecast - by Price Trend Analysis
- 11. Asia Pacific Potash Ores Market Analysis, Insights and Forecast, 2020-2032
- 11.1. Market Analysis, Insights and Forecast - by Production Analysis
- 11.2. Market Analysis, Insights and Forecast - by Consumption Analysis
- 11.3. Market Analysis, Insights and Forecast - by Import Market Analysis (Value & Volume)
- 11.4. Market Analysis, Insights and Forecast - by Export Market Analysis (Value & Volume)
- 11.5. Market Analysis, Insights and Forecast - by Price Trend Analysis
- 12. Competitive Analysis
- 12.1. Company Profiles
- 12.1.1 The Mosaic Co
- 12.1.1.1. Company Overview
- 12.1.1.2. Products
- 12.1.1.3. Company Financials
- 12.1.1.4. SWOT Analysis
- 12.1.2 Coromandel International Ltd
- 12.1.2.1. Company Overview
- 12.1.2.2. Products
- 12.1.2.3. Company Financials
- 12.1.2.4. SWOT Analysis
- 12.1.3 Nutrien Limited
- 12.1.3.1. Company Overview
- 12.1.3.2. Products
- 12.1.3.3. Company Financials
- 12.1.3.4. SWOT Analysis
- 12.1.4 Sociedad Química y Minera (SQM)
- 12.1.4.1. Company Overview
- 12.1.4.2. Products
- 12.1.4.3. Company Financials
- 12.1.4.4. SWOT Analysis
- 12.1.5 Petrokemija DD Fertilizer Factory
- 12.1.5.1. Company Overview
- 12.1.5.2. Products
- 12.1.5.3. Company Financials
- 12.1.5.4. SWOT Analysis
- 12.1.6 Sinofert Holdings Ltd
- 12.1.6.1. Company Overview
- 12.1.6.2. Products
- 12.1.6.3. Company Financials
- 12.1.6.4. SWOT Analysis
- 12.1.7 Eurochem
- 12.1.7.1. Company Overview
- 12.1.7.2. Products
- 12.1.7.3. Company Financials
- 12.1.7.4. SWOT Analysis
- 12.1.8 Intrepid Potash Inc
- 12.1.8.1. Company Overview
- 12.1.8.2. Products
- 12.1.8.3. Company Financials
- 12.1.8.4. SWOT Analysis
- 12.1.9 K+S AKTIENGESELLSCHAFT
- 12.1.9.1. Company Overview
- 12.1.9.2. Products
- 12.1.9.3. Company Financials
- 12.1.9.4. SWOT Analysis
- 12.1.1 The Mosaic Co
- 12.2. Market Entropy
- 12.2.1 Company's Key Areas Served
- 12.2.2 Recent Developments
- 12.3. Company Market Share Analysis 2025
- 12.3.1 Top 5 Companies Market Share Analysis
- 12.3.2 Top 3 Companies Market Share Analysis
- 12.4. List of Potential Customers
- 13. Research Methodology
List of Figures
- Figure 1: Global Potash Ores Market Revenue Breakdown (billion, %) by Region 2025 & 2033
- Figure 2: North America Potash Ores Market Revenue (billion), by Production Analysis 2025 & 2033
- Figure 3: North America Potash Ores Market Revenue Share (%), by Production Analysis 2025 & 2033
- Figure 4: North America Potash Ores Market Revenue (billion), by Consumption Analysis 2025 & 2033
- Figure 5: North America Potash Ores Market Revenue Share (%), by Consumption Analysis 2025 & 2033
- Figure 6: North America Potash Ores Market Revenue (billion), by Import Market Analysis (Value & Volume) 2025 & 2033
- Figure 7: North America Potash Ores Market Revenue Share (%), by Import Market Analysis (Value & Volume) 2025 & 2033
- Figure 8: North America Potash Ores Market Revenue (billion), by Export Market Analysis (Value & Volume) 2025 & 2033
- Figure 9: North America Potash Ores Market Revenue Share (%), by Export Market Analysis (Value & Volume) 2025 & 2033
- Figure 10: North America Potash Ores Market Revenue (billion), by Price Trend Analysis 2025 & 2033
- Figure 11: North America Potash Ores Market Revenue Share (%), by Price Trend Analysis 2025 & 2033
- Figure 12: North America Potash Ores Market Revenue (billion), by Country 2025 & 2033
- Figure 13: North America Potash Ores Market Revenue Share (%), by Country 2025 & 2033
- Figure 14: South America Potash Ores Market Revenue (billion), by Production Analysis 2025 & 2033
- Figure 15: South America Potash Ores Market Revenue Share (%), by Production Analysis 2025 & 2033
- Figure 16: South America Potash Ores Market Revenue (billion), by Consumption Analysis 2025 & 2033
- Figure 17: South America Potash Ores Market Revenue Share (%), by Consumption Analysis 2025 & 2033
- Figure 18: South America Potash Ores Market Revenue (billion), by Import Market Analysis (Value & Volume) 2025 & 2033
- Figure 19: South America Potash Ores Market Revenue Share (%), by Import Market Analysis (Value & Volume) 2025 & 2033
- Figure 20: South America Potash Ores Market Revenue (billion), by Export Market Analysis (Value & Volume) 2025 & 2033
- Figure 21: South America Potash Ores Market Revenue Share (%), by Export Market Analysis (Value & Volume) 2025 & 2033
- Figure 22: South America Potash Ores Market Revenue (billion), by Price Trend Analysis 2025 & 2033
- Figure 23: South America Potash Ores Market Revenue Share (%), by Price Trend Analysis 2025 & 2033
- Figure 24: South America Potash Ores Market Revenue (billion), by Country 2025 & 2033
- Figure 25: South America Potash Ores Market Revenue Share (%), by Country 2025 & 2033
- Figure 26: Europe Potash Ores Market Revenue (billion), by Production Analysis 2025 & 2033
- Figure 27: Europe Potash Ores Market Revenue Share (%), by Production Analysis 2025 & 2033
- Figure 28: Europe Potash Ores Market Revenue (billion), by Consumption Analysis 2025 & 2033
- Figure 29: Europe Potash Ores Market Revenue Share (%), by Consumption Analysis 2025 & 2033
- Figure 30: Europe Potash Ores Market Revenue (billion), by Import Market Analysis (Value & Volume) 2025 & 2033
- Figure 31: Europe Potash Ores Market Revenue Share (%), by Import Market Analysis (Value & Volume) 2025 & 2033
- Figure 32: Europe Potash Ores Market Revenue (billion), by Export Market Analysis (Value & Volume) 2025 & 2033
- Figure 33: Europe Potash Ores Market Revenue Share (%), by Export Market Analysis (Value & Volume) 2025 & 2033
- Figure 34: Europe Potash Ores Market Revenue (billion), by Price Trend Analysis 2025 & 2033
- Figure 35: Europe Potash Ores Market Revenue Share (%), by Price Trend Analysis 2025 & 2033
- Figure 36: Europe Potash Ores Market Revenue (billion), by Country 2025 & 2033
- Figure 37: Europe Potash Ores Market Revenue Share (%), by Country 2025 & 2033
- Figure 38: Middle East & Africa Potash Ores Market Revenue (billion), by Production Analysis 2025 & 2033
- Figure 39: Middle East & Africa Potash Ores Market Revenue Share (%), by Production Analysis 2025 & 2033
- Figure 40: Middle East & Africa Potash Ores Market Revenue (billion), by Consumption Analysis 2025 & 2033
- Figure 41: Middle East & Africa Potash Ores Market Revenue Share (%), by Consumption Analysis 2025 & 2033
- Figure 42: Middle East & Africa Potash Ores Market Revenue (billion), by Import Market Analysis (Value & Volume) 2025 & 2033
- Figure 43: Middle East & Africa Potash Ores Market Revenue Share (%), by Import Market Analysis (Value & Volume) 2025 & 2033
- Figure 44: Middle East & Africa Potash Ores Market Revenue (billion), by Export Market Analysis (Value & Volume) 2025 & 2033
- Figure 45: Middle East & Africa Potash Ores Market Revenue Share (%), by Export Market Analysis (Value & Volume) 2025 & 2033
- Figure 46: Middle East & Africa Potash Ores Market Revenue (billion), by Price Trend Analysis 2025 & 2033
- Figure 47: Middle East & Africa Potash Ores Market Revenue Share (%), by Price Trend Analysis 2025 & 2033
- Figure 48: Middle East & Africa Potash Ores Market Revenue (billion), by Country 2025 & 2033
- Figure 49: Middle East & Africa Potash Ores Market Revenue Share (%), by Country 2025 & 2033
- Figure 50: Asia Pacific Potash Ores Market Revenue (billion), by Production Analysis 2025 & 2033
- Figure 51: Asia Pacific Potash Ores Market Revenue Share (%), by Production Analysis 2025 & 2033
- Figure 52: Asia Pacific Potash Ores Market Revenue (billion), by Consumption Analysis 2025 & 2033
- Figure 53: Asia Pacific Potash Ores Market Revenue Share (%), by Consumption Analysis 2025 & 2033
- Figure 54: Asia Pacific Potash Ores Market Revenue (billion), by Import Market Analysis (Value & Volume) 2025 & 2033
- Figure 55: Asia Pacific Potash Ores Market Revenue Share (%), by Import Market Analysis (Value & Volume) 2025 & 2033
- Figure 56: Asia Pacific Potash Ores Market Revenue (billion), by Export Market Analysis (Value & Volume) 2025 & 2033
- Figure 57: Asia Pacific Potash Ores Market Revenue Share (%), by Export Market Analysis (Value & Volume) 2025 & 2033
- Figure 58: Asia Pacific Potash Ores Market Revenue (billion), by Price Trend Analysis 2025 & 2033
- Figure 59: Asia Pacific Potash Ores Market Revenue Share (%), by Price Trend Analysis 2025 & 2033
- Figure 60: Asia Pacific Potash Ores Market Revenue (billion), by Country 2025 & 2033
- Figure 61: Asia Pacific Potash Ores Market Revenue Share (%), by Country 2025 & 2033
List of Tables
- Table 1: Global Potash Ores Market Revenue billion Forecast, by Production Analysis 2020 & 2033
- Table 2: Global Potash Ores Market Revenue billion Forecast, by Consumption Analysis 2020 & 2033
- Table 3: Global Potash Ores Market Revenue billion Forecast, by Import Market Analysis (Value & Volume) 2020 & 2033
- Table 4: Global Potash Ores Market Revenue billion Forecast, by Export Market Analysis (Value & Volume) 2020 & 2033
- Table 5: Global Potash Ores Market Revenue billion Forecast, by Price Trend Analysis 2020 & 2033
- Table 6: Global Potash Ores Market Revenue billion Forecast, by Region 2020 & 2033
- Table 7: Global Potash Ores Market Revenue billion Forecast, by Production Analysis 2020 & 2033
- Table 8: Global Potash Ores Market Revenue billion Forecast, by Consumption Analysis 2020 & 2033
- Table 9: Global Potash Ores Market Revenue billion Forecast, by Import Market Analysis (Value & Volume) 2020 & 2033
- Table 10: Global Potash Ores Market Revenue billion Forecast, by Export Market Analysis (Value & Volume) 2020 & 2033
- Table 11: Global Potash Ores Market Revenue billion Forecast, by Price Trend Analysis 2020 & 2033
- Table 12: Global Potash Ores Market Revenue billion Forecast, by Country 2020 & 2033
- Table 13: United States Potash Ores Market Revenue (billion) Forecast, by Application 2020 & 2033
- Table 14: Canada Potash Ores Market Revenue (billion) Forecast, by Application 2020 & 2033
- Table 15: Mexico Potash Ores Market Revenue (billion) Forecast, by Application 2020 & 2033
- Table 16: Global Potash Ores Market Revenue billion Forecast, by Production Analysis 2020 & 2033
- Table 17: Global Potash Ores Market Revenue billion Forecast, by Consumption Analysis 2020 & 2033
- Table 18: Global Potash Ores Market Revenue billion Forecast, by Import Market Analysis (Value & Volume) 2020 & 2033
- Table 19: Global Potash Ores Market Revenue billion Forecast, by Export Market Analysis (Value & Volume) 2020 & 2033
- Table 20: Global Potash Ores Market Revenue billion Forecast, by Price Trend Analysis 2020 & 2033
- Table 21: Global Potash Ores Market Revenue billion Forecast, by Country 2020 & 2033
- Table 22: Brazil Potash Ores Market Revenue (billion) Forecast, by Application 2020 & 2033
- Table 23: Argentina Potash Ores Market Revenue (billion) Forecast, by Application 2020 & 2033
- Table 24: Rest of South America Potash Ores Market Revenue (billion) Forecast, by Application 2020 & 2033
- Table 25: Global Potash Ores Market Revenue billion Forecast, by Production Analysis 2020 & 2033
- Table 26: Global Potash Ores Market Revenue billion Forecast, by Consumption Analysis 2020 & 2033
- Table 27: Global Potash Ores Market Revenue billion Forecast, by Import Market Analysis (Value & Volume) 2020 & 2033
- Table 28: Global Potash Ores Market Revenue billion Forecast, by Export Market Analysis (Value & Volume) 2020 & 2033
- Table 29: Global Potash Ores Market Revenue billion Forecast, by Price Trend Analysis 2020 & 2033
- Table 30: Global Potash Ores Market Revenue billion Forecast, by Country 2020 & 2033
- Table 31: United Kingdom Potash Ores Market Revenue (billion) Forecast, by Application 2020 & 2033
- Table 32: Germany Potash Ores Market Revenue (billion) Forecast, by Application 2020 & 2033
- Table 33: France Potash Ores Market Revenue (billion) Forecast, by Application 2020 & 2033
- Table 34: Italy Potash Ores Market Revenue (billion) Forecast, by Application 2020 & 2033
- Table 35: Spain Potash Ores Market Revenue (billion) Forecast, by Application 2020 & 2033
- Table 36: Russia Potash Ores Market Revenue (billion) Forecast, by Application 2020 & 2033
- Table 37: Benelux Potash Ores Market Revenue (billion) Forecast, by Application 2020 & 2033
- Table 38: Nordics Potash Ores Market Revenue (billion) Forecast, by Application 2020 & 2033
- Table 39: Rest of Europe Potash Ores Market Revenue (billion) Forecast, by Application 2020 & 2033
- Table 40: Global Potash Ores Market Revenue billion Forecast, by Production Analysis 2020 & 2033
- Table 41: Global Potash Ores Market Revenue billion Forecast, by Consumption Analysis 2020 & 2033
- Table 42: Global Potash Ores Market Revenue billion Forecast, by Import Market Analysis (Value & Volume) 2020 & 2033
- Table 43: Global Potash Ores Market Revenue billion Forecast, by Export Market Analysis (Value & Volume) 2020 & 2033
- Table 44: Global Potash Ores Market Revenue billion Forecast, by Price Trend Analysis 2020 & 2033
- Table 45: Global Potash Ores Market Revenue billion Forecast, by Country 2020 & 2033
- Table 46: Turkey Potash Ores Market Revenue (billion) Forecast, by Application 2020 & 2033
- Table 47: Israel Potash Ores Market Revenue (billion) Forecast, by Application 2020 & 2033
- Table 48: GCC Potash Ores Market Revenue (billion) Forecast, by Application 2020 & 2033
- Table 49: North Africa Potash Ores Market Revenue (billion) Forecast, by Application 2020 & 2033
- Table 50: South Africa Potash Ores Market Revenue (billion) Forecast, by Application 2020 & 2033
- Table 51: Rest of Middle East & Africa Potash Ores Market Revenue (billion) Forecast, by Application 2020 & 2033
- Table 52: Global Potash Ores Market Revenue billion Forecast, by Production Analysis 2020 & 2033
- Table 53: Global Potash Ores Market Revenue billion Forecast, by Consumption Analysis 2020 & 2033
- Table 54: Global Potash Ores Market Revenue billion Forecast, by Import Market Analysis (Value & Volume) 2020 & 2033
- Table 55: Global Potash Ores Market Revenue billion Forecast, by Export Market Analysis (Value & Volume) 2020 & 2033
- Table 56: Global Potash Ores Market Revenue billion Forecast, by Price Trend Analysis 2020 & 2033
- Table 57: Global Potash Ores Market Revenue billion Forecast, by Country 2020 & 2033
- Table 58: China Potash Ores Market Revenue (billion) Forecast, by Application 2020 & 2033
- Table 59: India Potash Ores Market Revenue (billion) Forecast, by Application 2020 & 2033
- Table 60: Japan Potash Ores Market Revenue (billion) Forecast, by Application 2020 & 2033
- Table 61: South Korea Potash Ores Market Revenue (billion) Forecast, by Application 2020 & 2033
- Table 62: ASEAN Potash Ores Market Revenue (billion) Forecast, by Application 2020 & 2033
- Table 63: Oceania Potash Ores Market Revenue (billion) Forecast, by Application 2020 & 2033
- Table 64: Rest of Asia Pacific Potash Ores Market Revenue (billion) Forecast, by Application 2020 & 2033
Frequently Asked Questions
1. What is the projected Compound Annual Growth Rate (CAGR) of the Potash Ores Market?
The projected CAGR is approximately 8.9%.
2. Which companies are prominent players in the Potash Ores Market?
Key companies in the market include The Mosaic Co, Coromandel International Ltd, Nutrien Limited, Sociedad Química y Minera (SQM), Petrokemija DD Fertilizer Factory, Sinofert Holdings Ltd, Eurochem, Intrepid Potash Inc, K+S AKTIENGESELLSCHAFT.
3. What are the main segments of the Potash Ores Market?
The market segments include Production Analysis, Consumption Analysis, Import Market Analysis (Value & Volume), Export Market Analysis (Value & Volume), Price Trend Analysis.
4. Can you provide details about the market size?
The market size is estimated to be USD 66.11 billion as of 2022.
5. What are some drivers contributing to market growth?
Shortage of Skilled Labor; Government Support to Enhance Farm Mechanization.
6. What are the notable trends driving market growth?
MoP is the largest segment by Product..
7. Are there any restraints impacting market growth?
Heavy Initial Procurement Cost and High Expenditure on Maintenance.
8. Can you provide examples of recent developments in the market?
March 2022: EuroChem Group announced that it has completed the purchase of the share holding control of Brazilian distributor Fertilizantes Heringer SA, with 51.48% of the shares, further strengthening its production and distribution capacity in Brazil.March 2021: Mosaic announced a partnership with Sound Agriculture to develop and distribute a nutrient efficiency product. Sound Agriculture will focus on manufacturing of the active ingredient and product formulation, while Mosaic will oversee field development, regulatory, sales and marketing efforts. The product leverage Sound Agrculture Bio-inspired chemistry that activates the soil microbiome to give plants access to important nutrients and allow growers to optimize fertilizer inputs.It is expected to release in 2023 for US market.February 2019: Nutrien Ltd. acquired Van Horn, Inc. (Van Horn), a leading US retailer and agricultural services provider which serve over 5,000 customers in 18 counties to grow their Retail business.
9. What pricing options are available for accessing the report?
Pricing options include single-user, multi-user, and enterprise licenses priced at USD 3800, USD 4500, and USD 5800 respectively.
10. Is the market size provided in terms of value or volume?
The market size is provided in terms of value, measured in billion.
11. Are there any specific market keywords associated with the report?
Yes, the market keyword associated with the report is "Potash Ores Market," which aids in identifying and referencing the specific market segment covered.
12. How do I determine which pricing option suits my needs best?
The pricing options vary based on user requirements and access needs. Individual users may opt for single-user licenses, while businesses requiring broader access may choose multi-user or enterprise licenses for cost-effective access to the report.
13. Are there any additional resources or data provided in the Potash Ores Market report?
While the report offers comprehensive insights, it's advisable to review the specific contents or supplementary materials provided to ascertain if additional resources or data are available.
14. How can I stay updated on further developments or reports in the Potash Ores Market?
To stay informed about further developments, trends, and reports in the Potash Ores Market, consider subscribing to industry newsletters, following relevant companies and organizations, or regularly checking reputable industry news sources and publications.
Methodology
Step 1 - Identification of Relevant Samples Size from Population Database


Step 2 - Approaches for Defining Global Market Size (Value, Volume* & Price*)

Note*: In applicable scenarios
Step 3 - Data Sources
Primary Research
- Web Analytics
- Survey Reports
- Research Institute
- Latest Research Reports
- Opinion Leaders
Secondary Research
- Annual Reports
- White Paper
- Latest Press Release
- Industry Association
- Paid Database
- Investor Presentations

Step 4 - Data Triangulation
Involves using different sources of information in order to increase the validity of a study
These sources are likely to be stakeholders in a program - participants, other researchers, program staff, other community members, and so on.
Then we put all data in single framework & apply various statistical tools to find out the dynamic on the market.
During the analysis stage, feedback from the stakeholder groups would be compared to determine areas of agreement as well as areas of divergence