

Key Insights
The global protective eyewear market, encompassing spectacles, welding glasses, overspecs, and goggles, is a mature yet stable sector. Driven by escalating industrial safety regulations and heightened awareness of eye injury prevention across diverse industries, the market demonstrates consistent growth. While a historical CAGR of 4.54% may indicate a period of stabilization, the continuous expansion of sectors such as construction, manufacturing, and oil & gas, alongside technological advancements in materials and design for enhanced durability and protection, forecasts modest positive growth. The market is segmented by product type and end-user industry, with construction, automotive, and manufacturing emerging as primary consumers. North America and Europe currently lead in market share due to robust safety standards and regulatory frameworks. However, the Asia-Pacific region is positioned for significant expansion, fueled by industrialization and rising disposable incomes, thereby increasing demand for safety equipment. Intense market competition features established players like 3M, Honeywell, and Bolle Safety, alongside specialized manufacturers. Future growth will be propelled by innovations in lens technology for specialized hazard protection (e.g., laser, UV), integration of smart technologies for worker safety monitoring, and increased adoption of personalized eyewear for improved comfort and compliance.
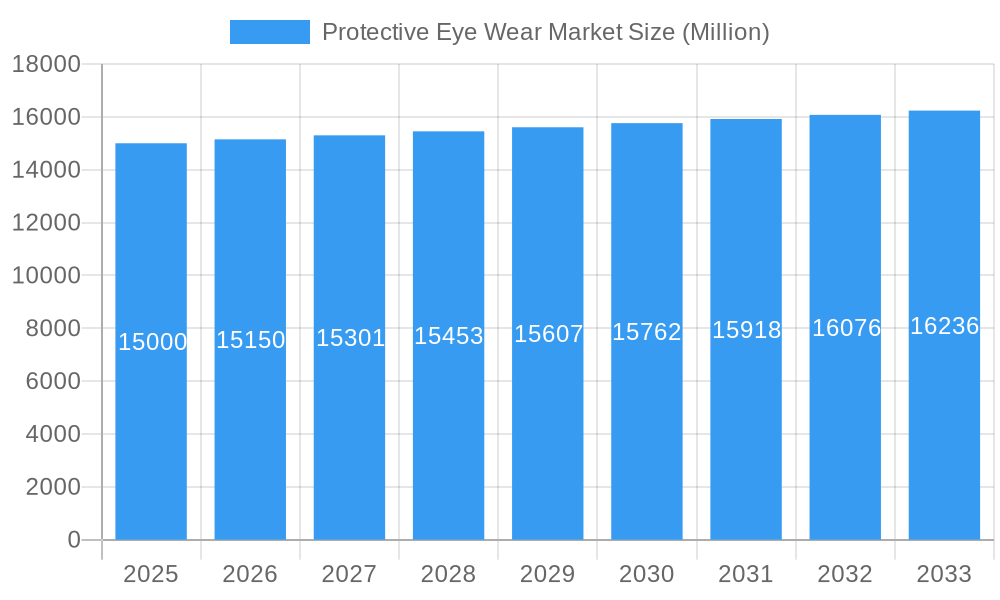
Protective Eye Wear Market Market Size (In Billion)
Economic downturns impacting capital expenditure and cyclical industry fluctuations may influence short-term market growth. Nevertheless, the long-term outlook remains positive, underpinned by the persistent need for eye protection in hazardous environments and ongoing advancements in safety technologies. Strategic expansion into emerging markets and a focus on product differentiation are critical for manufacturers to achieve a competitive advantage. Product innovation and diversification, particularly in specialized eyewear for niche industries, will be pivotal in driving future market expansion. Effective marketing and communication strategies emphasizing the importance of eye safety and the benefits of advanced protective eyewear will be instrumental in shaping consumer behavior and accelerating market adoption.
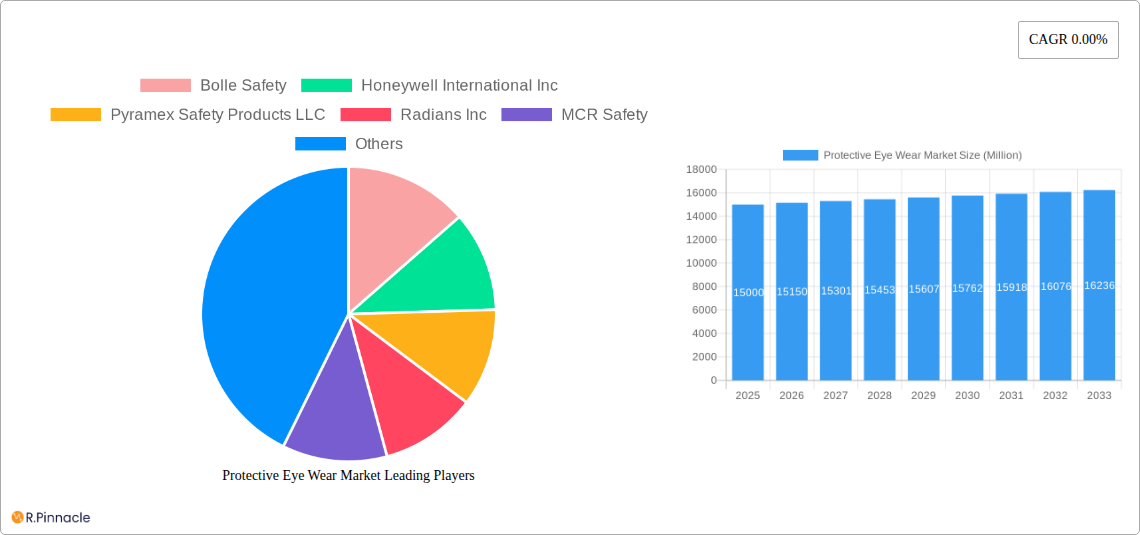
Protective Eye Wear Market Company Market Share
Protective Eyewear Market Analysis: Forecast 2025-2033
This comprehensive report delivers a detailed analysis of the global protective eyewear market, offering critical insights for industry professionals, investors, and strategic decision-makers. Spanning the forecast period 2025-2033, with a base year of 2025, this report elucidates market dynamics, growth drivers, competitive landscapes, and emerging trends. The study integrates historical data and projections to facilitate informed strategic planning. The market is valued at $4.38 billion in 2025 and is projected to reach substantial future valuations, exhibiting a Compound Annual Growth Rate (CAGR) of 4.54%.
Protective Eye Wear Market Structure & Innovation Trends
The protective eyewear market exhibits a moderately concentrated structure, with key players such as Bolle Safety, Honeywell International Inc, and 3M Company holding significant market share. However, several smaller, specialized companies also contribute to the overall market dynamics. Innovation is driven by the increasing demand for enhanced protection, comfort, and stylistic features. Stringent safety regulations across various industries are also significant drivers. Product substitutes, such as contact lenses with protective coatings, represent a niche challenge, while mergers and acquisitions (M&A) activity plays a role in shaping the competitive landscape. Recent M&A deal values are estimated at xx Million annually.
- Market Concentration: Moderately concentrated, with top players holding xx% market share collectively.
- Innovation Drivers: Enhanced protection, comfort, style, and regulatory compliance.
- Regulatory Frameworks: Stringent safety standards influencing product design and development.
- Product Substitutes: Limited impact from contact lenses with protective coatings.
- End-User Demographics: Primarily focused on industrial workers, healthcare professionals, and athletes.
- M&A Activity: Consistent activity contributing to market consolidation, with annual deal values estimated at xx Million.
Protective Eye Wear Market Market Dynamics & Trends
The protective eyewear market is experiencing robust growth, propelled by several key factors. The rising prevalence of workplace injuries necessitates protective eyewear, and increasing awareness of eye safety is bolstering demand. Technological advancements such as improved lens materials (e.g., polycarbonate) and anti-fog coatings are driving market expansion. Consumer preferences are shifting towards lightweight, comfortable, and stylish designs. Competitive dynamics are characterized by innovation, branding, and distribution strategies. The market penetration of advanced features like UV protection and impact resistance is steadily increasing.
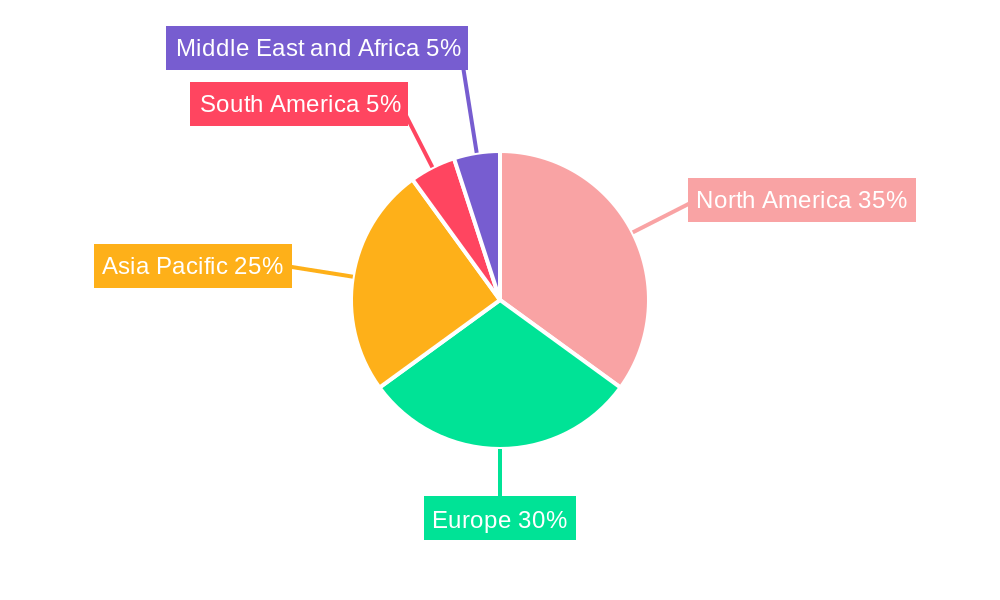
Dominant Regions & Segments in Protective Eye Wear Market
The North American region currently dominates the protective eyewear market, driven by stringent safety regulations and a large industrial sector. Within product types, spectacles and goggles comprise the largest market segments, followed by welding protection glasses and overspecs. Among end-user industries, construction and automotive lead in terms of consumption.
- Key Drivers in North America: Stringent safety regulations, large industrial base, and high disposable income.
- Key Drivers in Construction: High risk of eye injuries, mandatory safety regulations, and large workforce.
- Key Drivers in Automotive: Stringent safety standards, large manufacturing base, and use in assembly lines.
The dominance of North America is further solidified by high per capita income, strong industrial development, and increased awareness of occupational safety standards. However, Asia-Pacific is expected to exhibit strong growth due to industrialization and increasing workforce in manufacturing and construction industries.
Protective Eye Wear Market Product Innovations
Recent product developments focus on enhanced protection, comfort, and style. New lens materials offer superior impact resistance and clarity. Anti-fog and anti-scratch coatings are becoming increasingly common. The integration of advanced features like Bluetooth connectivity and augmented reality functionalities are emerging as niche applications. These innovations cater to the evolving needs of diverse end-users, enhancing market fit and competitive advantage.
Report Scope & Segmentation Analysis
This report segments the protective eyewear market by product type (spectacles, welding protection glasses, overspecs, goggles) and end-user industry (automotive, construction, food industry, pharmaceutical, mining, oil and gas, other). Each segment's market size, growth projections, and competitive dynamics are analyzed in detail. The global market is projected to reach xx Million by 2033, with significant variations across segments. The construction and automotive sectors are expected to drive the strongest growth.
Key Drivers of Protective Eye Wear Market Growth
Several factors drive market growth. Stringent safety regulations across various industries mandate protective eyewear use, technological advancements in lens materials and coatings enhance protection and comfort, and the increasing awareness of eye safety among workers and consumers fuels demand. Rising disposable incomes in emerging economies also contribute.
Challenges in the Protective Eye Wear Market Sector
The market faces challenges such as intense competition, fluctuating raw material prices impacting manufacturing costs, and the potential for counterfeit products. Supply chain disruptions and the stringent regulatory landscape also pose significant hurdles to market expansion. These factors can create volatility in market growth.
Emerging Opportunities in Protective Eye Wear Market
Emerging opportunities lie in developing specialized eyewear for niche applications (e.g., sports, healthcare), integrating advanced technologies (e.g., sensors, smart features), and expanding into new markets with rising industrialization. Sustainable and eco-friendly materials are gaining traction, offering opportunities for environmentally conscious products.
Key Developments in Protective Eye Wear Market Industry
- October 2021: Uvex Group launched the Uvex i-range (uvex i-lite, uvex i-guard, uvex i-guard plus) safety eyewear with UV 400 protection. This broadened their product portfolio and enhanced their market competitiveness.
- October 2021: Uvex Group launched Uvex-Purefit, 100% recyclable safety spectacles. This aligns with growing environmental consciousness.
- June 2021: MCR Safety launched the Memphis safety glass series with enhanced anti-fog and UV protection. This improved product performance and enhanced customer appeal.
Future Outlook for Protective Eye Wear Market Market
The future of the protective eyewear market looks promising, driven by technological advancements, increasing awareness of eye safety, and stringent regulatory frameworks. Strategic partnerships, expansion into new markets, and the development of innovative products will shape future growth. The market's continuous evolution ensures significant opportunities for growth and innovation in the coming years.
Protective Eye Wear Market Segmentation
-
1. Product Type
- 1.1. Spectacles
- 1.2. Welding Protection Glasses
- 1.3. Overspecs
- 1.4. Goggles
-
2. End-User Industry
- 2.1. Automotive
- 2.2. Construction
- 2.3. Food Industry
- 2.4. Pharmaceutical
- 2.5. Mining
- 2.6. Oil and Gas
- 2.7. Other End-User Industries
Protective Eye Wear Market Segmentation By Geography
-
1. North America
- 1.1. United States
- 1.2. Canada
- 1.3. Mexico
- 1.4. Rest of North America
-
2. Europe
- 2.1. Spain
- 2.2. United Kingdom
- 2.3. Germany
- 2.4. France
- 2.5. Italy
- 2.6. Russia
- 2.7. Rest of Europe
-
3. Asia Pacific
- 3.1. China
- 3.2. Japan
- 3.3. India
- 3.4. Australia
- 3.5. Rest of Asia Pacific
-
4. South America
- 4.1. Brazil
- 4.2. Argentina
- 4.3. Rest of South America
-
5. Middle East and Africa
- 5.1. South Africa
- 5.2. United Arab Emirates
- 5.3. Rest of Middle East and Africa
Protective Eye Wear Market Regional Market Share
Geographic Coverage of Protective Eye Wear Market
Protective Eye Wear Market REPORT HIGHLIGHTS
| Aspects | Details |
|---|---|
| Study Period | 2020-2034 |
| Base Year | 2025 |
| Estimated Year | 2026 |
| Forecast Period | 2026-2034 |
| Historical Period | 2020-2025 |
| Growth Rate | CAGR of 4.54% from 2020-2034 |
| Segmentation |
|
Table of Contents
- 1. Introduction
- 1.1. Research Scope
- 1.2. Market Segmentation
- 1.3. Research Objective
- 1.4. Definitions and Assumptions
- 2. Executive Summary
- 2.1. Market Snapshot
- 3. Market Dynamics
- 3.1. Market Drivers
- 3.2. Market Restrains
- 3.3. Market Trends
- 3.4. Market Opportunities
- 4. Market Factor Analysis
- 4.1. Porters Five Forces
- 4.1.1. Bargaining Power of Suppliers
- 4.1.2. Bargaining Power of Buyers
- 4.1.3. Threat of New Entrants
- 4.1.4. Threat of Substitutes
- 4.1.5. Competitive Rivalry
- 4.2. PESTEL analysis
- 4.3. BCG Analysis
- 4.3.1. Stars (High Growth, High Market Share)
- 4.3.2. Cash Cows (Low Growth, High Market Share)
- 4.3.3. Question Mark (High Growth, Low Market Share)
- 4.3.4. Dogs (Low Growth, Low Market Share)
- 4.4. Ansoff Matrix Analysis
- 4.5. Supply Chain Analysis
- 4.6. Regulatory Landscape
- 4.7. Current Market Potential and Opportunity Assessment (TAM–SAM–SOM Framework)
- 4.8. PRI Analyst Note
- 4.1. Porters Five Forces
- 5. Market Analysis, Insights and Forecast 2021-2033
- 5.1. Market Analysis, Insights and Forecast - by Product Type
- 5.1.1. Spectacles
- 5.1.2. Welding Protection Glasses
- 5.1.3. Overspecs
- 5.1.4. Goggles
- 5.2. Market Analysis, Insights and Forecast - by End-User Industry
- 5.2.1. Automotive
- 5.2.2. Construction
- 5.2.3. Food Industry
- 5.2.4. Pharmaceutical
- 5.2.5. Mining
- 5.2.6. Oil and Gas
- 5.2.7. Other End-User Industries
- 5.3. Market Analysis, Insights and Forecast - by Region
- 5.3.1. North America
- 5.3.2. Europe
- 5.3.3. Asia Pacific
- 5.3.4. South America
- 5.3.5. Middle East and Africa
- 5.1. Market Analysis, Insights and Forecast - by Product Type
- 6. Global Protective Eye Wear Market Analysis, Insights and Forecast, 2021-2033
- 6.1. Market Analysis, Insights and Forecast - by Product Type
- 6.1.1. Spectacles
- 6.1.2. Welding Protection Glasses
- 6.1.3. Overspecs
- 6.1.4. Goggles
- 6.2. Market Analysis, Insights and Forecast - by End-User Industry
- 6.2.1. Automotive
- 6.2.2. Construction
- 6.2.3. Food Industry
- 6.2.4. Pharmaceutical
- 6.2.5. Mining
- 6.2.6. Oil and Gas
- 6.2.7. Other End-User Industries
- 6.1. Market Analysis, Insights and Forecast - by Product Type
- 7. North America Protective Eye Wear Market Analysis, Insights and Forecast, 2020-2032
- 7.1. Market Analysis, Insights and Forecast - by Product Type
- 7.1.1. Spectacles
- 7.1.2. Welding Protection Glasses
- 7.1.3. Overspecs
- 7.1.4. Goggles
- 7.2. Market Analysis, Insights and Forecast - by End-User Industry
- 7.2.1. Automotive
- 7.2.2. Construction
- 7.2.3. Food Industry
- 7.2.4. Pharmaceutical
- 7.2.5. Mining
- 7.2.6. Oil and Gas
- 7.2.7. Other End-User Industries
- 7.1. Market Analysis, Insights and Forecast - by Product Type
- 8. Europe Protective Eye Wear Market Analysis, Insights and Forecast, 2020-2032
- 8.1. Market Analysis, Insights and Forecast - by Product Type
- 8.1.1. Spectacles
- 8.1.2. Welding Protection Glasses
- 8.1.3. Overspecs
- 8.1.4. Goggles
- 8.2. Market Analysis, Insights and Forecast - by End-User Industry
- 8.2.1. Automotive
- 8.2.2. Construction
- 8.2.3. Food Industry
- 8.2.4. Pharmaceutical
- 8.2.5. Mining
- 8.2.6. Oil and Gas
- 8.2.7. Other End-User Industries
- 8.1. Market Analysis, Insights and Forecast - by Product Type
- 9. Asia Pacific Protective Eye Wear Market Analysis, Insights and Forecast, 2020-2032
- 9.1. Market Analysis, Insights and Forecast - by Product Type
- 9.1.1. Spectacles
- 9.1.2. Welding Protection Glasses
- 9.1.3. Overspecs
- 9.1.4. Goggles
- 9.2. Market Analysis, Insights and Forecast - by End-User Industry
- 9.2.1. Automotive
- 9.2.2. Construction
- 9.2.3. Food Industry
- 9.2.4. Pharmaceutical
- 9.2.5. Mining
- 9.2.6. Oil and Gas
- 9.2.7. Other End-User Industries
- 9.1. Market Analysis, Insights and Forecast - by Product Type
- 10. South America Protective Eye Wear Market Analysis, Insights and Forecast, 2020-2032
- 10.1. Market Analysis, Insights and Forecast - by Product Type
- 10.1.1. Spectacles
- 10.1.2. Welding Protection Glasses
- 10.1.3. Overspecs
- 10.1.4. Goggles
- 10.2. Market Analysis, Insights and Forecast - by End-User Industry
- 10.2.1. Automotive
- 10.2.2. Construction
- 10.2.3. Food Industry
- 10.2.4. Pharmaceutical
- 10.2.5. Mining
- 10.2.6. Oil and Gas
- 10.2.7. Other End-User Industries
- 10.1. Market Analysis, Insights and Forecast - by Product Type
- 11. Middle East and Africa Protective Eye Wear Market Analysis, Insights and Forecast, 2020-2032
- 11.1. Market Analysis, Insights and Forecast - by Product Type
- 11.1.1. Spectacles
- 11.1.2. Welding Protection Glasses
- 11.1.3. Overspecs
- 11.1.4. Goggles
- 11.2. Market Analysis, Insights and Forecast - by End-User Industry
- 11.2.1. Automotive
- 11.2.2. Construction
- 11.2.3. Food Industry
- 11.2.4. Pharmaceutical
- 11.2.5. Mining
- 11.2.6. Oil and Gas
- 11.2.7. Other End-User Industries
- 11.1. Market Analysis, Insights and Forecast - by Product Type
- 12. Competitive Analysis
- 12.1. Company Profiles
- 12.1.1 Bolle Safety
- 12.1.1.1. Company Overview
- 12.1.1.2. Products
- 12.1.1.3. Company Financials
- 12.1.1.4. SWOT Analysis
- 12.1.2 Honeywell International Inc
- 12.1.2.1. Company Overview
- 12.1.2.2. Products
- 12.1.2.3. Company Financials
- 12.1.2.4. SWOT Analysis
- 12.1.3 Pyramex Safety Products LLC
- 12.1.3.1. Company Overview
- 12.1.3.2. Products
- 12.1.3.3. Company Financials
- 12.1.3.4. SWOT Analysis
- 12.1.4 Radians Inc
- 12.1.4.1. Company Overview
- 12.1.4.2. Products
- 12.1.4.3. Company Financials
- 12.1.4.4. SWOT Analysis
- 12.1.5 MCR Safety
- 12.1.5.1. Company Overview
- 12.1.5.2. Products
- 12.1.5.3. Company Financials
- 12.1.5.4. SWOT Analysis
- 12.1.6 uvex group
- 12.1.6.1. Company Overview
- 12.1.6.2. Products
- 12.1.6.3. Company Financials
- 12.1.6.4. SWOT Analysis
- 12.1.7 3M Company
- 12.1.7.1. Company Overview
- 12.1.7.2. Products
- 12.1.7.3. Company Financials
- 12.1.7.4. SWOT Analysis
- 12.1.8 Phillips Safety Products In
- 12.1.8.1. Company Overview
- 12.1.8.2. Products
- 12.1.8.3. Company Financials
- 12.1.8.4. SWOT Analysis
- 12.1.9 Gateway Safety Inc
- 12.1.9.1. Company Overview
- 12.1.9.2. Products
- 12.1.9.3. Company Financials
- 12.1.9.4. SWOT Analysis
- 12.1.10 SSP Eyewear
- 12.1.10.1. Company Overview
- 12.1.10.2. Products
- 12.1.10.3. Company Financials
- 12.1.10.4. SWOT Analysis
- 12.1.1 Bolle Safety
- 12.2. Market Entropy
- 12.2.1 Company's Key Areas Served
- 12.2.2 Recent Developments
- 12.3. Company Market Share Analysis 2025
- 12.3.1 Top 5 Companies Market Share Analysis
- 12.3.2 Top 3 Companies Market Share Analysis
- 12.4. List of Potential Customers
- 13. Research Methodology
List of Figures
- Figure 1: Global Protective Eye Wear Market Revenue Breakdown (billion, %) by Region 2025 & 2033
- Figure 2: Global Protective Eye Wear Market Volume Breakdown (K Units, %) by Region 2025 & 2033
- Figure 3: North America Protective Eye Wear Market Revenue (billion), by Product Type 2025 & 2033
- Figure 4: North America Protective Eye Wear Market Volume (K Units), by Product Type 2025 & 2033
- Figure 5: North America Protective Eye Wear Market Revenue Share (%), by Product Type 2025 & 2033
- Figure 6: North America Protective Eye Wear Market Volume Share (%), by Product Type 2025 & 2033
- Figure 7: North America Protective Eye Wear Market Revenue (billion), by End-User Industry 2025 & 2033
- Figure 8: North America Protective Eye Wear Market Volume (K Units), by End-User Industry 2025 & 2033
- Figure 9: North America Protective Eye Wear Market Revenue Share (%), by End-User Industry 2025 & 2033
- Figure 10: North America Protective Eye Wear Market Volume Share (%), by End-User Industry 2025 & 2033
- Figure 11: North America Protective Eye Wear Market Revenue (billion), by Country 2025 & 2033
- Figure 12: North America Protective Eye Wear Market Volume (K Units), by Country 2025 & 2033
- Figure 13: North America Protective Eye Wear Market Revenue Share (%), by Country 2025 & 2033
- Figure 14: North America Protective Eye Wear Market Volume Share (%), by Country 2025 & 2033
- Figure 15: Europe Protective Eye Wear Market Revenue (billion), by Product Type 2025 & 2033
- Figure 16: Europe Protective Eye Wear Market Volume (K Units), by Product Type 2025 & 2033
- Figure 17: Europe Protective Eye Wear Market Revenue Share (%), by Product Type 2025 & 2033
- Figure 18: Europe Protective Eye Wear Market Volume Share (%), by Product Type 2025 & 2033
- Figure 19: Europe Protective Eye Wear Market Revenue (billion), by End-User Industry 2025 & 2033
- Figure 20: Europe Protective Eye Wear Market Volume (K Units), by End-User Industry 2025 & 2033
- Figure 21: Europe Protective Eye Wear Market Revenue Share (%), by End-User Industry 2025 & 2033
- Figure 22: Europe Protective Eye Wear Market Volume Share (%), by End-User Industry 2025 & 2033
- Figure 23: Europe Protective Eye Wear Market Revenue (billion), by Country 2025 & 2033
- Figure 24: Europe Protective Eye Wear Market Volume (K Units), by Country 2025 & 2033
- Figure 25: Europe Protective Eye Wear Market Revenue Share (%), by Country 2025 & 2033
- Figure 26: Europe Protective Eye Wear Market Volume Share (%), by Country 2025 & 2033
- Figure 27: Asia Pacific Protective Eye Wear Market Revenue (billion), by Product Type 2025 & 2033
- Figure 28: Asia Pacific Protective Eye Wear Market Volume (K Units), by Product Type 2025 & 2033
- Figure 29: Asia Pacific Protective Eye Wear Market Revenue Share (%), by Product Type 2025 & 2033
- Figure 30: Asia Pacific Protective Eye Wear Market Volume Share (%), by Product Type 2025 & 2033
- Figure 31: Asia Pacific Protective Eye Wear Market Revenue (billion), by End-User Industry 2025 & 2033
- Figure 32: Asia Pacific Protective Eye Wear Market Volume (K Units), by End-User Industry 2025 & 2033
- Figure 33: Asia Pacific Protective Eye Wear Market Revenue Share (%), by End-User Industry 2025 & 2033
- Figure 34: Asia Pacific Protective Eye Wear Market Volume Share (%), by End-User Industry 2025 & 2033
- Figure 35: Asia Pacific Protective Eye Wear Market Revenue (billion), by Country 2025 & 2033
- Figure 36: Asia Pacific Protective Eye Wear Market Volume (K Units), by Country 2025 & 2033
- Figure 37: Asia Pacific Protective Eye Wear Market Revenue Share (%), by Country 2025 & 2033
- Figure 38: Asia Pacific Protective Eye Wear Market Volume Share (%), by Country 2025 & 2033
- Figure 39: South America Protective Eye Wear Market Revenue (billion), by Product Type 2025 & 2033
- Figure 40: South America Protective Eye Wear Market Volume (K Units), by Product Type 2025 & 2033
- Figure 41: South America Protective Eye Wear Market Revenue Share (%), by Product Type 2025 & 2033
- Figure 42: South America Protective Eye Wear Market Volume Share (%), by Product Type 2025 & 2033
- Figure 43: South America Protective Eye Wear Market Revenue (billion), by End-User Industry 2025 & 2033
- Figure 44: South America Protective Eye Wear Market Volume (K Units), by End-User Industry 2025 & 2033
- Figure 45: South America Protective Eye Wear Market Revenue Share (%), by End-User Industry 2025 & 2033
- Figure 46: South America Protective Eye Wear Market Volume Share (%), by End-User Industry 2025 & 2033
- Figure 47: South America Protective Eye Wear Market Revenue (billion), by Country 2025 & 2033
- Figure 48: South America Protective Eye Wear Market Volume (K Units), by Country 2025 & 2033
- Figure 49: South America Protective Eye Wear Market Revenue Share (%), by Country 2025 & 2033
- Figure 50: South America Protective Eye Wear Market Volume Share (%), by Country 2025 & 2033
- Figure 51: Middle East and Africa Protective Eye Wear Market Revenue (billion), by Product Type 2025 & 2033
- Figure 52: Middle East and Africa Protective Eye Wear Market Volume (K Units), by Product Type 2025 & 2033
- Figure 53: Middle East and Africa Protective Eye Wear Market Revenue Share (%), by Product Type 2025 & 2033
- Figure 54: Middle East and Africa Protective Eye Wear Market Volume Share (%), by Product Type 2025 & 2033
- Figure 55: Middle East and Africa Protective Eye Wear Market Revenue (billion), by End-User Industry 2025 & 2033
- Figure 56: Middle East and Africa Protective Eye Wear Market Volume (K Units), by End-User Industry 2025 & 2033
- Figure 57: Middle East and Africa Protective Eye Wear Market Revenue Share (%), by End-User Industry 2025 & 2033
- Figure 58: Middle East and Africa Protective Eye Wear Market Volume Share (%), by End-User Industry 2025 & 2033
- Figure 59: Middle East and Africa Protective Eye Wear Market Revenue (billion), by Country 2025 & 2033
- Figure 60: Middle East and Africa Protective Eye Wear Market Volume (K Units), by Country 2025 & 2033
- Figure 61: Middle East and Africa Protective Eye Wear Market Revenue Share (%), by Country 2025 & 2033
- Figure 62: Middle East and Africa Protective Eye Wear Market Volume Share (%), by Country 2025 & 2033
List of Tables
- Table 1: Global Protective Eye Wear Market Revenue billion Forecast, by Product Type 2020 & 2033
- Table 2: Global Protective Eye Wear Market Volume K Units Forecast, by Product Type 2020 & 2033
- Table 3: Global Protective Eye Wear Market Revenue billion Forecast, by End-User Industry 2020 & 2033
- Table 4: Global Protective Eye Wear Market Volume K Units Forecast, by End-User Industry 2020 & 2033
- Table 5: Global Protective Eye Wear Market Revenue billion Forecast, by Region 2020 & 2033
- Table 6: Global Protective Eye Wear Market Volume K Units Forecast, by Region 2020 & 2033
- Table 7: Global Protective Eye Wear Market Revenue billion Forecast, by Product Type 2020 & 2033
- Table 8: Global Protective Eye Wear Market Volume K Units Forecast, by Product Type 2020 & 2033
- Table 9: Global Protective Eye Wear Market Revenue billion Forecast, by End-User Industry 2020 & 2033
- Table 10: Global Protective Eye Wear Market Volume K Units Forecast, by End-User Industry 2020 & 2033
- Table 11: Global Protective Eye Wear Market Revenue billion Forecast, by Country 2020 & 2033
- Table 12: Global Protective Eye Wear Market Volume K Units Forecast, by Country 2020 & 2033
- Table 13: United States Protective Eye Wear Market Revenue (billion) Forecast, by Application 2020 & 2033
- Table 14: United States Protective Eye Wear Market Volume (K Units) Forecast, by Application 2020 & 2033
- Table 15: Canada Protective Eye Wear Market Revenue (billion) Forecast, by Application 2020 & 2033
- Table 16: Canada Protective Eye Wear Market Volume (K Units) Forecast, by Application 2020 & 2033
- Table 17: Mexico Protective Eye Wear Market Revenue (billion) Forecast, by Application 2020 & 2033
- Table 18: Mexico Protective Eye Wear Market Volume (K Units) Forecast, by Application 2020 & 2033
- Table 19: Rest of North America Protective Eye Wear Market Revenue (billion) Forecast, by Application 2020 & 2033
- Table 20: Rest of North America Protective Eye Wear Market Volume (K Units) Forecast, by Application 2020 & 2033
- Table 21: Global Protective Eye Wear Market Revenue billion Forecast, by Product Type 2020 & 2033
- Table 22: Global Protective Eye Wear Market Volume K Units Forecast, by Product Type 2020 & 2033
- Table 23: Global Protective Eye Wear Market Revenue billion Forecast, by End-User Industry 2020 & 2033
- Table 24: Global Protective Eye Wear Market Volume K Units Forecast, by End-User Industry 2020 & 2033
- Table 25: Global Protective Eye Wear Market Revenue billion Forecast, by Country 2020 & 2033
- Table 26: Global Protective Eye Wear Market Volume K Units Forecast, by Country 2020 & 2033
- Table 27: Spain Protective Eye Wear Market Revenue (billion) Forecast, by Application 2020 & 2033
- Table 28: Spain Protective Eye Wear Market Volume (K Units) Forecast, by Application 2020 & 2033
- Table 29: United Kingdom Protective Eye Wear Market Revenue (billion) Forecast, by Application 2020 & 2033
- Table 30: United Kingdom Protective Eye Wear Market Volume (K Units) Forecast, by Application 2020 & 2033
- Table 31: Germany Protective Eye Wear Market Revenue (billion) Forecast, by Application 2020 & 2033
- Table 32: Germany Protective Eye Wear Market Volume (K Units) Forecast, by Application 2020 & 2033
- Table 33: France Protective Eye Wear Market Revenue (billion) Forecast, by Application 2020 & 2033
- Table 34: France Protective Eye Wear Market Volume (K Units) Forecast, by Application 2020 & 2033
- Table 35: Italy Protective Eye Wear Market Revenue (billion) Forecast, by Application 2020 & 2033
- Table 36: Italy Protective Eye Wear Market Volume (K Units) Forecast, by Application 2020 & 2033
- Table 37: Russia Protective Eye Wear Market Revenue (billion) Forecast, by Application 2020 & 2033
- Table 38: Russia Protective Eye Wear Market Volume (K Units) Forecast, by Application 2020 & 2033
- Table 39: Rest of Europe Protective Eye Wear Market Revenue (billion) Forecast, by Application 2020 & 2033
- Table 40: Rest of Europe Protective Eye Wear Market Volume (K Units) Forecast, by Application 2020 & 2033
- Table 41: Global Protective Eye Wear Market Revenue billion Forecast, by Product Type 2020 & 2033
- Table 42: Global Protective Eye Wear Market Volume K Units Forecast, by Product Type 2020 & 2033
- Table 43: Global Protective Eye Wear Market Revenue billion Forecast, by End-User Industry 2020 & 2033
- Table 44: Global Protective Eye Wear Market Volume K Units Forecast, by End-User Industry 2020 & 2033
- Table 45: Global Protective Eye Wear Market Revenue billion Forecast, by Country 2020 & 2033
- Table 46: Global Protective Eye Wear Market Volume K Units Forecast, by Country 2020 & 2033
- Table 47: China Protective Eye Wear Market Revenue (billion) Forecast, by Application 2020 & 2033
- Table 48: China Protective Eye Wear Market Volume (K Units) Forecast, by Application 2020 & 2033
- Table 49: Japan Protective Eye Wear Market Revenue (billion) Forecast, by Application 2020 & 2033
- Table 50: Japan Protective Eye Wear Market Volume (K Units) Forecast, by Application 2020 & 2033
- Table 51: India Protective Eye Wear Market Revenue (billion) Forecast, by Application 2020 & 2033
- Table 52: India Protective Eye Wear Market Volume (K Units) Forecast, by Application 2020 & 2033
- Table 53: Australia Protective Eye Wear Market Revenue (billion) Forecast, by Application 2020 & 2033
- Table 54: Australia Protective Eye Wear Market Volume (K Units) Forecast, by Application 2020 & 2033
- Table 55: Rest of Asia Pacific Protective Eye Wear Market Revenue (billion) Forecast, by Application 2020 & 2033
- Table 56: Rest of Asia Pacific Protective Eye Wear Market Volume (K Units) Forecast, by Application 2020 & 2033
- Table 57: Global Protective Eye Wear Market Revenue billion Forecast, by Product Type 2020 & 2033
- Table 58: Global Protective Eye Wear Market Volume K Units Forecast, by Product Type 2020 & 2033
- Table 59: Global Protective Eye Wear Market Revenue billion Forecast, by End-User Industry 2020 & 2033
- Table 60: Global Protective Eye Wear Market Volume K Units Forecast, by End-User Industry 2020 & 2033
- Table 61: Global Protective Eye Wear Market Revenue billion Forecast, by Country 2020 & 2033
- Table 62: Global Protective Eye Wear Market Volume K Units Forecast, by Country 2020 & 2033
- Table 63: Brazil Protective Eye Wear Market Revenue (billion) Forecast, by Application 2020 & 2033
- Table 64: Brazil Protective Eye Wear Market Volume (K Units) Forecast, by Application 2020 & 2033
- Table 65: Argentina Protective Eye Wear Market Revenue (billion) Forecast, by Application 2020 & 2033
- Table 66: Argentina Protective Eye Wear Market Volume (K Units) Forecast, by Application 2020 & 2033
- Table 67: Rest of South America Protective Eye Wear Market Revenue (billion) Forecast, by Application 2020 & 2033
- Table 68: Rest of South America Protective Eye Wear Market Volume (K Units) Forecast, by Application 2020 & 2033
- Table 69: Global Protective Eye Wear Market Revenue billion Forecast, by Product Type 2020 & 2033
- Table 70: Global Protective Eye Wear Market Volume K Units Forecast, by Product Type 2020 & 2033
- Table 71: Global Protective Eye Wear Market Revenue billion Forecast, by End-User Industry 2020 & 2033
- Table 72: Global Protective Eye Wear Market Volume K Units Forecast, by End-User Industry 2020 & 2033
- Table 73: Global Protective Eye Wear Market Revenue billion Forecast, by Country 2020 & 2033
- Table 74: Global Protective Eye Wear Market Volume K Units Forecast, by Country 2020 & 2033
- Table 75: South Africa Protective Eye Wear Market Revenue (billion) Forecast, by Application 2020 & 2033
- Table 76: South Africa Protective Eye Wear Market Volume (K Units) Forecast, by Application 2020 & 2033
- Table 77: United Arab Emirates Protective Eye Wear Market Revenue (billion) Forecast, by Application 2020 & 2033
- Table 78: United Arab Emirates Protective Eye Wear Market Volume (K Units) Forecast, by Application 2020 & 2033
- Table 79: Rest of Middle East and Africa Protective Eye Wear Market Revenue (billion) Forecast, by Application 2020 & 2033
- Table 80: Rest of Middle East and Africa Protective Eye Wear Market Volume (K Units) Forecast, by Application 2020 & 2033
Frequently Asked Questions
1. What is the projected Compound Annual Growth Rate (CAGR) of the Protective Eye Wear Market?
The projected CAGR is approximately 4.54%.
2. Which companies are prominent players in the Protective Eye Wear Market?
Key companies in the market include Bolle Safety, Honeywell International Inc, Pyramex Safety Products LLC, Radians Inc, MCR Safety, uvex group, 3M Company, Phillips Safety Products In, Gateway Safety Inc, SSP Eyewear.
3. What are the main segments of the Protective Eye Wear Market?
The market segments include Product Type, End-User Industry.
4. Can you provide details about the market size?
The market size is estimated to be USD 4.38 billion as of 2022.
5. What are some drivers contributing to market growth?
Shift in Shopping Mode Preferences of the people; Increasing Urbanization; Growing Disposable Income.
6. What are the notable trends driving market growth?
Increasing Prevalence of Eye Injuries at Workplace.
7. Are there any restraints impacting market growth?
High-priced products and additional delivery charges; Inconsistency in product quality.
8. Can you provide examples of recent developments in the market?
October 2021: Uvex Group launched the Uvex i-range, an innovative safety eyewear for multiple applications. The products comprise 3 different varieties uvex i-lite, uvex i-guard, and uvex i-guard plus. The products are coated with UV 400 protection.
9. What pricing options are available for accessing the report?
Pricing options include single-user, multi-user, and enterprise licenses priced at USD 4750, USD 5250, and USD 8750 respectively.
10. Is the market size provided in terms of value or volume?
The market size is provided in terms of value, measured in billion and volume, measured in K Units.
11. Are there any specific market keywords associated with the report?
Yes, the market keyword associated with the report is "Protective Eye Wear Market," which aids in identifying and referencing the specific market segment covered.
12. How do I determine which pricing option suits my needs best?
The pricing options vary based on user requirements and access needs. Individual users may opt for single-user licenses, while businesses requiring broader access may choose multi-user or enterprise licenses for cost-effective access to the report.
13. Are there any additional resources or data provided in the Protective Eye Wear Market report?
While the report offers comprehensive insights, it's advisable to review the specific contents or supplementary materials provided to ascertain if additional resources or data are available.
14. How can I stay updated on further developments or reports in the Protective Eye Wear Market?
To stay informed about further developments, trends, and reports in the Protective Eye Wear Market, consider subscribing to industry newsletters, following relevant companies and organizations, or regularly checking reputable industry news sources and publications.
Methodology
Step 1 - Identification of Relevant Samples Size from Population Database


Step 2 - Approaches for Defining Global Market Size (Value, Volume* & Price*)

Note*: In applicable scenarios
Step 3 - Data Sources
Primary Research
- Web Analytics
- Survey Reports
- Research Institute
- Latest Research Reports
- Opinion Leaders
Secondary Research
- Annual Reports
- White Paper
- Latest Press Release
- Industry Association
- Paid Database
- Investor Presentations

Step 4 - Data Triangulation
Involves using different sources of information in order to increase the validity of a study
These sources are likely to be stakeholders in a program - participants, other researchers, program staff, other community members, and so on.
Then we put all data in single framework & apply various statistical tools to find out the dynamic on the market.
During the analysis stage, feedback from the stakeholder groups would be compared to determine areas of agreement as well as areas of divergence