

Key Insights
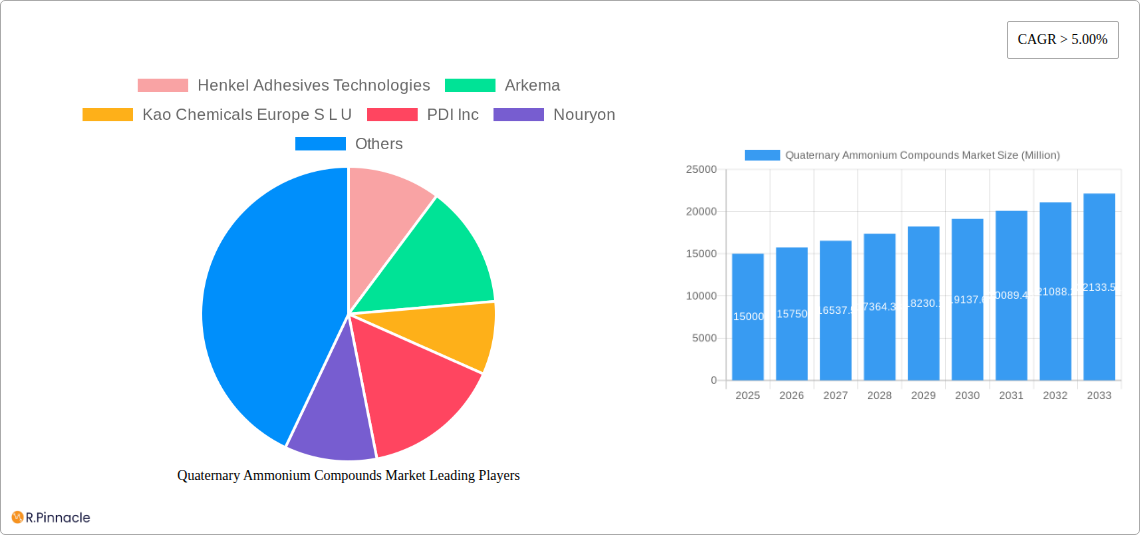
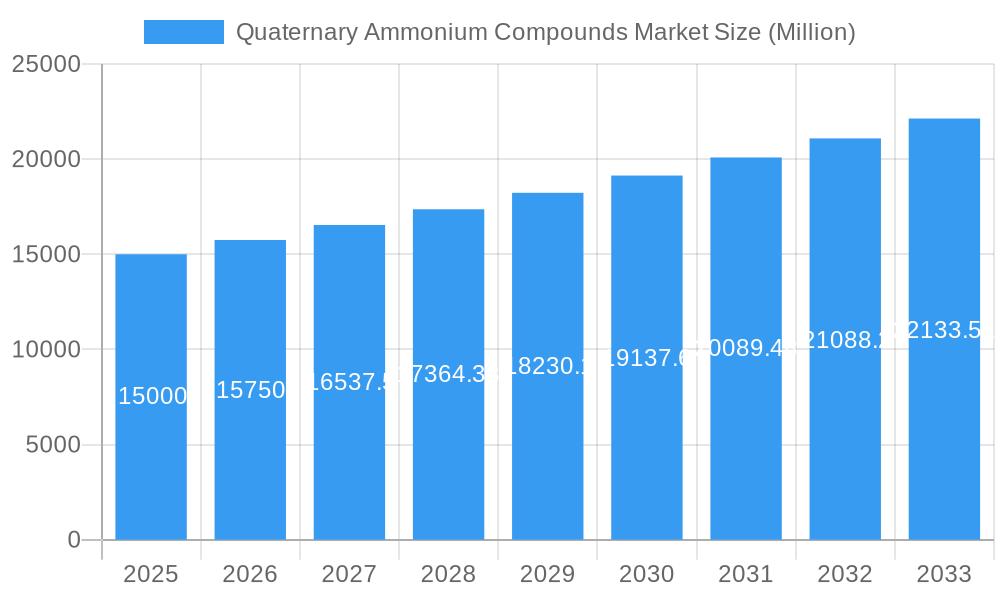
The Quaternary Ammonium Compounds (QACs) market is experiencing robust growth, driven by increasing demand across diverse applications. The market's Compound Annual Growth Rate (CAGR) exceeding 5% signifies a consistently expanding market size, projected to reach significant value within the forecast period (2025-2033). Key application segments, including disinfectants (fueled by heightened hygiene concerns globally), fabric softeners (leveraging QACs' softening and antistatic properties), and wood preservatives (for their antimicrobial and antifungal capabilities), are major contributors to this growth. The industrial grade segment currently holds a larger market share compared to the pharmaceutical grade, reflecting the widespread use of QACs in various industrial processes. However, the pharmaceutical grade segment is expected to witness notable growth due to increasing applications in pharmaceutical formulations and medical devices. Geographic distribution shows strong market presence in North America and Europe, owing to established industries and stringent regulatory frameworks. However, the Asia-Pacific region, particularly China and India, is poised for substantial expansion driven by rising industrialization, urbanization, and increasing awareness of hygiene practices. While the market faces certain restraints such as environmental concerns regarding the persistence of some QACs and the development of resistant microorganisms, ongoing research into eco-friendly alternatives and innovative formulations is mitigating these challenges and ensuring continued market growth. Major players like Henkel, BASF, and DuPont are driving innovation and expansion through strategic partnerships, acquisitions, and the introduction of advanced QAC formulations catering to specific application needs.
Quaternary Ammonium Compounds Market Market Size (In Billion)
The market's growth trajectory is further supported by technological advancements focusing on the development of more efficient and environmentally sustainable QACs. This includes research into biodegradable QACs and formulations with reduced toxicity. Government regulations promoting hygiene and sanitation in various sectors also contribute positively to the market growth. However, fluctuations in raw material prices and potential regulatory changes remain factors that could impact the market dynamics in the long term. The competitive landscape is characterized by the presence of both large multinational corporations and smaller specialized companies, resulting in continuous innovation and a diverse range of QAC products available in the market. The forecast period suggests a promising outlook for the QACs market, with consistent growth propelled by factors such as increasing demand across diverse applications, technological innovations, and supportive regulatory environments.
Quaternary Ammonium Compounds Market Company Market Share
This in-depth report provides a comprehensive analysis of the Quaternary Ammonium Compounds market, offering valuable insights for industry professionals, investors, and strategic decision-makers. Covering the period from 2019 to 2033, with a focus on the 2025-2033 forecast, this report dissects market dynamics, growth drivers, challenges, and emerging opportunities. Expect detailed segmentation by application (Disinfectants, Fabric Softeners, Wood Preservatives, Surfactants, Antistatic Agents, Other Applications) and type (Industrial Grade, Pharmaceutical Grade), alongside competitive landscape analysis featuring key players like Henkel Adhesives Technologies, Arkema, and BASF SE. The report also incorporates significant industry developments, offering actionable intelligence for informed strategic planning.
Quaternary Ammonium Compounds Market Structure & Innovation Trends
This section analyzes the market's competitive landscape, exploring market concentration, innovation drivers, regulatory frameworks, and prevalent M&A activities. The report assesses the market share held by key players and analyzes the value of significant M&A deals within the industry. The xx% market share held by the top 5 players indicates a moderately consolidated market. Innovation is driven by the need for more effective and environmentally friendly formulations, particularly within the disinfectants segment. Stringent regulatory frameworks, particularly concerning environmental impact and human health, shape product development and market access. The presence of alternative biocides creates competitive pressure, while evolving end-user demographics influence demand across various applications. Recent M&A activities, valued at approximately $xx Million in the last five years, suggest a trend towards consolidation and expansion of market share among larger players.
- Market Concentration: Moderately consolidated, with top 5 players holding xx% market share.
- Innovation Drivers: Demand for environmentally friendly and highly effective formulations.
- Regulatory Framework: Stringent regulations impacting product development and market access.
- Product Substitutes: Presence of alternative biocides creates competitive pressure.
- End-User Demographics: Shifting demographics influencing application-specific demand.
- M&A Activities: Recent M&A activity valued at approximately $xx Million over the last five years.
Quaternary Ammonium Compounds Market Dynamics & Trends
The Quaternary Ammonium Compounds market is experiencing significant growth, driven by factors such as increasing demand for disinfectants in healthcare and hygiene applications, along with the expanding use of these compounds in industrial processes. Technological advancements, like the development of novel formulations with enhanced efficacy and reduced environmental impact, are contributing to this growth. Consumer preferences for sustainable and eco-friendly products are also influencing market trends. The market's competitive landscape is characterized by both intense rivalry among established players and the emergence of new entrants offering innovative products and solutions. The market is expected to exhibit a CAGR of xx% during the forecast period (2025-2033), with a market penetration rate of xx% by 2033. Technological disruptions, such as the development of nano-formulations and targeted delivery systems, offer significant opportunities for future market expansion.
Dominant Regions & Segments in Quaternary Ammonium Compounds Market
The North American region currently dominates the Quaternary Ammonium Compounds market, driven by strong demand from the healthcare and industrial sectors. This dominance is attributed to factors such as robust economic growth, well-established infrastructure, and stringent regulatory frameworks that prioritize hygiene and sanitation. Within applications, disinfectants represent the largest segment, followed by fabric softeners. The Industrial Grade segment holds the largest market share due to high volume consumption in various industrial applications.
Key Drivers for North American Dominance:
- Robust economic growth fueling demand across various sectors.
- Well-developed infrastructure supporting efficient distribution networks.
- Stringent regulatory frameworks promoting hygiene and sanitation standards.
Dominant Segments:
- Application: Disinfectants (Largest segment due to increasing healthcare and hygiene concerns).
- Type: Industrial Grade (Largest market share driven by high-volume industrial applications).
Quaternary Ammonium Compounds Market Product Innovations
The Quaternary Ammonium Compounds (QACs) market is witnessing a surge in product innovations, driven by a confluence of demands for enhanced efficacy, improved environmental sustainability, and specialized application suitability. Manufacturers are actively pursuing the development of advanced formulations that not only exhibit broader antimicrobial spectrums, effectively targeting a wider range of microorganisms, including increasingly resilient strains, but also boast significantly minimized environmental footprints. This includes a focus on biodegradability and reduced toxicity. The proliferation of user-friendly, ready-to-use formats, such as pre-impregnated wipes and convenient spray applicators, is a key trend, greatly enhancing usability and accessibility. This surge in convenience is a significant catalyst for increased demand across diverse sectors, most notably in the consumer goods and healthcare industries, where rapid and effective disinfection is paramount. These strategic developments underscore the market's agile response to evolving consumer preferences for safer, more effective, and environmentally conscious disinfection solutions, as well as its proactive adaptation to increasingly stringent regulatory landscapes.
Report Scope & Segmentation Analysis
This report segments the Quaternary Ammonium Compounds market by application (Disinfectants, Fabric Softeners, Wood Preservatives, Surfactants, Antistatic Agents, Other Applications) and type (Industrial Grade, Pharmaceutical Grade). Each segment is analyzed based on growth projections, market size, and competitive dynamics. The Disinfectants segment is projected to witness significant growth due to the rising prevalence of infectious diseases. The Industrial Grade segment dominates the market, reflecting high demand across multiple industrial applications. Growth projections for each segment are detailed in the full report. Competitive dynamics vary across segments, with some featuring intense rivalry and others experiencing more fragmented competition.
Key Drivers of Quaternary Ammonium Compounds Market Growth
The market's growth is propelled by several factors, including the increasing prevalence of infectious diseases driving demand for effective disinfectants. Stringent hygiene regulations in healthcare and food processing facilities further fuel market expansion. The rising demand for durable and easy-to-use products in diverse applications like textiles and wood preservation also contributes significantly to market growth. The continued development of innovative formulations offering enhanced efficacy and reduced environmental impact is creating further opportunities.
Challenges in the Quaternary Ammonium Compounds Market Sector
The Quaternary Ammonium Compounds market sector grapples with a multi-faceted array of challenges that significantly influence its trajectory. Foremost among these are the increasingly stringent regulatory requirements and growing environmental concerns associated with the use and disposal of certain QACs. Issues surrounding potential ecotoxicity and the development of microbial resistance to common QACs necessitate careful formulation and application guidelines. Furthermore, the inherent volatility of raw material prices and the persistent threat of global supply chain disruptions introduce considerable economic uncertainty and impact production costs. Intense competition from a diverse range of alternative biocidal agents, coupled with the imperative for continuous research and development to meet evolving consumer and industrial demands for greener and more effective solutions, presents ongoing hurdles. The cumulative impact of these challenges is anticipated to temper market growth. Preliminary estimations suggest these combined challenges could restrain market growth by approximately [Insert Specific Percentage Here]% over the next five years, necessitating strategic adaptation and innovation to mitigate these effects.
Emerging Opportunities in Quaternary Ammonium Compounds Market
The Quaternary Ammonium Compounds market is ripe with emerging opportunities, particularly in the realm of specialized formulations designed to address pressing global health and environmental concerns. A significant avenue lies in the development of advanced QAC-based solutions specifically engineered to combat the escalating threat of antimicrobial resistance (AMR), offering novel approaches to disinfection and infection control. The burgeoning global demand for sustainable and biodegradable alternatives is a powerful driver, opening up vast new avenues for research and innovation in developing QACs with improved environmental profiles and reduced persistence. Expansion into untapped geographical markets, especially in rapidly developing economies where awareness and investment in hygiene, sanitation, and public health are on a sharp upward trend, presents substantial growth potential. Moreover, the exploration and integration of novel delivery systems, such as microencapsulation and controlled-release technologies, alongside the incorporation of nanotechnology to enhance efficacy and reduce the required concentration of QACs, are poised to revolutionize existing applications and unlock entirely new market segments, thereby fueling future market expansion.
Leading Players in the Quaternary Ammonium Compounds Market Market
- Henkel Adhesives Technologies
- Arkema
- Kao Chemicals Europe S L U
- PDI Inc
- Nouryon
- KLK OLEO
- BASF SE
- S C Johnson & Son Inc
- Huntsman International LLC
- DuPont
- Evonik
Key Developments in Quaternary Ammonium Compounds Market Industry
- February 2022: SC Johnson Professional launched its Quaternary Disinfectant Cleaner in a new easy-to-measure bottle in North America.
- March 2022: PDI launched new germicidal wipes and spray, addressing healthcare-associated infections (HAIs).
Future Outlook for Quaternary Ammonium Compounds Market Market
The Quaternary Ammonium Compounds market is poised for continued growth, driven by the increasing demand for hygiene and sanitation solutions across various sectors. Technological advancements, regulatory pressures, and evolving consumer preferences will continue to shape market dynamics. Strategic investments in research and development, focusing on sustainable and effective formulations, will be crucial for success in this dynamic and competitive market. The long-term outlook remains positive, with significant opportunities for expansion and innovation.
Quaternary Ammonium Compounds Market Segmentation
-
1. Type
- 1.1. Industrial Grade
- 1.2. Pharmaceutical Grade
-
2. Application
- 2.1. Disinfectants
- 2.2. Fabric Softeners
- 2.3. Wood Preservatives
- 2.4. Surfactants
- 2.5. Antistatic Agents
- 2.6. Other Applications
Quaternary Ammonium Compounds Market Segmentation By Geography
-
1. Asia Pacific
- 1.1. China
- 1.2. India
- 1.3. Japan
- 1.4. South Korea
- 1.5. Rest of Asia Pacific
-
2. North America
- 2.1. United States
- 2.2. Canada
- 2.3. Mexico
-
3. Europe
- 3.1. Germany
- 3.2. United Kingdom
- 3.3. Italy
- 3.4. France
- 3.5. Rest of Europe
-
4. South America
- 4.1. Brazil
- 4.2. Argentina
- 4.3. Rest of South America
-
5. Middle East and Africa
- 5.1. Saudi Arabia
- 5.2. South Africa
- 5.3. Rest of Middle East and Africa
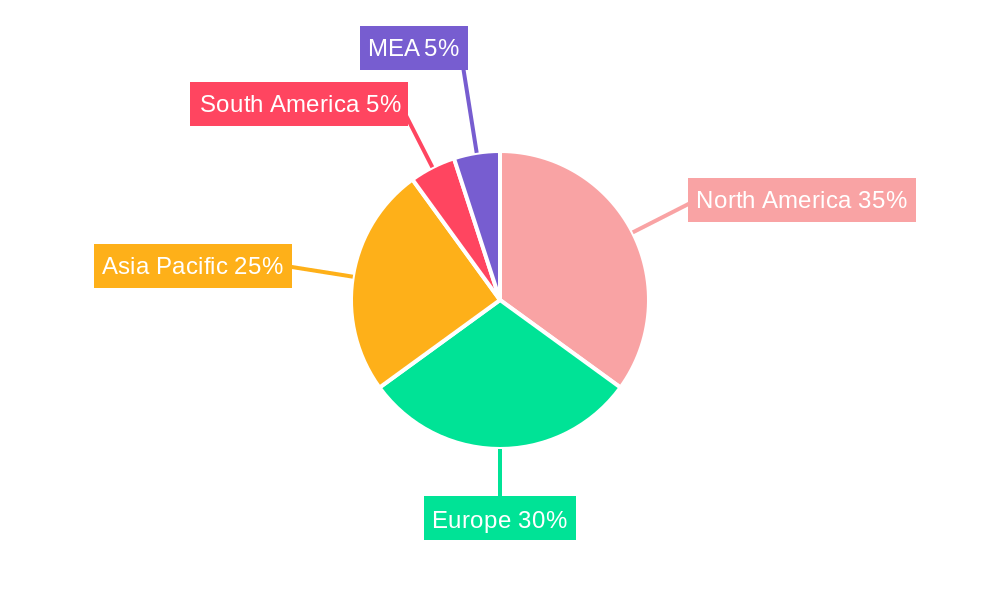
Quaternary Ammonium Compounds Market Regional Market Share
Geographic Coverage of Quaternary Ammonium Compounds Market
Quaternary Ammonium Compounds Market REPORT HIGHLIGHTS
| Aspects | Details |
|---|---|
| Study Period | 2020-2034 |
| Base Year | 2025 |
| Estimated Year | 2026 |
| Forecast Period | 2026-2034 |
| Historical Period | 2020-2025 |
| Growth Rate | CAGR of 4.35% from 2020-2034 |
| Segmentation |
|
Table of Contents
- 1. Introduction
- 1.1. Research Scope
- 1.2. Market Segmentation
- 1.3. Research Objective
- 1.4. Definitions and Assumptions
- 2. Executive Summary
- 2.1. Market Snapshot
- 3. Market Dynamics
- 3.1. Market Drivers
- 3.2. Market Restrains
- 3.3. Market Trends
- 3.4. Market Opportunities
- 4. Market Factor Analysis
- 4.1. Porters Five Forces
- 4.1.1. Bargaining Power of Suppliers
- 4.1.2. Bargaining Power of Buyers
- 4.1.3. Threat of New Entrants
- 4.1.4. Threat of Substitutes
- 4.1.5. Competitive Rivalry
- 4.2. PESTEL analysis
- 4.3. BCG Analysis
- 4.3.1. Stars (High Growth, High Market Share)
- 4.3.2. Cash Cows (Low Growth, High Market Share)
- 4.3.3. Question Mark (High Growth, Low Market Share)
- 4.3.4. Dogs (Low Growth, Low Market Share)
- 4.4. Ansoff Matrix Analysis
- 4.5. Supply Chain Analysis
- 4.6. Regulatory Landscape
- 4.7. Current Market Potential and Opportunity Assessment (TAM–SAM–SOM Framework)
- 4.8. PRI Analyst Note
- 4.1. Porters Five Forces
- 5. Market Analysis, Insights and Forecast 2021-2033
- 5.1. Market Analysis, Insights and Forecast - by Type
- 5.1.1. Industrial Grade
- 5.1.2. Pharmaceutical Grade
- 5.2. Market Analysis, Insights and Forecast - by Application
- 5.2.1. Disinfectants
- 5.2.2. Fabric Softeners
- 5.2.3. Wood Preservatives
- 5.2.4. Surfactants
- 5.2.5. Antistatic Agents
- 5.2.6. Other Applications
- 5.3. Market Analysis, Insights and Forecast - by Region
- 5.3.1. Asia Pacific
- 5.3.2. North America
- 5.3.3. Europe
- 5.3.4. South America
- 5.3.5. Middle East and Africa
- 5.1. Market Analysis, Insights and Forecast - by Type
- 6. Global Quaternary Ammonium Compounds Market Analysis, Insights and Forecast, 2021-2033
- 6.1. Market Analysis, Insights and Forecast - by Type
- 6.1.1. Industrial Grade
- 6.1.2. Pharmaceutical Grade
- 6.2. Market Analysis, Insights and Forecast - by Application
- 6.2.1. Disinfectants
- 6.2.2. Fabric Softeners
- 6.2.3. Wood Preservatives
- 6.2.4. Surfactants
- 6.2.5. Antistatic Agents
- 6.2.6. Other Applications
- 6.1. Market Analysis, Insights and Forecast - by Type
- 7. Asia Pacific Quaternary Ammonium Compounds Market Analysis, Insights and Forecast, 2020-2032
- 7.1. Market Analysis, Insights and Forecast - by Type
- 7.1.1. Industrial Grade
- 7.1.2. Pharmaceutical Grade
- 7.2. Market Analysis, Insights and Forecast - by Application
- 7.2.1. Disinfectants
- 7.2.2. Fabric Softeners
- 7.2.3. Wood Preservatives
- 7.2.4. Surfactants
- 7.2.5. Antistatic Agents
- 7.2.6. Other Applications
- 7.1. Market Analysis, Insights and Forecast - by Type
- 8. North America Quaternary Ammonium Compounds Market Analysis, Insights and Forecast, 2020-2032
- 8.1. Market Analysis, Insights and Forecast - by Type
- 8.1.1. Industrial Grade
- 8.1.2. Pharmaceutical Grade
- 8.2. Market Analysis, Insights and Forecast - by Application
- 8.2.1. Disinfectants
- 8.2.2. Fabric Softeners
- 8.2.3. Wood Preservatives
- 8.2.4. Surfactants
- 8.2.5. Antistatic Agents
- 8.2.6. Other Applications
- 8.1. Market Analysis, Insights and Forecast - by Type
- 9. Europe Quaternary Ammonium Compounds Market Analysis, Insights and Forecast, 2020-2032
- 9.1. Market Analysis, Insights and Forecast - by Type
- 9.1.1. Industrial Grade
- 9.1.2. Pharmaceutical Grade
- 9.2. Market Analysis, Insights and Forecast - by Application
- 9.2.1. Disinfectants
- 9.2.2. Fabric Softeners
- 9.2.3. Wood Preservatives
- 9.2.4. Surfactants
- 9.2.5. Antistatic Agents
- 9.2.6. Other Applications
- 9.1. Market Analysis, Insights and Forecast - by Type
- 10. South America Quaternary Ammonium Compounds Market Analysis, Insights and Forecast, 2020-2032
- 10.1. Market Analysis, Insights and Forecast - by Type
- 10.1.1. Industrial Grade
- 10.1.2. Pharmaceutical Grade
- 10.2. Market Analysis, Insights and Forecast - by Application
- 10.2.1. Disinfectants
- 10.2.2. Fabric Softeners
- 10.2.3. Wood Preservatives
- 10.2.4. Surfactants
- 10.2.5. Antistatic Agents
- 10.2.6. Other Applications
- 10.1. Market Analysis, Insights and Forecast - by Type
- 11. Middle East and Africa Quaternary Ammonium Compounds Market Analysis, Insights and Forecast, 2020-2032
- 11.1. Market Analysis, Insights and Forecast - by Type
- 11.1.1. Industrial Grade
- 11.1.2. Pharmaceutical Grade
- 11.2. Market Analysis, Insights and Forecast - by Application
- 11.2.1. Disinfectants
- 11.2.2. Fabric Softeners
- 11.2.3. Wood Preservatives
- 11.2.4. Surfactants
- 11.2.5. Antistatic Agents
- 11.2.6. Other Applications
- 11.1. Market Analysis, Insights and Forecast - by Type
- 12. Competitive Analysis
- 12.1. Company Profiles
- 12.1.1 Henkel Adhesives Technologies
- 12.1.1.1. Company Overview
- 12.1.1.2. Products
- 12.1.1.3. Company Financials
- 12.1.1.4. SWOT Analysis
- 12.1.2 Arkema
- 12.1.2.1. Company Overview
- 12.1.2.2. Products
- 12.1.2.3. Company Financials
- 12.1.2.4. SWOT Analysis
- 12.1.3 Kao Chemicals Europe S L U
- 12.1.3.1. Company Overview
- 12.1.3.2. Products
- 12.1.3.3. Company Financials
- 12.1.3.4. SWOT Analysis
- 12.1.4 PDI Inc
- 12.1.4.1. Company Overview
- 12.1.4.2. Products
- 12.1.4.3. Company Financials
- 12.1.4.4. SWOT Analysis
- 12.1.5 Nouryon
- 12.1.5.1. Company Overview
- 12.1.5.2. Products
- 12.1.5.3. Company Financials
- 12.1.5.4. SWOT Analysis
- 12.1.6 KLK OLEO
- 12.1.6.1. Company Overview
- 12.1.6.2. Products
- 12.1.6.3. Company Financials
- 12.1.6.4. SWOT Analysis
- 12.1.7 BASF SE
- 12.1.7.1. Company Overview
- 12.1.7.2. Products
- 12.1.7.3. Company Financials
- 12.1.7.4. SWOT Analysis
- 12.1.8 S C Johnson & Son Inc
- 12.1.8.1. Company Overview
- 12.1.8.2. Products
- 12.1.8.3. Company Financials
- 12.1.8.4. SWOT Analysis
- 12.1.9 Huntsman International LLC
- 12.1.9.1. Company Overview
- 12.1.9.2. Products
- 12.1.9.3. Company Financials
- 12.1.9.4. SWOT Analysis
- 12.1.10 DuPont
- 12.1.10.1. Company Overview
- 12.1.10.2. Products
- 12.1.10.3. Company Financials
- 12.1.10.4. SWOT Analysis
- 12.1.11 Evonik
- 12.1.11.1. Company Overview
- 12.1.11.2. Products
- 12.1.11.3. Company Financials
- 12.1.11.4. SWOT Analysis
- 12.1.1 Henkel Adhesives Technologies
- 12.2. Market Entropy
- 12.2.1 Company's Key Areas Served
- 12.2.2 Recent Developments
- 12.3. Company Market Share Analysis 2025
- 12.3.1 Top 5 Companies Market Share Analysis
- 12.3.2 Top 3 Companies Market Share Analysis
- 12.4. List of Potential Customers
- 13. Research Methodology
List of Figures
- Figure 1: Global Quaternary Ammonium Compounds Market Revenue Breakdown (billion, %) by Region 2025 & 2033
- Figure 2: Global Quaternary Ammonium Compounds Market Volume Breakdown (K Tons, %) by Region 2025 & 2033
- Figure 3: Asia Pacific Quaternary Ammonium Compounds Market Revenue (billion), by Type 2025 & 2033
- Figure 4: Asia Pacific Quaternary Ammonium Compounds Market Volume (K Tons), by Type 2025 & 2033
- Figure 5: Asia Pacific Quaternary Ammonium Compounds Market Revenue Share (%), by Type 2025 & 2033
- Figure 6: Asia Pacific Quaternary Ammonium Compounds Market Volume Share (%), by Type 2025 & 2033
- Figure 7: Asia Pacific Quaternary Ammonium Compounds Market Revenue (billion), by Application 2025 & 2033
- Figure 8: Asia Pacific Quaternary Ammonium Compounds Market Volume (K Tons), by Application 2025 & 2033
- Figure 9: Asia Pacific Quaternary Ammonium Compounds Market Revenue Share (%), by Application 2025 & 2033
- Figure 10: Asia Pacific Quaternary Ammonium Compounds Market Volume Share (%), by Application 2025 & 2033
- Figure 11: Asia Pacific Quaternary Ammonium Compounds Market Revenue (billion), by Country 2025 & 2033
- Figure 12: Asia Pacific Quaternary Ammonium Compounds Market Volume (K Tons), by Country 2025 & 2033
- Figure 13: Asia Pacific Quaternary Ammonium Compounds Market Revenue Share (%), by Country 2025 & 2033
- Figure 14: Asia Pacific Quaternary Ammonium Compounds Market Volume Share (%), by Country 2025 & 2033
- Figure 15: North America Quaternary Ammonium Compounds Market Revenue (billion), by Type 2025 & 2033
- Figure 16: North America Quaternary Ammonium Compounds Market Volume (K Tons), by Type 2025 & 2033
- Figure 17: North America Quaternary Ammonium Compounds Market Revenue Share (%), by Type 2025 & 2033
- Figure 18: North America Quaternary Ammonium Compounds Market Volume Share (%), by Type 2025 & 2033
- Figure 19: North America Quaternary Ammonium Compounds Market Revenue (billion), by Application 2025 & 2033
- Figure 20: North America Quaternary Ammonium Compounds Market Volume (K Tons), by Application 2025 & 2033
- Figure 21: North America Quaternary Ammonium Compounds Market Revenue Share (%), by Application 2025 & 2033
- Figure 22: North America Quaternary Ammonium Compounds Market Volume Share (%), by Application 2025 & 2033
- Figure 23: North America Quaternary Ammonium Compounds Market Revenue (billion), by Country 2025 & 2033
- Figure 24: North America Quaternary Ammonium Compounds Market Volume (K Tons), by Country 2025 & 2033
- Figure 25: North America Quaternary Ammonium Compounds Market Revenue Share (%), by Country 2025 & 2033
- Figure 26: North America Quaternary Ammonium Compounds Market Volume Share (%), by Country 2025 & 2033
- Figure 27: Europe Quaternary Ammonium Compounds Market Revenue (billion), by Type 2025 & 2033
- Figure 28: Europe Quaternary Ammonium Compounds Market Volume (K Tons), by Type 2025 & 2033
- Figure 29: Europe Quaternary Ammonium Compounds Market Revenue Share (%), by Type 2025 & 2033
- Figure 30: Europe Quaternary Ammonium Compounds Market Volume Share (%), by Type 2025 & 2033
- Figure 31: Europe Quaternary Ammonium Compounds Market Revenue (billion), by Application 2025 & 2033
- Figure 32: Europe Quaternary Ammonium Compounds Market Volume (K Tons), by Application 2025 & 2033
- Figure 33: Europe Quaternary Ammonium Compounds Market Revenue Share (%), by Application 2025 & 2033
- Figure 34: Europe Quaternary Ammonium Compounds Market Volume Share (%), by Application 2025 & 2033
- Figure 35: Europe Quaternary Ammonium Compounds Market Revenue (billion), by Country 2025 & 2033
- Figure 36: Europe Quaternary Ammonium Compounds Market Volume (K Tons), by Country 2025 & 2033
- Figure 37: Europe Quaternary Ammonium Compounds Market Revenue Share (%), by Country 2025 & 2033
- Figure 38: Europe Quaternary Ammonium Compounds Market Volume Share (%), by Country 2025 & 2033
- Figure 39: South America Quaternary Ammonium Compounds Market Revenue (billion), by Type 2025 & 2033
- Figure 40: South America Quaternary Ammonium Compounds Market Volume (K Tons), by Type 2025 & 2033
- Figure 41: South America Quaternary Ammonium Compounds Market Revenue Share (%), by Type 2025 & 2033
- Figure 42: South America Quaternary Ammonium Compounds Market Volume Share (%), by Type 2025 & 2033
- Figure 43: South America Quaternary Ammonium Compounds Market Revenue (billion), by Application 2025 & 2033
- Figure 44: South America Quaternary Ammonium Compounds Market Volume (K Tons), by Application 2025 & 2033
- Figure 45: South America Quaternary Ammonium Compounds Market Revenue Share (%), by Application 2025 & 2033
- Figure 46: South America Quaternary Ammonium Compounds Market Volume Share (%), by Application 2025 & 2033
- Figure 47: South America Quaternary Ammonium Compounds Market Revenue (billion), by Country 2025 & 2033
- Figure 48: South America Quaternary Ammonium Compounds Market Volume (K Tons), by Country 2025 & 2033
- Figure 49: South America Quaternary Ammonium Compounds Market Revenue Share (%), by Country 2025 & 2033
- Figure 50: South America Quaternary Ammonium Compounds Market Volume Share (%), by Country 2025 & 2033
- Figure 51: Middle East and Africa Quaternary Ammonium Compounds Market Revenue (billion), by Type 2025 & 2033
- Figure 52: Middle East and Africa Quaternary Ammonium Compounds Market Volume (K Tons), by Type 2025 & 2033
- Figure 53: Middle East and Africa Quaternary Ammonium Compounds Market Revenue Share (%), by Type 2025 & 2033
- Figure 54: Middle East and Africa Quaternary Ammonium Compounds Market Volume Share (%), by Type 2025 & 2033
- Figure 55: Middle East and Africa Quaternary Ammonium Compounds Market Revenue (billion), by Application 2025 & 2033
- Figure 56: Middle East and Africa Quaternary Ammonium Compounds Market Volume (K Tons), by Application 2025 & 2033
- Figure 57: Middle East and Africa Quaternary Ammonium Compounds Market Revenue Share (%), by Application 2025 & 2033
- Figure 58: Middle East and Africa Quaternary Ammonium Compounds Market Volume Share (%), by Application 2025 & 2033
- Figure 59: Middle East and Africa Quaternary Ammonium Compounds Market Revenue (billion), by Country 2025 & 2033
- Figure 60: Middle East and Africa Quaternary Ammonium Compounds Market Volume (K Tons), by Country 2025 & 2033
- Figure 61: Middle East and Africa Quaternary Ammonium Compounds Market Revenue Share (%), by Country 2025 & 2033
- Figure 62: Middle East and Africa Quaternary Ammonium Compounds Market Volume Share (%), by Country 2025 & 2033
List of Tables
- Table 1: Global Quaternary Ammonium Compounds Market Revenue billion Forecast, by Type 2020 & 2033
- Table 2: Global Quaternary Ammonium Compounds Market Volume K Tons Forecast, by Type 2020 & 2033
- Table 3: Global Quaternary Ammonium Compounds Market Revenue billion Forecast, by Application 2020 & 2033
- Table 4: Global Quaternary Ammonium Compounds Market Volume K Tons Forecast, by Application 2020 & 2033
- Table 5: Global Quaternary Ammonium Compounds Market Revenue billion Forecast, by Region 2020 & 2033
- Table 6: Global Quaternary Ammonium Compounds Market Volume K Tons Forecast, by Region 2020 & 2033
- Table 7: Global Quaternary Ammonium Compounds Market Revenue billion Forecast, by Type 2020 & 2033
- Table 8: Global Quaternary Ammonium Compounds Market Volume K Tons Forecast, by Type 2020 & 2033
- Table 9: Global Quaternary Ammonium Compounds Market Revenue billion Forecast, by Application 2020 & 2033
- Table 10: Global Quaternary Ammonium Compounds Market Volume K Tons Forecast, by Application 2020 & 2033
- Table 11: Global Quaternary Ammonium Compounds Market Revenue billion Forecast, by Country 2020 & 2033
- Table 12: Global Quaternary Ammonium Compounds Market Volume K Tons Forecast, by Country 2020 & 2033
- Table 13: China Quaternary Ammonium Compounds Market Revenue (billion) Forecast, by Application 2020 & 2033
- Table 14: China Quaternary Ammonium Compounds Market Volume (K Tons) Forecast, by Application 2020 & 2033
- Table 15: India Quaternary Ammonium Compounds Market Revenue (billion) Forecast, by Application 2020 & 2033
- Table 16: India Quaternary Ammonium Compounds Market Volume (K Tons) Forecast, by Application 2020 & 2033
- Table 17: Japan Quaternary Ammonium Compounds Market Revenue (billion) Forecast, by Application 2020 & 2033
- Table 18: Japan Quaternary Ammonium Compounds Market Volume (K Tons) Forecast, by Application 2020 & 2033
- Table 19: South Korea Quaternary Ammonium Compounds Market Revenue (billion) Forecast, by Application 2020 & 2033
- Table 20: South Korea Quaternary Ammonium Compounds Market Volume (K Tons) Forecast, by Application 2020 & 2033
- Table 21: Rest of Asia Pacific Quaternary Ammonium Compounds Market Revenue (billion) Forecast, by Application 2020 & 2033
- Table 22: Rest of Asia Pacific Quaternary Ammonium Compounds Market Volume (K Tons) Forecast, by Application 2020 & 2033
- Table 23: Global Quaternary Ammonium Compounds Market Revenue billion Forecast, by Type 2020 & 2033
- Table 24: Global Quaternary Ammonium Compounds Market Volume K Tons Forecast, by Type 2020 & 2033
- Table 25: Global Quaternary Ammonium Compounds Market Revenue billion Forecast, by Application 2020 & 2033
- Table 26: Global Quaternary Ammonium Compounds Market Volume K Tons Forecast, by Application 2020 & 2033
- Table 27: Global Quaternary Ammonium Compounds Market Revenue billion Forecast, by Country 2020 & 2033
- Table 28: Global Quaternary Ammonium Compounds Market Volume K Tons Forecast, by Country 2020 & 2033
- Table 29: United States Quaternary Ammonium Compounds Market Revenue (billion) Forecast, by Application 2020 & 2033
- Table 30: United States Quaternary Ammonium Compounds Market Volume (K Tons) Forecast, by Application 2020 & 2033
- Table 31: Canada Quaternary Ammonium Compounds Market Revenue (billion) Forecast, by Application 2020 & 2033
- Table 32: Canada Quaternary Ammonium Compounds Market Volume (K Tons) Forecast, by Application 2020 & 2033
- Table 33: Mexico Quaternary Ammonium Compounds Market Revenue (billion) Forecast, by Application 2020 & 2033
- Table 34: Mexico Quaternary Ammonium Compounds Market Volume (K Tons) Forecast, by Application 2020 & 2033
- Table 35: Global Quaternary Ammonium Compounds Market Revenue billion Forecast, by Type 2020 & 2033
- Table 36: Global Quaternary Ammonium Compounds Market Volume K Tons Forecast, by Type 2020 & 2033
- Table 37: Global Quaternary Ammonium Compounds Market Revenue billion Forecast, by Application 2020 & 2033
- Table 38: Global Quaternary Ammonium Compounds Market Volume K Tons Forecast, by Application 2020 & 2033
- Table 39: Global Quaternary Ammonium Compounds Market Revenue billion Forecast, by Country 2020 & 2033
- Table 40: Global Quaternary Ammonium Compounds Market Volume K Tons Forecast, by Country 2020 & 2033
- Table 41: Germany Quaternary Ammonium Compounds Market Revenue (billion) Forecast, by Application 2020 & 2033
- Table 42: Germany Quaternary Ammonium Compounds Market Volume (K Tons) Forecast, by Application 2020 & 2033
- Table 43: United Kingdom Quaternary Ammonium Compounds Market Revenue (billion) Forecast, by Application 2020 & 2033
- Table 44: United Kingdom Quaternary Ammonium Compounds Market Volume (K Tons) Forecast, by Application 2020 & 2033
- Table 45: Italy Quaternary Ammonium Compounds Market Revenue (billion) Forecast, by Application 2020 & 2033
- Table 46: Italy Quaternary Ammonium Compounds Market Volume (K Tons) Forecast, by Application 2020 & 2033
- Table 47: France Quaternary Ammonium Compounds Market Revenue (billion) Forecast, by Application 2020 & 2033
- Table 48: France Quaternary Ammonium Compounds Market Volume (K Tons) Forecast, by Application 2020 & 2033
- Table 49: Rest of Europe Quaternary Ammonium Compounds Market Revenue (billion) Forecast, by Application 2020 & 2033
- Table 50: Rest of Europe Quaternary Ammonium Compounds Market Volume (K Tons) Forecast, by Application 2020 & 2033
- Table 51: Global Quaternary Ammonium Compounds Market Revenue billion Forecast, by Type 2020 & 2033
- Table 52: Global Quaternary Ammonium Compounds Market Volume K Tons Forecast, by Type 2020 & 2033
- Table 53: Global Quaternary Ammonium Compounds Market Revenue billion Forecast, by Application 2020 & 2033
- Table 54: Global Quaternary Ammonium Compounds Market Volume K Tons Forecast, by Application 2020 & 2033
- Table 55: Global Quaternary Ammonium Compounds Market Revenue billion Forecast, by Country 2020 & 2033
- Table 56: Global Quaternary Ammonium Compounds Market Volume K Tons Forecast, by Country 2020 & 2033
- Table 57: Brazil Quaternary Ammonium Compounds Market Revenue (billion) Forecast, by Application 2020 & 2033
- Table 58: Brazil Quaternary Ammonium Compounds Market Volume (K Tons) Forecast, by Application 2020 & 2033
- Table 59: Argentina Quaternary Ammonium Compounds Market Revenue (billion) Forecast, by Application 2020 & 2033
- Table 60: Argentina Quaternary Ammonium Compounds Market Volume (K Tons) Forecast, by Application 2020 & 2033
- Table 61: Rest of South America Quaternary Ammonium Compounds Market Revenue (billion) Forecast, by Application 2020 & 2033
- Table 62: Rest of South America Quaternary Ammonium Compounds Market Volume (K Tons) Forecast, by Application 2020 & 2033
- Table 63: Global Quaternary Ammonium Compounds Market Revenue billion Forecast, by Type 2020 & 2033
- Table 64: Global Quaternary Ammonium Compounds Market Volume K Tons Forecast, by Type 2020 & 2033
- Table 65: Global Quaternary Ammonium Compounds Market Revenue billion Forecast, by Application 2020 & 2033
- Table 66: Global Quaternary Ammonium Compounds Market Volume K Tons Forecast, by Application 2020 & 2033
- Table 67: Global Quaternary Ammonium Compounds Market Revenue billion Forecast, by Country 2020 & 2033
- Table 68: Global Quaternary Ammonium Compounds Market Volume K Tons Forecast, by Country 2020 & 2033
- Table 69: Saudi Arabia Quaternary Ammonium Compounds Market Revenue (billion) Forecast, by Application 2020 & 2033
- Table 70: Saudi Arabia Quaternary Ammonium Compounds Market Volume (K Tons) Forecast, by Application 2020 & 2033
- Table 71: South Africa Quaternary Ammonium Compounds Market Revenue (billion) Forecast, by Application 2020 & 2033
- Table 72: South Africa Quaternary Ammonium Compounds Market Volume (K Tons) Forecast, by Application 2020 & 2033
- Table 73: Rest of Middle East and Africa Quaternary Ammonium Compounds Market Revenue (billion) Forecast, by Application 2020 & 2033
- Table 74: Rest of Middle East and Africa Quaternary Ammonium Compounds Market Volume (K Tons) Forecast, by Application 2020 & 2033
Frequently Asked Questions
1. What is the projected Compound Annual Growth Rate (CAGR) of the Quaternary Ammonium Compounds Market?
The projected CAGR is approximately 4.35%.
2. Which companies are prominent players in the Quaternary Ammonium Compounds Market?
Key companies in the market include Henkel Adhesives Technologies, Arkema, Kao Chemicals Europe S L U, PDI Inc, Nouryon, KLK OLEO, BASF SE, S C Johnson & Son Inc, Huntsman International LLC, DuPont, Evonik.
3. What are the main segments of the Quaternary Ammonium Compounds Market?
The market segments include Type, Application.
4. Can you provide details about the market size?
The market size is estimated to be USD 1.17 billion as of 2022.
5. What are some drivers contributing to market growth?
A Rise in Demand for Disinfectant Products among Hospitals. Clinics. and General Households; Other Drivers.
6. What are the notable trends driving market growth?
Disinfectants Segment to Dominate the Market.
7. Are there any restraints impacting market growth?
Fluctuations in the Cost of Raw Materials; Other Restraints.
8. Can you provide examples of recent developments in the market?
March 2022: PDI launched new products, namely Sani-24 Germicidal Disposable Wipe, Sani-HyPerCide Germicidal Disposable Wipe, and Sani-HyPerCide Germicidal Spray. These are innovative disinfectants to help infection prevention professionals in the fight against rising healthcare-associated infections (HAIs).
9. What pricing options are available for accessing the report?
Pricing options include single-user, multi-user, and enterprise licenses priced at USD 4750, USD 5250, and USD 8750 respectively.
10. Is the market size provided in terms of value or volume?
The market size is provided in terms of value, measured in billion and volume, measured in K Tons.
11. Are there any specific market keywords associated with the report?
Yes, the market keyword associated with the report is "Quaternary Ammonium Compounds Market," which aids in identifying and referencing the specific market segment covered.
12. How do I determine which pricing option suits my needs best?
The pricing options vary based on user requirements and access needs. Individual users may opt for single-user licenses, while businesses requiring broader access may choose multi-user or enterprise licenses for cost-effective access to the report.
13. Are there any additional resources or data provided in the Quaternary Ammonium Compounds Market report?
While the report offers comprehensive insights, it's advisable to review the specific contents or supplementary materials provided to ascertain if additional resources or data are available.
14. How can I stay updated on further developments or reports in the Quaternary Ammonium Compounds Market?
To stay informed about further developments, trends, and reports in the Quaternary Ammonium Compounds Market, consider subscribing to industry newsletters, following relevant companies and organizations, or regularly checking reputable industry news sources and publications.
Methodology
Step 1 - Identification of Relevant Samples Size from Population Database


Step 2 - Approaches for Defining Global Market Size (Value, Volume* & Price*)

Note*: In applicable scenarios
Step 3 - Data Sources
Primary Research
- Web Analytics
- Survey Reports
- Research Institute
- Latest Research Reports
- Opinion Leaders
Secondary Research
- Annual Reports
- White Paper
- Latest Press Release
- Industry Association
- Paid Database
- Investor Presentations

Step 4 - Data Triangulation
Involves using different sources of information in order to increase the validity of a study
These sources are likely to be stakeholders in a program - participants, other researchers, program staff, other community members, and so on.
Then we put all data in single framework & apply various statistical tools to find out the dynamic on the market.
During the analysis stage, feedback from the stakeholder groups would be compared to determine areas of agreement as well as areas of divergence