Key Insights
The Recovered Carbon Black (RCB) market is projected to reach $14.5 billion by 2025, with a Compound Annual Growth Rate (CAGR) of 4.8% from 2025 to 2033. This expansion is propelled by escalating environmental consciousness, particularly regarding waste tire disposal, and a growing demand for sustainable materials across industries. Key growth drivers include robust environmental regulations advocating for waste recycling and the widespread adoption of circular economy principles. Significant demand is anticipated in tire and plastic applications, where RCB offers a cost-effective and performant alternative to virgin carbon black. The automotive and building & construction sectors are identified as primary end-user industries. Market growth may encounter hurdles such as variability in recovered material quality, processing inefficiencies with diverse waste streams, and a lack of standardized industry practices. Nevertheless, advancements in RCB production technology and increased R&D investments are expected to overcome these challenges. The Asia-Pacific region, led by China and India, is poised for substantial growth due to abundant waste tire volumes and favorable government policies.
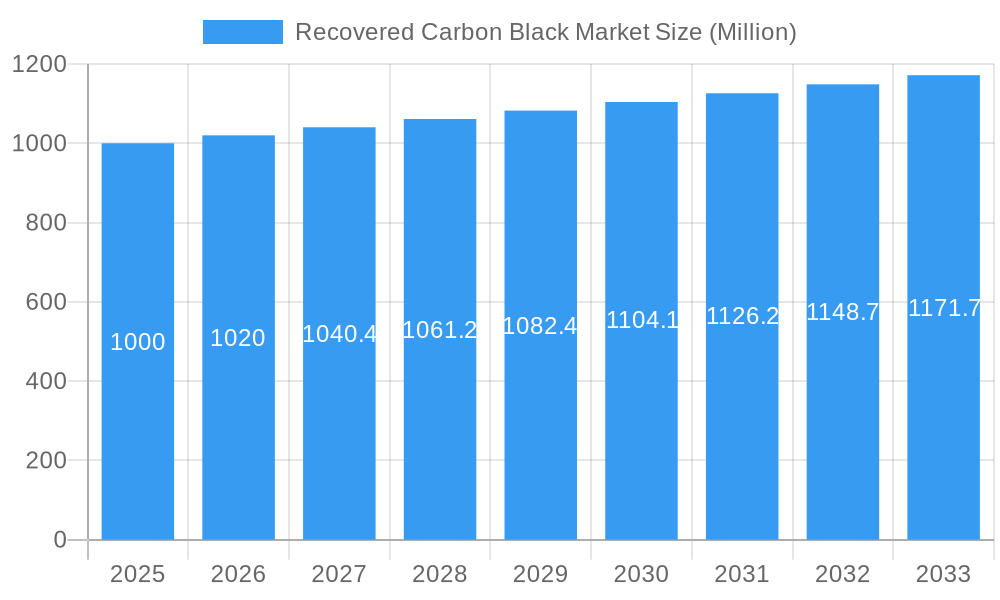
Recovered Carbon Black Market Market Size (In Billion)
Technological advancements in RCB production, including refined pyrolysis and gasification techniques, are crucial for enhancing purity and consistency. Strategic collaborations between RCB manufacturers and end-users will be vital for establishing dependable supply chains and industry benchmarks. Diversifying into new applications like dyes and pigments will also significantly contribute to market expansion. While the North American market is currently smaller than Asia-Pacific, it is expected to exhibit considerable growth, driven by a heightened focus on sustainability and stringent environmental mandates. Europe is anticipated to mirror this trend, supported by its strong commitment to circular economy initiatives and established recycling infrastructure. The market is characterized by a competitive landscape featuring established and emerging players. Strategic alliances, mergers, and technological innovation will likely shape its future trajectory.
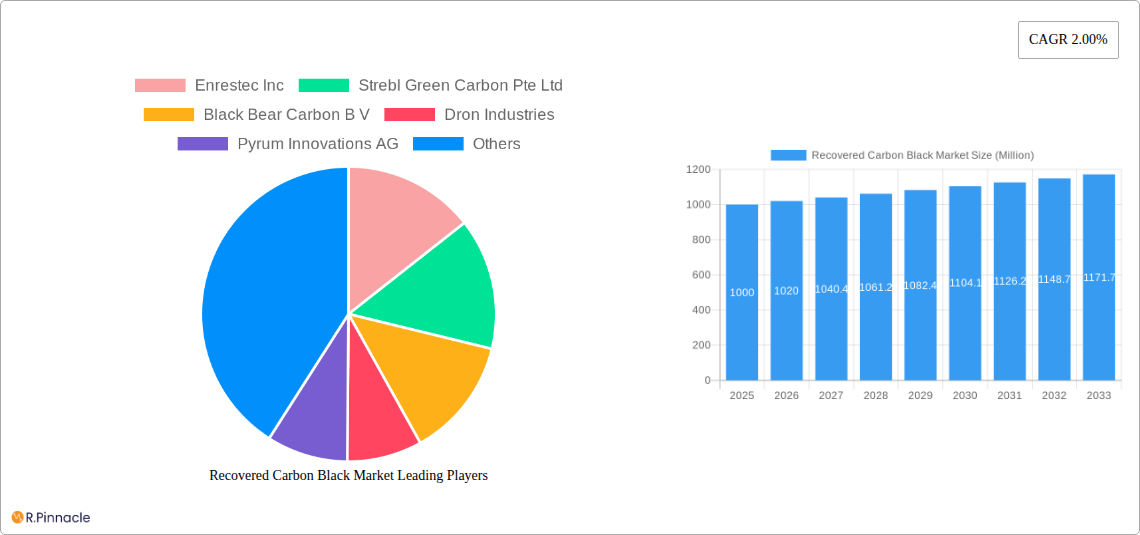
Recovered Carbon Black Market Company Market Share
Recovered Carbon Black Market Report: 2019-2033
This comprehensive report provides an in-depth analysis of the Recovered Carbon Black (rCB) market, offering invaluable insights for industry professionals, investors, and strategic decision-makers. The study covers the period 2019-2033, with a focus on the 2025-2033 forecast period. The report leverages extensive market research and data analysis to illuminate key trends, opportunities, and challenges shaping this dynamic sector. Expect detailed market sizing (in Millions), CAGR projections, and competitive landscape analysis.
Recovered Carbon Black Market Market Structure & Innovation Trends
This section analyzes the competitive landscape of the rCB market, encompassing market concentration, innovation drivers, regulatory frameworks, product substitutes, end-user demographics, and mergers and acquisitions (M&A) activities. The report details the market share of key players such as Enrestec Inc, Strebl Green Carbon Pte Ltd, Black Bear Carbon B V, Dron Industries, Pyrum Innovations AG, Carbon Recovery GmbH, DVA Renewable Energy JSC, SR2O Holdings LLC, Klean Industries Inc, Polimix, Delta Energy LLC, Reoil Sp z o o, Bolder Industries, Scandinavian Enviro Systems AB, and Alpha Carbone. We assess the level of market consolidation and identify emerging players.
- Market Concentration: The report quantifies market concentration using metrics like the Herfindahl-Hirschman Index (HHI) and identifies the top 5 players and their respective market share (xx%).
- Innovation Drivers: Analysis focuses on technological advancements driving innovation in rCB production and application, including pyrolysis and other recycling techniques.
- Regulatory Frameworks: Examination of government policies and regulations influencing rCB production and consumption across different regions.
- Product Substitutes: Evaluation of potential substitute materials and their impact on rCB market demand.
- End-User Demographics: Profiling of key end-user industries and their rCB consumption patterns.
- M&A Activities: Review of significant M&A transactions in the rCB market during the historical period, including deal values (xx Million) and their implications for market dynamics.
Recovered Carbon Black Market Market Dynamics & Trends
This section delves into the key factors driving the growth of the rCB market, including technological advancements, evolving consumer preferences, and competitive dynamics. The report will provide a detailed analysis of the market’s Compound Annual Growth Rate (CAGR) (xx%) during the forecast period (2025-2033). Market penetration rates for various applications will also be analyzed.
- Market Growth Drivers: Exploration of factors like increasing environmental concerns, stringent regulations on waste tire management, rising demand from the automotive and tire industries, and cost advantages over virgin carbon black.
- Technological Disruptions: Assessment of the impact of emerging technologies such as advanced pyrolysis techniques, improved rCB quality, and enhanced downstream processing capabilities.
- Consumer Preferences: Analysis of changing consumer demand and preferences for sustainable and recycled materials.
- Competitive Dynamics: Examination of the competitive landscape, strategies employed by key players, and their impact on market growth.
Dominant Regions & Segments in Recovered Carbon Black Market
This section identifies the leading regions and segments in the rCB market based on Application (Tires, Batteries, Plastics, Non-Tire Rubber, Dyes and Pigments) and End-user Industry (Printing and Packaging, Industrial, Building and Construction, Electronics, Automotive, Other End-user Industries).
Key Drivers by Region/Segment:
- Europe: Stringent environmental regulations, strong recycling infrastructure, and high adoption of sustainable practices.
- North America: Growing demand from the automotive industry, increasing awareness of environmental issues, and government support for recycling initiatives.
- Asia Pacific: Rapid industrialization, rising demand for tires and other rubber products, and cost-effective manufacturing capabilities.
- Tires Segment: Largest application segment driven by the high volume of end-of-life tires and the need for sustainable material solutions.
- Automotive Industry: Significant end-user industry due to the large quantities of carbon black used in tire production.
Dominance Analysis: Detailed analysis of market share, growth potential, and competitive intensity within each leading region and segment.
Recovered Carbon Black Market Product Innovations
This section highlights recent advancements in rCB technology, including the development of high-quality rCB suitable for various applications, and the improvement of production processes to increase efficiency and reduce costs. Specific examples will be provided, along with an assessment of the market fit and competitive advantages of new products.
Report Scope & Segmentation Analysis
This report provides a detailed segmentation of the rCB market based on application and end-user industry. Each segment includes growth projections, market size (in Millions), and competitive landscape analysis.
- Application Segmentation: Detailed breakdown of market size and growth for Tires, Batteries, Plastics, Non-Tire Rubber, and Dyes and Pigments.
- End-user Industry Segmentation: Detailed breakdown of market size and growth for Printing and Packaging, Industrial, Building and Construction, Electronics, Automotive, and Other End-user Industries.
Key Drivers of Recovered Carbon Black Market Growth
The growth of the rCB market is driven by a combination of technological advancements, favorable economic conditions, and supportive regulatory frameworks. Key drivers include: the increasing demand for sustainable materials, stringent environmental regulations promoting recycling, advancements in pyrolysis technology leading to improved rCB quality, and cost advantages over virgin carbon black.
Challenges in the Recovered Carbon Black Market Sector
The rCB market faces several challenges, including the inconsistent quality of recovered material, the high capital investment required for advanced recycling technologies, and the competition from virgin carbon black. Furthermore, the establishment of a robust collection and logistics infrastructure for waste materials remains a significant hurdle.
Emerging Opportunities in Recovered Carbon Black Market
Emerging opportunities include the expansion into new applications for rCB, the development of innovative recycling technologies, and collaborations between different stakeholders across the value chain to promote the adoption of sustainable materials. The exploration of new markets and regions with high growth potential also offers significant opportunities for expansion.
Leading Players in the Recovered Carbon Black Market Market
- Enrestec Inc
- Strebl Green Carbon Pte Ltd
- Black Bear Carbon B V
- Dron Industries
- Pyrum Innovations AG
- Carbon Recovery GmbH
- DVA Renewable Energy JSC
- SR2O Holdings LLC
- Klean Industries Inc
- Polimix
- Delta Energy LLC
- Reoil Sp z o o
- Bolder Industries
- Scandinavian Enviro Systems AB
- Alpha Carbone
Key Developments in Recovered Carbon Black Market Industry
- May 2022: Pyrum Innovations AG commenced test operations of a new pelletizer in Germany, enhancing rCB transportability and processing.
- March 2022: Continental AG expanded its partnership with Pyrum Innovations AG to optimize end-of-life tire recycling and rCB production for tire manufacturing.
- April 2020: Scandinavian Enviro Systems AB and Michelin partnered to develop innovative rCB technology for transforming used tires into raw materials.
Future Outlook for Recovered Carbon Black Market Market
The future outlook for the rCB market is positive, driven by the increasing demand for sustainable materials and continuous technological advancements. Strategic collaborations, investments in research and development, and expanding applications across various industries will drive significant market growth over the forecast period. The market is expected to witness substantial expansion, particularly in regions with stringent environmental regulations and a growing focus on circular economy principles.
Recovered Carbon Black Market Segmentation
-
1. Application
- 1.1. Tires
- 1.2. Batteries
- 1.3. Plastics
- 1.4. Non-Tire Rubber
- 1.5. Dyes and Pigments
-
2. End-user Industry
- 2.1. Printing and Packaging
- 2.2. Industrial
- 2.3. Building and Construction
- 2.4. Electronics
- 2.5. Automotive
- 2.6. Other End-user Industries
Recovered Carbon Black Market Segmentation By Geography
-
1. Asia Pacific
- 1.1. China
- 1.2. India
- 1.3. Japan
- 1.4. South Korea
- 1.5. Rest of Asia Pacific
-
2. North America
- 2.1. United States
- 2.2. Canada
- 2.3. Mexico
-
3. Europe
- 3.1. Germany
- 3.2. United Kingdom
- 3.3. Italy
- 3.4. France
- 3.5. Rest of Europe
-
4. South America
- 4.1. Brazil
- 4.2. Argentina
- 4.3. Rest of South America
-
5. Middle East and Africa
- 5.1. Saudi Arabia
- 5.2. South Africa
- 5.3. Rest of Middle East and Africa
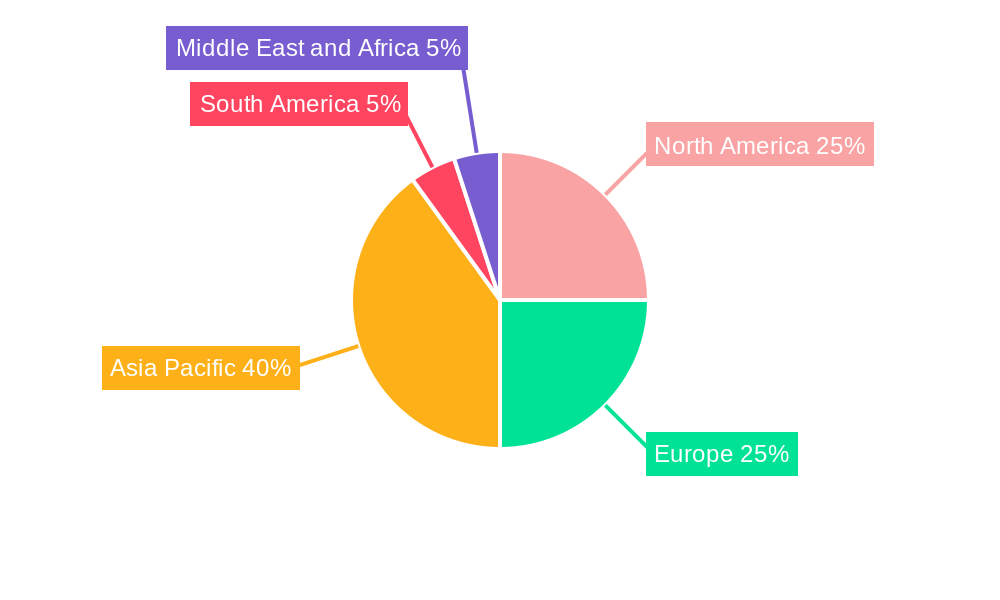
Recovered Carbon Black Market Regional Market Share
Geographic Coverage of Recovered Carbon Black Market
Recovered Carbon Black Market REPORT HIGHLIGHTS
| Aspects | Details |
|---|---|
| Study Period | 2020-2034 |
| Base Year | 2025 |
| Estimated Year | 2026 |
| Forecast Period | 2026-2034 |
| Historical Period | 2020-2025 |
| Growth Rate | CAGR of 4.8% from 2020-2034 |
| Segmentation |
|
Table of Contents
- 1. Introduction
- 1.1. Research Scope
- 1.2. Market Segmentation
- 1.3. Research Objective
- 1.4. Definitions and Assumptions
- 2. Executive Summary
- 2.1. Market Snapshot
- 3. Market Dynamics
- 3.1. Market Drivers
- 3.2. Market Restrains
- 3.3. Market Trends
- 3.4. Market Opportunities
- 4. Market Factor Analysis
- 4.1. Porters Five Forces
- 4.1.1. Bargaining Power of Suppliers
- 4.1.2. Bargaining Power of Buyers
- 4.1.3. Threat of New Entrants
- 4.1.4. Threat of Substitutes
- 4.1.5. Competitive Rivalry
- 4.2. PESTEL analysis
- 4.3. BCG Analysis
- 4.3.1. Stars (High Growth, High Market Share)
- 4.3.2. Cash Cows (Low Growth, High Market Share)
- 4.3.3. Question Mark (High Growth, Low Market Share)
- 4.3.4. Dogs (Low Growth, Low Market Share)
- 4.4. Ansoff Matrix Analysis
- 4.5. Supply Chain Analysis
- 4.6. Regulatory Landscape
- 4.7. Current Market Potential and Opportunity Assessment (TAM–SAM–SOM Framework)
- 4.8. PRI Analyst Note
- 4.1. Porters Five Forces
- 5. Market Analysis, Insights and Forecast 2021-2033
- 5.1. Market Analysis, Insights and Forecast - by Application
- 5.1.1. Tires
- 5.1.2. Batteries
- 5.1.3. Plastics
- 5.1.4. Non-Tire Rubber
- 5.1.5. Dyes and Pigments
- 5.2. Market Analysis, Insights and Forecast - by End-user Industry
- 5.2.1. Printing and Packaging
- 5.2.2. Industrial
- 5.2.3. Building and Construction
- 5.2.4. Electronics
- 5.2.5. Automotive
- 5.2.6. Other End-user Industries
- 5.3. Market Analysis, Insights and Forecast - by Region
- 5.3.1. Asia Pacific
- 5.3.2. North America
- 5.3.3. Europe
- 5.3.4. South America
- 5.3.5. Middle East and Africa
- 5.1. Market Analysis, Insights and Forecast - by Application
- 6. Global Recovered Carbon Black Market Analysis, Insights and Forecast, 2021-2033
- 6.1. Market Analysis, Insights and Forecast - by Application
- 6.1.1. Tires
- 6.1.2. Batteries
- 6.1.3. Plastics
- 6.1.4. Non-Tire Rubber
- 6.1.5. Dyes and Pigments
- 6.2. Market Analysis, Insights and Forecast - by End-user Industry
- 6.2.1. Printing and Packaging
- 6.2.2. Industrial
- 6.2.3. Building and Construction
- 6.2.4. Electronics
- 6.2.5. Automotive
- 6.2.6. Other End-user Industries
- 6.1. Market Analysis, Insights and Forecast - by Application
- 7. Asia Pacific Recovered Carbon Black Market Analysis, Insights and Forecast, 2020-2032
- 7.1. Market Analysis, Insights and Forecast - by Application
- 7.1.1. Tires
- 7.1.2. Batteries
- 7.1.3. Plastics
- 7.1.4. Non-Tire Rubber
- 7.1.5. Dyes and Pigments
- 7.2. Market Analysis, Insights and Forecast - by End-user Industry
- 7.2.1. Printing and Packaging
- 7.2.2. Industrial
- 7.2.3. Building and Construction
- 7.2.4. Electronics
- 7.2.5. Automotive
- 7.2.6. Other End-user Industries
- 7.1. Market Analysis, Insights and Forecast - by Application
- 8. North America Recovered Carbon Black Market Analysis, Insights and Forecast, 2020-2032
- 8.1. Market Analysis, Insights and Forecast - by Application
- 8.1.1. Tires
- 8.1.2. Batteries
- 8.1.3. Plastics
- 8.1.4. Non-Tire Rubber
- 8.1.5. Dyes and Pigments
- 8.2. Market Analysis, Insights and Forecast - by End-user Industry
- 8.2.1. Printing and Packaging
- 8.2.2. Industrial
- 8.2.3. Building and Construction
- 8.2.4. Electronics
- 8.2.5. Automotive
- 8.2.6. Other End-user Industries
- 8.1. Market Analysis, Insights and Forecast - by Application
- 9. Europe Recovered Carbon Black Market Analysis, Insights and Forecast, 2020-2032
- 9.1. Market Analysis, Insights and Forecast - by Application
- 9.1.1. Tires
- 9.1.2. Batteries
- 9.1.3. Plastics
- 9.1.4. Non-Tire Rubber
- 9.1.5. Dyes and Pigments
- 9.2. Market Analysis, Insights and Forecast - by End-user Industry
- 9.2.1. Printing and Packaging
- 9.2.2. Industrial
- 9.2.3. Building and Construction
- 9.2.4. Electronics
- 9.2.5. Automotive
- 9.2.6. Other End-user Industries
- 9.1. Market Analysis, Insights and Forecast - by Application
- 10. South America Recovered Carbon Black Market Analysis, Insights and Forecast, 2020-2032
- 10.1. Market Analysis, Insights and Forecast - by Application
- 10.1.1. Tires
- 10.1.2. Batteries
- 10.1.3. Plastics
- 10.1.4. Non-Tire Rubber
- 10.1.5. Dyes and Pigments
- 10.2. Market Analysis, Insights and Forecast - by End-user Industry
- 10.2.1. Printing and Packaging
- 10.2.2. Industrial
- 10.2.3. Building and Construction
- 10.2.4. Electronics
- 10.2.5. Automotive
- 10.2.6. Other End-user Industries
- 10.1. Market Analysis, Insights and Forecast - by Application
- 11. Middle East and Africa Recovered Carbon Black Market Analysis, Insights and Forecast, 2020-2032
- 11.1. Market Analysis, Insights and Forecast - by Application
- 11.1.1. Tires
- 11.1.2. Batteries
- 11.1.3. Plastics
- 11.1.4. Non-Tire Rubber
- 11.1.5. Dyes and Pigments
- 11.2. Market Analysis, Insights and Forecast - by End-user Industry
- 11.2.1. Printing and Packaging
- 11.2.2. Industrial
- 11.2.3. Building and Construction
- 11.2.4. Electronics
- 11.2.5. Automotive
- 11.2.6. Other End-user Industries
- 11.1. Market Analysis, Insights and Forecast - by Application
- 12. Competitive Analysis
- 12.1. Company Profiles
- 12.1.1 Enrestec Inc
- 12.1.1.1. Company Overview
- 12.1.1.2. Products
- 12.1.1.3. Company Financials
- 12.1.1.4. SWOT Analysis
- 12.1.2 Strebl Green Carbon Pte Ltd
- 12.1.2.1. Company Overview
- 12.1.2.2. Products
- 12.1.2.3. Company Financials
- 12.1.2.4. SWOT Analysis
- 12.1.3 Black Bear Carbon B V
- 12.1.3.1. Company Overview
- 12.1.3.2. Products
- 12.1.3.3. Company Financials
- 12.1.3.4. SWOT Analysis
- 12.1.4 Dron Industries
- 12.1.4.1. Company Overview
- 12.1.4.2. Products
- 12.1.4.3. Company Financials
- 12.1.4.4. SWOT Analysis
- 12.1.5 Pyrum Innovations AG
- 12.1.5.1. Company Overview
- 12.1.5.2. Products
- 12.1.5.3. Company Financials
- 12.1.5.4. SWOT Analysis
- 12.1.6 Carbon Recovery GmbH
- 12.1.6.1. Company Overview
- 12.1.6.2. Products
- 12.1.6.3. Company Financials
- 12.1.6.4. SWOT Analysis
- 12.1.7 DVA Renewable Energy JSC
- 12.1.7.1. Company Overview
- 12.1.7.2. Products
- 12.1.7.3. Company Financials
- 12.1.7.4. SWOT Analysis
- 12.1.8 SR2O Holdings LLC
- 12.1.8.1. Company Overview
- 12.1.8.2. Products
- 12.1.8.3. Company Financials
- 12.1.8.4. SWOT Analysis
- 12.1.9 Klean Industries Inc
- 12.1.9.1. Company Overview
- 12.1.9.2. Products
- 12.1.9.3. Company Financials
- 12.1.9.4. SWOT Analysis
- 12.1.10 Polimix
- 12.1.10.1. Company Overview
- 12.1.10.2. Products
- 12.1.10.3. Company Financials
- 12.1.10.4. SWOT Analysis
- 12.1.11 Delta Energy LLC
- 12.1.11.1. Company Overview
- 12.1.11.2. Products
- 12.1.11.3. Company Financials
- 12.1.11.4. SWOT Analysis
- 12.1.12 Reoil Sp z o o
- 12.1.12.1. Company Overview
- 12.1.12.2. Products
- 12.1.12.3. Company Financials
- 12.1.12.4. SWOT Analysis
- 12.1.13 Bolder Industries
- 12.1.13.1. Company Overview
- 12.1.13.2. Products
- 12.1.13.3. Company Financials
- 12.1.13.4. SWOT Analysis
- 12.1.14 Scandinavian Enviro Systems AB
- 12.1.14.1. Company Overview
- 12.1.14.2. Products
- 12.1.14.3. Company Financials
- 12.1.14.4. SWOT Analysis
- 12.1.15 Alpha Carbone
- 12.1.15.1. Company Overview
- 12.1.15.2. Products
- 12.1.15.3. Company Financials
- 12.1.15.4. SWOT Analysis
- 12.1.1 Enrestec Inc
- 12.2. Market Entropy
- 12.2.1 Company's Key Areas Served
- 12.2.2 Recent Developments
- 12.3. Company Market Share Analysis 2025
- 12.3.1 Top 5 Companies Market Share Analysis
- 12.3.2 Top 3 Companies Market Share Analysis
- 12.4. List of Potential Customers
- 13. Research Methodology
List of Figures
- Figure 1: Global Recovered Carbon Black Market Revenue Breakdown (billion, %) by Region 2025 & 2033
- Figure 2: Global Recovered Carbon Black Market Volume Breakdown (K Tons, %) by Region 2025 & 2033
- Figure 3: Asia Pacific Recovered Carbon Black Market Revenue (billion), by Application 2025 & 2033
- Figure 4: Asia Pacific Recovered Carbon Black Market Volume (K Tons), by Application 2025 & 2033
- Figure 5: Asia Pacific Recovered Carbon Black Market Revenue Share (%), by Application 2025 & 2033
- Figure 6: Asia Pacific Recovered Carbon Black Market Volume Share (%), by Application 2025 & 2033
- Figure 7: Asia Pacific Recovered Carbon Black Market Revenue (billion), by End-user Industry 2025 & 2033
- Figure 8: Asia Pacific Recovered Carbon Black Market Volume (K Tons), by End-user Industry 2025 & 2033
- Figure 9: Asia Pacific Recovered Carbon Black Market Revenue Share (%), by End-user Industry 2025 & 2033
- Figure 10: Asia Pacific Recovered Carbon Black Market Volume Share (%), by End-user Industry 2025 & 2033
- Figure 11: Asia Pacific Recovered Carbon Black Market Revenue (billion), by Country 2025 & 2033
- Figure 12: Asia Pacific Recovered Carbon Black Market Volume (K Tons), by Country 2025 & 2033
- Figure 13: Asia Pacific Recovered Carbon Black Market Revenue Share (%), by Country 2025 & 2033
- Figure 14: Asia Pacific Recovered Carbon Black Market Volume Share (%), by Country 2025 & 2033
- Figure 15: North America Recovered Carbon Black Market Revenue (billion), by Application 2025 & 2033
- Figure 16: North America Recovered Carbon Black Market Volume (K Tons), by Application 2025 & 2033
- Figure 17: North America Recovered Carbon Black Market Revenue Share (%), by Application 2025 & 2033
- Figure 18: North America Recovered Carbon Black Market Volume Share (%), by Application 2025 & 2033
- Figure 19: North America Recovered Carbon Black Market Revenue (billion), by End-user Industry 2025 & 2033
- Figure 20: North America Recovered Carbon Black Market Volume (K Tons), by End-user Industry 2025 & 2033
- Figure 21: North America Recovered Carbon Black Market Revenue Share (%), by End-user Industry 2025 & 2033
- Figure 22: North America Recovered Carbon Black Market Volume Share (%), by End-user Industry 2025 & 2033
- Figure 23: North America Recovered Carbon Black Market Revenue (billion), by Country 2025 & 2033
- Figure 24: North America Recovered Carbon Black Market Volume (K Tons), by Country 2025 & 2033
- Figure 25: North America Recovered Carbon Black Market Revenue Share (%), by Country 2025 & 2033
- Figure 26: North America Recovered Carbon Black Market Volume Share (%), by Country 2025 & 2033
- Figure 27: Europe Recovered Carbon Black Market Revenue (billion), by Application 2025 & 2033
- Figure 28: Europe Recovered Carbon Black Market Volume (K Tons), by Application 2025 & 2033
- Figure 29: Europe Recovered Carbon Black Market Revenue Share (%), by Application 2025 & 2033
- Figure 30: Europe Recovered Carbon Black Market Volume Share (%), by Application 2025 & 2033
- Figure 31: Europe Recovered Carbon Black Market Revenue (billion), by End-user Industry 2025 & 2033
- Figure 32: Europe Recovered Carbon Black Market Volume (K Tons), by End-user Industry 2025 & 2033
- Figure 33: Europe Recovered Carbon Black Market Revenue Share (%), by End-user Industry 2025 & 2033
- Figure 34: Europe Recovered Carbon Black Market Volume Share (%), by End-user Industry 2025 & 2033
- Figure 35: Europe Recovered Carbon Black Market Revenue (billion), by Country 2025 & 2033
- Figure 36: Europe Recovered Carbon Black Market Volume (K Tons), by Country 2025 & 2033
- Figure 37: Europe Recovered Carbon Black Market Revenue Share (%), by Country 2025 & 2033
- Figure 38: Europe Recovered Carbon Black Market Volume Share (%), by Country 2025 & 2033
- Figure 39: South America Recovered Carbon Black Market Revenue (billion), by Application 2025 & 2033
- Figure 40: South America Recovered Carbon Black Market Volume (K Tons), by Application 2025 & 2033
- Figure 41: South America Recovered Carbon Black Market Revenue Share (%), by Application 2025 & 2033
- Figure 42: South America Recovered Carbon Black Market Volume Share (%), by Application 2025 & 2033
- Figure 43: South America Recovered Carbon Black Market Revenue (billion), by End-user Industry 2025 & 2033
- Figure 44: South America Recovered Carbon Black Market Volume (K Tons), by End-user Industry 2025 & 2033
- Figure 45: South America Recovered Carbon Black Market Revenue Share (%), by End-user Industry 2025 & 2033
- Figure 46: South America Recovered Carbon Black Market Volume Share (%), by End-user Industry 2025 & 2033
- Figure 47: South America Recovered Carbon Black Market Revenue (billion), by Country 2025 & 2033
- Figure 48: South America Recovered Carbon Black Market Volume (K Tons), by Country 2025 & 2033
- Figure 49: South America Recovered Carbon Black Market Revenue Share (%), by Country 2025 & 2033
- Figure 50: South America Recovered Carbon Black Market Volume Share (%), by Country 2025 & 2033
- Figure 51: Middle East and Africa Recovered Carbon Black Market Revenue (billion), by Application 2025 & 2033
- Figure 52: Middle East and Africa Recovered Carbon Black Market Volume (K Tons), by Application 2025 & 2033
- Figure 53: Middle East and Africa Recovered Carbon Black Market Revenue Share (%), by Application 2025 & 2033
- Figure 54: Middle East and Africa Recovered Carbon Black Market Volume Share (%), by Application 2025 & 2033
- Figure 55: Middle East and Africa Recovered Carbon Black Market Revenue (billion), by End-user Industry 2025 & 2033
- Figure 56: Middle East and Africa Recovered Carbon Black Market Volume (K Tons), by End-user Industry 2025 & 2033
- Figure 57: Middle East and Africa Recovered Carbon Black Market Revenue Share (%), by End-user Industry 2025 & 2033
- Figure 58: Middle East and Africa Recovered Carbon Black Market Volume Share (%), by End-user Industry 2025 & 2033
- Figure 59: Middle East and Africa Recovered Carbon Black Market Revenue (billion), by Country 2025 & 2033
- Figure 60: Middle East and Africa Recovered Carbon Black Market Volume (K Tons), by Country 2025 & 2033
- Figure 61: Middle East and Africa Recovered Carbon Black Market Revenue Share (%), by Country 2025 & 2033
- Figure 62: Middle East and Africa Recovered Carbon Black Market Volume Share (%), by Country 2025 & 2033
List of Tables
- Table 1: Global Recovered Carbon Black Market Revenue billion Forecast, by Application 2020 & 2033
- Table 2: Global Recovered Carbon Black Market Volume K Tons Forecast, by Application 2020 & 2033
- Table 3: Global Recovered Carbon Black Market Revenue billion Forecast, by End-user Industry 2020 & 2033
- Table 4: Global Recovered Carbon Black Market Volume K Tons Forecast, by End-user Industry 2020 & 2033
- Table 5: Global Recovered Carbon Black Market Revenue billion Forecast, by Region 2020 & 2033
- Table 6: Global Recovered Carbon Black Market Volume K Tons Forecast, by Region 2020 & 2033
- Table 7: Global Recovered Carbon Black Market Revenue billion Forecast, by Application 2020 & 2033
- Table 8: Global Recovered Carbon Black Market Volume K Tons Forecast, by Application 2020 & 2033
- Table 9: Global Recovered Carbon Black Market Revenue billion Forecast, by End-user Industry 2020 & 2033
- Table 10: Global Recovered Carbon Black Market Volume K Tons Forecast, by End-user Industry 2020 & 2033
- Table 11: Global Recovered Carbon Black Market Revenue billion Forecast, by Country 2020 & 2033
- Table 12: Global Recovered Carbon Black Market Volume K Tons Forecast, by Country 2020 & 2033
- Table 13: China Recovered Carbon Black Market Revenue (billion) Forecast, by Application 2020 & 2033
- Table 14: China Recovered Carbon Black Market Volume (K Tons) Forecast, by Application 2020 & 2033
- Table 15: India Recovered Carbon Black Market Revenue (billion) Forecast, by Application 2020 & 2033
- Table 16: India Recovered Carbon Black Market Volume (K Tons) Forecast, by Application 2020 & 2033
- Table 17: Japan Recovered Carbon Black Market Revenue (billion) Forecast, by Application 2020 & 2033
- Table 18: Japan Recovered Carbon Black Market Volume (K Tons) Forecast, by Application 2020 & 2033
- Table 19: South Korea Recovered Carbon Black Market Revenue (billion) Forecast, by Application 2020 & 2033
- Table 20: South Korea Recovered Carbon Black Market Volume (K Tons) Forecast, by Application 2020 & 2033
- Table 21: Rest of Asia Pacific Recovered Carbon Black Market Revenue (billion) Forecast, by Application 2020 & 2033
- Table 22: Rest of Asia Pacific Recovered Carbon Black Market Volume (K Tons) Forecast, by Application 2020 & 2033
- Table 23: Global Recovered Carbon Black Market Revenue billion Forecast, by Application 2020 & 2033
- Table 24: Global Recovered Carbon Black Market Volume K Tons Forecast, by Application 2020 & 2033
- Table 25: Global Recovered Carbon Black Market Revenue billion Forecast, by End-user Industry 2020 & 2033
- Table 26: Global Recovered Carbon Black Market Volume K Tons Forecast, by End-user Industry 2020 & 2033
- Table 27: Global Recovered Carbon Black Market Revenue billion Forecast, by Country 2020 & 2033
- Table 28: Global Recovered Carbon Black Market Volume K Tons Forecast, by Country 2020 & 2033
- Table 29: United States Recovered Carbon Black Market Revenue (billion) Forecast, by Application 2020 & 2033
- Table 30: United States Recovered Carbon Black Market Volume (K Tons) Forecast, by Application 2020 & 2033
- Table 31: Canada Recovered Carbon Black Market Revenue (billion) Forecast, by Application 2020 & 2033
- Table 32: Canada Recovered Carbon Black Market Volume (K Tons) Forecast, by Application 2020 & 2033
- Table 33: Mexico Recovered Carbon Black Market Revenue (billion) Forecast, by Application 2020 & 2033
- Table 34: Mexico Recovered Carbon Black Market Volume (K Tons) Forecast, by Application 2020 & 2033
- Table 35: Global Recovered Carbon Black Market Revenue billion Forecast, by Application 2020 & 2033
- Table 36: Global Recovered Carbon Black Market Volume K Tons Forecast, by Application 2020 & 2033
- Table 37: Global Recovered Carbon Black Market Revenue billion Forecast, by End-user Industry 2020 & 2033
- Table 38: Global Recovered Carbon Black Market Volume K Tons Forecast, by End-user Industry 2020 & 2033
- Table 39: Global Recovered Carbon Black Market Revenue billion Forecast, by Country 2020 & 2033
- Table 40: Global Recovered Carbon Black Market Volume K Tons Forecast, by Country 2020 & 2033
- Table 41: Germany Recovered Carbon Black Market Revenue (billion) Forecast, by Application 2020 & 2033
- Table 42: Germany Recovered Carbon Black Market Volume (K Tons) Forecast, by Application 2020 & 2033
- Table 43: United Kingdom Recovered Carbon Black Market Revenue (billion) Forecast, by Application 2020 & 2033
- Table 44: United Kingdom Recovered Carbon Black Market Volume (K Tons) Forecast, by Application 2020 & 2033
- Table 45: Italy Recovered Carbon Black Market Revenue (billion) Forecast, by Application 2020 & 2033
- Table 46: Italy Recovered Carbon Black Market Volume (K Tons) Forecast, by Application 2020 & 2033
- Table 47: France Recovered Carbon Black Market Revenue (billion) Forecast, by Application 2020 & 2033
- Table 48: France Recovered Carbon Black Market Volume (K Tons) Forecast, by Application 2020 & 2033
- Table 49: Rest of Europe Recovered Carbon Black Market Revenue (billion) Forecast, by Application 2020 & 2033
- Table 50: Rest of Europe Recovered Carbon Black Market Volume (K Tons) Forecast, by Application 2020 & 2033
- Table 51: Global Recovered Carbon Black Market Revenue billion Forecast, by Application 2020 & 2033
- Table 52: Global Recovered Carbon Black Market Volume K Tons Forecast, by Application 2020 & 2033
- Table 53: Global Recovered Carbon Black Market Revenue billion Forecast, by End-user Industry 2020 & 2033
- Table 54: Global Recovered Carbon Black Market Volume K Tons Forecast, by End-user Industry 2020 & 2033
- Table 55: Global Recovered Carbon Black Market Revenue billion Forecast, by Country 2020 & 2033
- Table 56: Global Recovered Carbon Black Market Volume K Tons Forecast, by Country 2020 & 2033
- Table 57: Brazil Recovered Carbon Black Market Revenue (billion) Forecast, by Application 2020 & 2033
- Table 58: Brazil Recovered Carbon Black Market Volume (K Tons) Forecast, by Application 2020 & 2033
- Table 59: Argentina Recovered Carbon Black Market Revenue (billion) Forecast, by Application 2020 & 2033
- Table 60: Argentina Recovered Carbon Black Market Volume (K Tons) Forecast, by Application 2020 & 2033
- Table 61: Rest of South America Recovered Carbon Black Market Revenue (billion) Forecast, by Application 2020 & 2033
- Table 62: Rest of South America Recovered Carbon Black Market Volume (K Tons) Forecast, by Application 2020 & 2033
- Table 63: Global Recovered Carbon Black Market Revenue billion Forecast, by Application 2020 & 2033
- Table 64: Global Recovered Carbon Black Market Volume K Tons Forecast, by Application 2020 & 2033
- Table 65: Global Recovered Carbon Black Market Revenue billion Forecast, by End-user Industry 2020 & 2033
- Table 66: Global Recovered Carbon Black Market Volume K Tons Forecast, by End-user Industry 2020 & 2033
- Table 67: Global Recovered Carbon Black Market Revenue billion Forecast, by Country 2020 & 2033
- Table 68: Global Recovered Carbon Black Market Volume K Tons Forecast, by Country 2020 & 2033
- Table 69: Saudi Arabia Recovered Carbon Black Market Revenue (billion) Forecast, by Application 2020 & 2033
- Table 70: Saudi Arabia Recovered Carbon Black Market Volume (K Tons) Forecast, by Application 2020 & 2033
- Table 71: South Africa Recovered Carbon Black Market Revenue (billion) Forecast, by Application 2020 & 2033
- Table 72: South Africa Recovered Carbon Black Market Volume (K Tons) Forecast, by Application 2020 & 2033
- Table 73: Rest of Middle East and Africa Recovered Carbon Black Market Revenue (billion) Forecast, by Application 2020 & 2033
- Table 74: Rest of Middle East and Africa Recovered Carbon Black Market Volume (K Tons) Forecast, by Application 2020 & 2033
Frequently Asked Questions
1. What is the projected Compound Annual Growth Rate (CAGR) of the Recovered Carbon Black Market?
The projected CAGR is approximately 4.8%.
2. Which companies are prominent players in the Recovered Carbon Black Market?
Key companies in the market include Enrestec Inc, Strebl Green Carbon Pte Ltd, Black Bear Carbon B V, Dron Industries, Pyrum Innovations AG, Carbon Recovery GmbH, DVA Renewable Energy JSC, SR2O Holdings LLC, Klean Industries Inc, Polimix, Delta Energy LLC, Reoil Sp z o o, Bolder Industries, Scandinavian Enviro Systems AB, Alpha Carbone.
3. What are the main segments of the Recovered Carbon Black Market?
The market segments include Application, End-user Industry.
4. Can you provide details about the market size?
The market size is estimated to be USD 14.5 billion as of 2022.
5. What are some drivers contributing to market growth?
Rising Demand for Recycled and Recovered Products; Increasing Usages as Sustainable Filler in Tire and Non-tire Rubber Applications.
6. What are the notable trends driving market growth?
Increasing Usage in the Tire Industry.
7. Are there any restraints impacting market growth?
Lack of Infrastructure and Technologies for Recovered Carbon Black; Providing Consistent Quality of Recovered Carbon Black.
8. Can you provide examples of recent developments in the market?
In May 2022, Pyrum Innovations AG started the test operation of a new pelletizer at its plant site in Germany, which will enable the recovered carbon black (rCB) obtained via the pyrolysis process to be bonded into pellets, to increase their transportability and facilitates the further processing of the raw material.
9. What pricing options are available for accessing the report?
Pricing options include single-user, multi-user, and enterprise licenses priced at USD 4750, USD 5250, and USD 8750 respectively.
10. Is the market size provided in terms of value or volume?
The market size is provided in terms of value, measured in billion and volume, measured in K Tons.
11. Are there any specific market keywords associated with the report?
Yes, the market keyword associated with the report is "Recovered Carbon Black Market," which aids in identifying and referencing the specific market segment covered.
12. How do I determine which pricing option suits my needs best?
The pricing options vary based on user requirements and access needs. Individual users may opt for single-user licenses, while businesses requiring broader access may choose multi-user or enterprise licenses for cost-effective access to the report.
13. Are there any additional resources or data provided in the Recovered Carbon Black Market report?
While the report offers comprehensive insights, it's advisable to review the specific contents or supplementary materials provided to ascertain if additional resources or data are available.
14. How can I stay updated on further developments or reports in the Recovered Carbon Black Market?
To stay informed about further developments, trends, and reports in the Recovered Carbon Black Market, consider subscribing to industry newsletters, following relevant companies and organizations, or regularly checking reputable industry news sources and publications.
Methodology
Step 1 - Identification of Relevant Samples Size from Population Database


Step 2 - Approaches for Defining Global Market Size (Value, Volume* & Price*)

Note*: In applicable scenarios
Step 3 - Data Sources
Primary Research
- Web Analytics
- Survey Reports
- Research Institute
- Latest Research Reports
- Opinion Leaders
Secondary Research
- Annual Reports
- White Paper
- Latest Press Release
- Industry Association
- Paid Database
- Investor Presentations

Step 4 - Data Triangulation
Involves using different sources of information in order to increase the validity of a study
These sources are likely to be stakeholders in a program - participants, other researchers, program staff, other community members, and so on.
Then we put all data in single framework & apply various statistical tools to find out the dynamic on the market.
During the analysis stage, feedback from the stakeholder groups would be compared to determine areas of agreement as well as areas of divergence

