

Key Insights
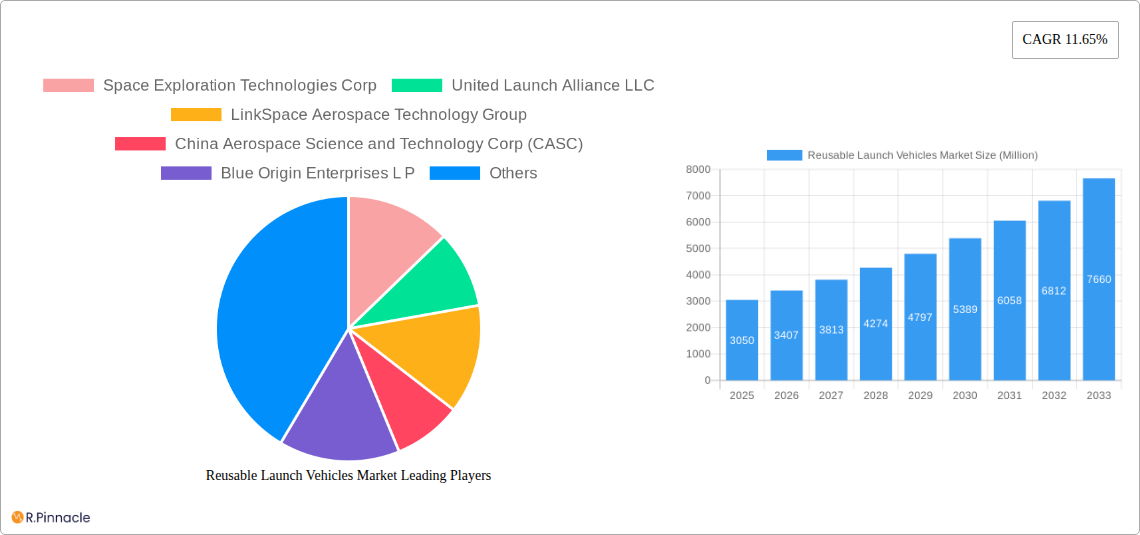
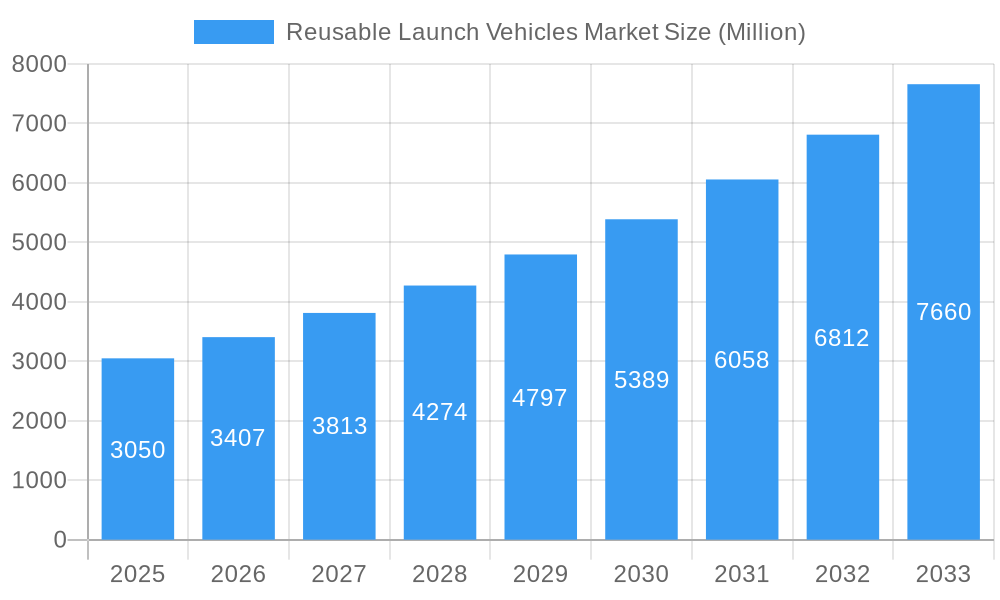
The Reusable Launch Vehicle (RLV) market is experiencing robust growth, projected to reach $3.05 billion in 2025 and exhibiting a Compound Annual Growth Rate (CAGR) of 11.65% from 2025 to 2033. This expansion is driven by several key factors. Firstly, the increasing demand for space-based services, including satellite constellations for communication, earth observation, and navigation, necessitates more frequent and cost-effective launches. RLVs offer a significant cost advantage over expendable launch systems by enabling reuse of major components, thereby reducing launch costs considerably. Secondly, advancements in materials science and propulsion technology are leading to the development of more reliable and efficient RLVs, further boosting market adoption. Competition among major players like SpaceX, Blue Origin, and government agencies such as NASA and ISRO is fostering innovation and driving down prices. Finally, growing private sector investment in space exploration and commercialization is fueling the demand for affordable and readily available launch capabilities.
Reusable Launch Vehicles Market Market Size (In Billion)
Market segmentation reveals a dynamic landscape. Partially reusable systems are currently dominant, but the market is witnessing a gradual shift towards fully reusable systems, offering greater cost reductions in the long run. In terms of configuration, single-stage-to-orbit (SSTO) designs are still under development, while multi-stage-to-orbit (MSTO) systems are more prevalent currently due to their proven technological maturity. Geographically, North America and Asia Pacific are expected to hold significant market share, driven by strong government support, substantial private sector involvement, and a large pool of technological expertise. However, Europe and other regions are increasingly participating, leading to a more globally diversified market. While regulatory hurdles and the inherent technological complexities associated with RLV development pose some challenges, the long-term prospects for the RLV market remain incredibly promising.
Reusable Launch Vehicles Market Company Market Share
Reusable Launch Vehicles Market: A Comprehensive Report (2019-2033)
This in-depth report provides a comprehensive analysis of the Reusable Launch Vehicles market, offering invaluable insights for industry professionals, investors, and strategic decision-makers. Covering the period from 2019 to 2033, with a base year of 2025 and a forecast period of 2025-2033, this report unveils the market's structure, dynamics, key players, and future outlook. The study meticulously examines market segmentation by type (Partially Reusable, Fully Reusable) and configuration (Single-Stage, Multi-Stage), providing detailed analysis of growth projections and competitive landscapes. Expect granular data, including CAGR projections and market size estimations in Millions.
Reusable Launch Vehicles Market Market Structure & Innovation Trends
The Reusable Launch Vehicles market is characterized by a moderately concentrated structure, with key players like SpaceX and Blue Origin holding significant market share. However, emerging players and government agencies are actively challenging the established order, leading to a dynamic competitive landscape. Innovation is primarily driven by the need for reduced launch costs and increased mission frequency, fostering advancements in propulsion systems, materials science, and reusable vehicle design. Regulatory frameworks, while evolving, play a crucial role in shaping market access and safety standards. Product substitutes, such as traditional expendable launch vehicles, still hold a significant position, but their competitiveness is being eroded by the cost advantages offered by reusable systems.
- Market Concentration: SpaceX and Blue Origin hold approximately xx% and xx% of the market share respectively in 2025, while other players like United Launch Alliance and CASC hold smaller yet significant shares.
- Innovation Drivers: Reduced launch costs, increased launch frequency, advancements in reusable rocket technology, and government initiatives.
- M&A Activity: The market has witnessed several strategic mergers and acquisitions (M&A) deals totaling an estimated xx Million in the period 2019-2024. Further consolidation is anticipated as companies seek to scale operations and secure access to technology and resources.
- End-User Demographics: The primary end-users are government space agencies (like NASA and ISRO), commercial satellite operators, and emerging private space companies.
Reusable Launch Vehicles Market Market Dynamics & Trends
The Reusable Launch Vehicles market is experiencing significant growth, driven by increasing demand for space-based services, technological advancements reducing launch costs, and the growing commercialization of space. The CAGR from 2025-2033 is projected at xx%, fueled by factors such as the expanding satellite constellation market and the emergence of new space-based applications. Technological disruptions, including the development of advanced propulsion systems and reusable landing technologies, are continuously transforming market dynamics. Consumer preferences are shifting towards cost-effective and reliable launch services, further driving demand for reusable launch vehicles. Competitive dynamics are characterized by intense competition among established players and emerging entrants, leading to strategic partnerships and technological innovations. Market penetration of reusable launch vehicles is expected to reach xx% by 2033, replacing a significant proportion of traditional expendable launch vehicles.
Dominant Regions & Segments in Reusable Launch Vehicles Market
North America currently dominates the Reusable Launch Vehicles market, largely due to the presence of major players such as SpaceX and Blue Origin, coupled with robust government support and a developed aerospace infrastructure. However, other regions such as Europe, Asia-Pacific, and China are rapidly gaining traction.
- Key Drivers of North American Dominance: Presence of key players like SpaceX and Blue Origin, substantial government funding (NASA), well-established aerospace infrastructure.
- Key Drivers of Growth in other regions: Increased government investments in space programs in countries like China and India, growing commercial space activities, the development of indigenous reusable launch vehicle technologies.
Dominant Segments: The fully reusable segment is projected to witness the highest growth rate due to cost effectiveness and superior efficiency, while the multi-stage configuration is likely to dominate due to its ability to handle heavier payloads.
Reusable Launch Vehicles Market Product Innovations
Recent product innovations focus on enhancing reusability through improvements in thermal protection systems, engine design, and landing technologies. This is leading to more reliable, cost-effective, and frequent launch capabilities, opening up new applications and business models. Market fit is strongly influenced by factors such as payload capacity, cost per launch, and mission reliability. Companies are actively developing next-generation reusable launch vehicles with increased payload capacity and reduced launch costs.
Report Scope & Segmentation Analysis
This report segments the Reusable Launch Vehicles market based on type (Partially Reusable, Fully Reusable) and configuration (Single-Stage, Multi-Stage).
- Partially Reusable: This segment includes vehicles where only some components are reused, offering a balance between cost and complexity. It's projected to reach xx Million by 2033. Competition is moderate.
- Fully Reusable: This segment comprises vehicles designed for complete reusability, offering significant cost savings. The market size is projected to reach xx Million by 2033. This segment witnesses the most intense competition.
- Single-Stage: This configuration simplifies design and operations but typically limits payload capacity. Expected market size in 2033 is xx Million.
- Multi-Stage: This configuration allows for higher payload capacities but increases complexity. The market size in 2033 is projected to be xx Million. It faces intense competition.
Key Drivers of Reusable Launch Vehicles Market Growth
Several factors drive the growth of the Reusable Launch Vehicles market, including:
- Technological advancements: Improvements in propulsion systems, materials science, and autonomous landing technologies are significantly lowering launch costs.
- Economic factors: The decreasing cost per launch makes space access more affordable, expanding the market for various applications.
- Regulatory support: Government policies encouraging private sector involvement in space exploration are stimulating market expansion.
Challenges in the Reusable Launch Vehicles Market Sector
The Reusable Launch Vehicles market faces challenges such as:
- High initial investment costs: Developing reusable launch vehicles requires substantial upfront investment, limiting entry for smaller companies.
- Technological complexities: Mastering the technologies for reusability is complex and requires significant research and development efforts.
- Regulatory hurdles: Navigating the evolving regulatory landscape for space launches presents difficulties.
Emerging Opportunities in Reusable Launch Vehicles Market
Emerging opportunities include:
- New markets: The increasing demand for smallsat launches and in-space servicing presents new avenues for growth.
- Technological advancements: Developments in hypersonic flight and reusable spaceplanes offer vast potential.
- Point-to-point travel: The future may see reusable launch vehicles used for rapid point-to-point transportation.
Leading Players in the Reusable Launch Vehicles Market Market
- Space Exploration Technologies Corp
- United Launch Alliance LLC
- LinkSpace Aerospace Technology Group
- China Aerospace Science and Technology Corp (CASC)
- Blue Origin Enterprises L P
- ArianeGroup
- Deutsches Zentrum für Luft- und Raumfahrt e V (DLR)
- Indian Space Research Organisation (ISRO)
- National Aeronautics and Space Administration (NASA)
Key Developments in Reusable Launch Vehicles Market Industry
- 2023: SpaceX successfully launched and landed its Starship prototype multiple times.
- 2022: Blue Origin conducted several suborbital flights with its New Shepard vehicle.
- 2021: United Launch Alliance announced a new strategy for reusable launch vehicle development.
Future Outlook for Reusable Launch Vehicles Market Market
The Reusable Launch Vehicles market is poised for significant growth in the coming years, driven by continued technological advancements, decreasing launch costs, and the increasing demand for space-based services. Strategic partnerships and collaborations between private companies and government agencies will further accelerate market expansion. The development of next-generation reusable launch vehicles with enhanced capabilities and improved efficiency will unlock new opportunities and shape the future of space exploration.
Reusable Launch Vehicles Market Segmentation
-
1. Type
- 1.1. Partially Reusable
- 1.2. Fully Reusable
-
2. Configuration
- 2.1. Single-Stage
- 2.2. Multi-Stage
Reusable Launch Vehicles Market Segmentation By Geography
-
1. North America
- 1.1. North America
- 1.2. Canada
-
2. Europe
- 2.1. United Kingdom
- 2.2. Germany
- 2.3. France
- 2.4. Italy
- 2.5. Russia
- 2.6. Rest of Europe
-
3. Asia Pacific
- 3.1. China
- 3.2. India
- 3.3. Japan
- 3.4. South Korea
- 3.5. Rest of Asia Pacific
-
4. Latin America
- 4.1. Brazil
- 4.2. Mexico
- 4.3. Rest of Latin America
-
5. Middle East and Africa
- 5.1. Saudi Arabia
- 5.2. United Arab Emirates
- 5.3. Israel
- 5.4. South Africa
- 5.5. Rest of Middle East and Africa
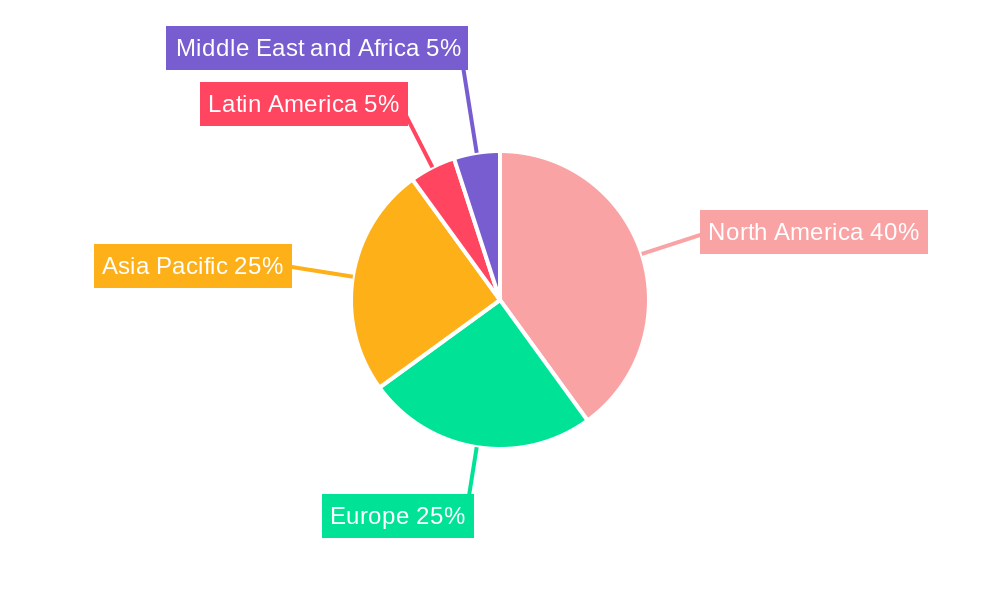
Reusable Launch Vehicles Market Regional Market Share
Geographic Coverage of Reusable Launch Vehicles Market
Reusable Launch Vehicles Market REPORT HIGHLIGHTS
| Aspects | Details |
|---|---|
| Study Period | 2020-2034 |
| Base Year | 2025 |
| Estimated Year | 2026 |
| Forecast Period | 2026-2034 |
| Historical Period | 2020-2025 |
| Growth Rate | CAGR of 11.65% from 2020-2034 |
| Segmentation |
|
Table of Contents
- 1. Introduction
- 1.1. Research Scope
- 1.2. Market Segmentation
- 1.3. Research Objective
- 1.4. Definitions and Assumptions
- 2. Executive Summary
- 2.1. Market Snapshot
- 3. Market Dynamics
- 3.1. Market Drivers
- 3.2. Market Restrains
- 3.3. Market Trends
- 3.4. Market Opportunities
- 4. Market Factor Analysis
- 4.1. Porters Five Forces
- 4.1.1. Bargaining Power of Suppliers
- 4.1.2. Bargaining Power of Buyers
- 4.1.3. Threat of New Entrants
- 4.1.4. Threat of Substitutes
- 4.1.5. Competitive Rivalry
- 4.2. PESTEL analysis
- 4.3. BCG Analysis
- 4.3.1. Stars (High Growth, High Market Share)
- 4.3.2. Cash Cows (Low Growth, High Market Share)
- 4.3.3. Question Mark (High Growth, Low Market Share)
- 4.3.4. Dogs (Low Growth, Low Market Share)
- 4.4. Ansoff Matrix Analysis
- 4.5. Supply Chain Analysis
- 4.6. Regulatory Landscape
- 4.7. Current Market Potential and Opportunity Assessment (TAM–SAM–SOM Framework)
- 4.8. PRI Analyst Note
- 4.1. Porters Five Forces
- 5. Market Analysis, Insights and Forecast 2021-2033
- 5.1. Market Analysis, Insights and Forecast - by Type
- 5.1.1. Partially Reusable
- 5.1.2. Fully Reusable
- 5.2. Market Analysis, Insights and Forecast - by Configuration
- 5.2.1. Single-Stage
- 5.2.2. Multi-Stage
- 5.3. Market Analysis, Insights and Forecast - by Region
- 5.3.1. North America
- 5.3.2. Europe
- 5.3.3. Asia Pacific
- 5.3.4. Latin America
- 5.3.5. Middle East and Africa
- 5.1. Market Analysis, Insights and Forecast - by Type
- 6. Global Reusable Launch Vehicles Market Analysis, Insights and Forecast, 2021-2033
- 6.1. Market Analysis, Insights and Forecast - by Type
- 6.1.1. Partially Reusable
- 6.1.2. Fully Reusable
- 6.2. Market Analysis, Insights and Forecast - by Configuration
- 6.2.1. Single-Stage
- 6.2.2. Multi-Stage
- 6.1. Market Analysis, Insights and Forecast - by Type
- 7. North America Reusable Launch Vehicles Market Analysis, Insights and Forecast, 2020-2032
- 7.1. Market Analysis, Insights and Forecast - by Type
- 7.1.1. Partially Reusable
- 7.1.2. Fully Reusable
- 7.2. Market Analysis, Insights and Forecast - by Configuration
- 7.2.1. Single-Stage
- 7.2.2. Multi-Stage
- 7.1. Market Analysis, Insights and Forecast - by Type
- 8. Europe Reusable Launch Vehicles Market Analysis, Insights and Forecast, 2020-2032
- 8.1. Market Analysis, Insights and Forecast - by Type
- 8.1.1. Partially Reusable
- 8.1.2. Fully Reusable
- 8.2. Market Analysis, Insights and Forecast - by Configuration
- 8.2.1. Single-Stage
- 8.2.2. Multi-Stage
- 8.1. Market Analysis, Insights and Forecast - by Type
- 9. Asia Pacific Reusable Launch Vehicles Market Analysis, Insights and Forecast, 2020-2032
- 9.1. Market Analysis, Insights and Forecast - by Type
- 9.1.1. Partially Reusable
- 9.1.2. Fully Reusable
- 9.2. Market Analysis, Insights and Forecast - by Configuration
- 9.2.1. Single-Stage
- 9.2.2. Multi-Stage
- 9.1. Market Analysis, Insights and Forecast - by Type
- 10. Latin America Reusable Launch Vehicles Market Analysis, Insights and Forecast, 2020-2032
- 10.1. Market Analysis, Insights and Forecast - by Type
- 10.1.1. Partially Reusable
- 10.1.2. Fully Reusable
- 10.2. Market Analysis, Insights and Forecast - by Configuration
- 10.2.1. Single-Stage
- 10.2.2. Multi-Stage
- 10.1. Market Analysis, Insights and Forecast - by Type
- 11. Middle East and Africa Reusable Launch Vehicles Market Analysis, Insights and Forecast, 2020-2032
- 11.1. Market Analysis, Insights and Forecast - by Type
- 11.1.1. Partially Reusable
- 11.1.2. Fully Reusable
- 11.2. Market Analysis, Insights and Forecast - by Configuration
- 11.2.1. Single-Stage
- 11.2.2. Multi-Stage
- 11.1. Market Analysis, Insights and Forecast - by Type
- 12. Competitive Analysis
- 12.1. Company Profiles
- 12.1.1 Space Exploration Technologies Corp
- 12.1.1.1. Company Overview
- 12.1.1.2. Products
- 12.1.1.3. Company Financials
- 12.1.1.4. SWOT Analysis
- 12.1.2 United Launch Alliance LLC
- 12.1.2.1. Company Overview
- 12.1.2.2. Products
- 12.1.2.3. Company Financials
- 12.1.2.4. SWOT Analysis
- 12.1.3 LinkSpace Aerospace Technology Group
- 12.1.3.1. Company Overview
- 12.1.3.2. Products
- 12.1.3.3. Company Financials
- 12.1.3.4. SWOT Analysis
- 12.1.4 China Aerospace Science and Technology Corp (CASC)
- 12.1.4.1. Company Overview
- 12.1.4.2. Products
- 12.1.4.3. Company Financials
- 12.1.4.4. SWOT Analysis
- 12.1.5 Blue Origin Enterprises L P
- 12.1.5.1. Company Overview
- 12.1.5.2. Products
- 12.1.5.3. Company Financials
- 12.1.5.4. SWOT Analysis
- 12.1.6 ArianeGroup
- 12.1.6.1. Company Overview
- 12.1.6.2. Products
- 12.1.6.3. Company Financials
- 12.1.6.4. SWOT Analysis
- 12.1.7 Deutsches Zentrum für Luft- und Raumfahrt e V (DLR
- 12.1.7.1. Company Overview
- 12.1.7.2. Products
- 12.1.7.3. Company Financials
- 12.1.7.4. SWOT Analysis
- 12.1.8 Indian Space Research Organisation (ISRO)
- 12.1.8.1. Company Overview
- 12.1.8.2. Products
- 12.1.8.3. Company Financials
- 12.1.8.4. SWOT Analysis
- 12.1.9 National Aeronautics and Space Administration (NASA)
- 12.1.9.1. Company Overview
- 12.1.9.2. Products
- 12.1.9.3. Company Financials
- 12.1.9.4. SWOT Analysis
- 12.1.1 Space Exploration Technologies Corp
- 12.2. Market Entropy
- 12.2.1 Company's Key Areas Served
- 12.2.2 Recent Developments
- 12.3. Company Market Share Analysis 2025
- 12.3.1 Top 5 Companies Market Share Analysis
- 12.3.2 Top 3 Companies Market Share Analysis
- 12.4. List of Potential Customers
- 13. Research Methodology
List of Figures
- Figure 1: Global Reusable Launch Vehicles Market Revenue Breakdown (Million, %) by Region 2025 & 2033
- Figure 2: North America Reusable Launch Vehicles Market Revenue (Million), by Type 2025 & 2033
- Figure 3: North America Reusable Launch Vehicles Market Revenue Share (%), by Type 2025 & 2033
- Figure 4: North America Reusable Launch Vehicles Market Revenue (Million), by Configuration 2025 & 2033
- Figure 5: North America Reusable Launch Vehicles Market Revenue Share (%), by Configuration 2025 & 2033
- Figure 6: North America Reusable Launch Vehicles Market Revenue (Million), by Country 2025 & 2033
- Figure 7: North America Reusable Launch Vehicles Market Revenue Share (%), by Country 2025 & 2033
- Figure 8: Europe Reusable Launch Vehicles Market Revenue (Million), by Type 2025 & 2033
- Figure 9: Europe Reusable Launch Vehicles Market Revenue Share (%), by Type 2025 & 2033
- Figure 10: Europe Reusable Launch Vehicles Market Revenue (Million), by Configuration 2025 & 2033
- Figure 11: Europe Reusable Launch Vehicles Market Revenue Share (%), by Configuration 2025 & 2033
- Figure 12: Europe Reusable Launch Vehicles Market Revenue (Million), by Country 2025 & 2033
- Figure 13: Europe Reusable Launch Vehicles Market Revenue Share (%), by Country 2025 & 2033
- Figure 14: Asia Pacific Reusable Launch Vehicles Market Revenue (Million), by Type 2025 & 2033
- Figure 15: Asia Pacific Reusable Launch Vehicles Market Revenue Share (%), by Type 2025 & 2033
- Figure 16: Asia Pacific Reusable Launch Vehicles Market Revenue (Million), by Configuration 2025 & 2033
- Figure 17: Asia Pacific Reusable Launch Vehicles Market Revenue Share (%), by Configuration 2025 & 2033
- Figure 18: Asia Pacific Reusable Launch Vehicles Market Revenue (Million), by Country 2025 & 2033
- Figure 19: Asia Pacific Reusable Launch Vehicles Market Revenue Share (%), by Country 2025 & 2033
- Figure 20: Latin America Reusable Launch Vehicles Market Revenue (Million), by Type 2025 & 2033
- Figure 21: Latin America Reusable Launch Vehicles Market Revenue Share (%), by Type 2025 & 2033
- Figure 22: Latin America Reusable Launch Vehicles Market Revenue (Million), by Configuration 2025 & 2033
- Figure 23: Latin America Reusable Launch Vehicles Market Revenue Share (%), by Configuration 2025 & 2033
- Figure 24: Latin America Reusable Launch Vehicles Market Revenue (Million), by Country 2025 & 2033
- Figure 25: Latin America Reusable Launch Vehicles Market Revenue Share (%), by Country 2025 & 2033
- Figure 26: Middle East and Africa Reusable Launch Vehicles Market Revenue (Million), by Type 2025 & 2033
- Figure 27: Middle East and Africa Reusable Launch Vehicles Market Revenue Share (%), by Type 2025 & 2033
- Figure 28: Middle East and Africa Reusable Launch Vehicles Market Revenue (Million), by Configuration 2025 & 2033
- Figure 29: Middle East and Africa Reusable Launch Vehicles Market Revenue Share (%), by Configuration 2025 & 2033
- Figure 30: Middle East and Africa Reusable Launch Vehicles Market Revenue (Million), by Country 2025 & 2033
- Figure 31: Middle East and Africa Reusable Launch Vehicles Market Revenue Share (%), by Country 2025 & 2033
List of Tables
- Table 1: Global Reusable Launch Vehicles Market Revenue Million Forecast, by Type 2020 & 2033
- Table 2: Global Reusable Launch Vehicles Market Revenue Million Forecast, by Configuration 2020 & 2033
- Table 3: Global Reusable Launch Vehicles Market Revenue Million Forecast, by Region 2020 & 2033
- Table 4: Global Reusable Launch Vehicles Market Revenue Million Forecast, by Type 2020 & 2033
- Table 5: Global Reusable Launch Vehicles Market Revenue Million Forecast, by Configuration 2020 & 2033
- Table 6: Global Reusable Launch Vehicles Market Revenue Million Forecast, by Country 2020 & 2033
- Table 7: North America Reusable Launch Vehicles Market Revenue (Million) Forecast, by Application 2020 & 2033
- Table 8: Canada Reusable Launch Vehicles Market Revenue (Million) Forecast, by Application 2020 & 2033
- Table 9: Global Reusable Launch Vehicles Market Revenue Million Forecast, by Type 2020 & 2033
- Table 10: Global Reusable Launch Vehicles Market Revenue Million Forecast, by Configuration 2020 & 2033
- Table 11: Global Reusable Launch Vehicles Market Revenue Million Forecast, by Country 2020 & 2033
- Table 12: United Kingdom Reusable Launch Vehicles Market Revenue (Million) Forecast, by Application 2020 & 2033
- Table 13: Germany Reusable Launch Vehicles Market Revenue (Million) Forecast, by Application 2020 & 2033
- Table 14: France Reusable Launch Vehicles Market Revenue (Million) Forecast, by Application 2020 & 2033
- Table 15: Italy Reusable Launch Vehicles Market Revenue (Million) Forecast, by Application 2020 & 2033
- Table 16: Russia Reusable Launch Vehicles Market Revenue (Million) Forecast, by Application 2020 & 2033
- Table 17: Rest of Europe Reusable Launch Vehicles Market Revenue (Million) Forecast, by Application 2020 & 2033
- Table 18: Global Reusable Launch Vehicles Market Revenue Million Forecast, by Type 2020 & 2033
- Table 19: Global Reusable Launch Vehicles Market Revenue Million Forecast, by Configuration 2020 & 2033
- Table 20: Global Reusable Launch Vehicles Market Revenue Million Forecast, by Country 2020 & 2033
- Table 21: China Reusable Launch Vehicles Market Revenue (Million) Forecast, by Application 2020 & 2033
- Table 22: India Reusable Launch Vehicles Market Revenue (Million) Forecast, by Application 2020 & 2033
- Table 23: Japan Reusable Launch Vehicles Market Revenue (Million) Forecast, by Application 2020 & 2033
- Table 24: South Korea Reusable Launch Vehicles Market Revenue (Million) Forecast, by Application 2020 & 2033
- Table 25: Rest of Asia Pacific Reusable Launch Vehicles Market Revenue (Million) Forecast, by Application 2020 & 2033
- Table 26: Global Reusable Launch Vehicles Market Revenue Million Forecast, by Type 2020 & 2033
- Table 27: Global Reusable Launch Vehicles Market Revenue Million Forecast, by Configuration 2020 & 2033
- Table 28: Global Reusable Launch Vehicles Market Revenue Million Forecast, by Country 2020 & 2033
- Table 29: Brazil Reusable Launch Vehicles Market Revenue (Million) Forecast, by Application 2020 & 2033
- Table 30: Mexico Reusable Launch Vehicles Market Revenue (Million) Forecast, by Application 2020 & 2033
- Table 31: Rest of Latin America Reusable Launch Vehicles Market Revenue (Million) Forecast, by Application 2020 & 2033
- Table 32: Global Reusable Launch Vehicles Market Revenue Million Forecast, by Type 2020 & 2033
- Table 33: Global Reusable Launch Vehicles Market Revenue Million Forecast, by Configuration 2020 & 2033
- Table 34: Global Reusable Launch Vehicles Market Revenue Million Forecast, by Country 2020 & 2033
- Table 35: Saudi Arabia Reusable Launch Vehicles Market Revenue (Million) Forecast, by Application 2020 & 2033
- Table 36: United Arab Emirates Reusable Launch Vehicles Market Revenue (Million) Forecast, by Application 2020 & 2033
- Table 37: Israel Reusable Launch Vehicles Market Revenue (Million) Forecast, by Application 2020 & 2033
- Table 38: South Africa Reusable Launch Vehicles Market Revenue (Million) Forecast, by Application 2020 & 2033
- Table 39: Rest of Middle East and Africa Reusable Launch Vehicles Market Revenue (Million) Forecast, by Application 2020 & 2033
Frequently Asked Questions
1. What is the projected Compound Annual Growth Rate (CAGR) of the Reusable Launch Vehicles Market?
The projected CAGR is approximately 11.65%.
2. Which companies are prominent players in the Reusable Launch Vehicles Market?
Key companies in the market include Space Exploration Technologies Corp, United Launch Alliance LLC, LinkSpace Aerospace Technology Group, China Aerospace Science and Technology Corp (CASC), Blue Origin Enterprises L P, ArianeGroup, Deutsches Zentrum für Luft- und Raumfahrt e V (DLR, Indian Space Research Organisation (ISRO), National Aeronautics and Space Administration (NASA).
3. What are the main segments of the Reusable Launch Vehicles Market?
The market segments include Type, Configuration.
4. Can you provide details about the market size?
The market size is estimated to be USD 3.05 Million as of 2022.
5. What are some drivers contributing to market growth?
N/A
6. What are the notable trends driving market growth?
Fully Reusable Launch Vehicles to hold the Largest Market Share in 2023.
7. Are there any restraints impacting market growth?
N/A
8. Can you provide examples of recent developments in the market?
N/A
9. What pricing options are available for accessing the report?
Pricing options include single-user, multi-user, and enterprise licenses priced at USD 4750, USD 5250, and USD 8750 respectively.
10. Is the market size provided in terms of value or volume?
The market size is provided in terms of value, measured in Million.
11. Are there any specific market keywords associated with the report?
Yes, the market keyword associated with the report is "Reusable Launch Vehicles Market," which aids in identifying and referencing the specific market segment covered.
12. How do I determine which pricing option suits my needs best?
The pricing options vary based on user requirements and access needs. Individual users may opt for single-user licenses, while businesses requiring broader access may choose multi-user or enterprise licenses for cost-effective access to the report.
13. Are there any additional resources or data provided in the Reusable Launch Vehicles Market report?
While the report offers comprehensive insights, it's advisable to review the specific contents or supplementary materials provided to ascertain if additional resources or data are available.
14. How can I stay updated on further developments or reports in the Reusable Launch Vehicles Market?
To stay informed about further developments, trends, and reports in the Reusable Launch Vehicles Market, consider subscribing to industry newsletters, following relevant companies and organizations, or regularly checking reputable industry news sources and publications.
Methodology
Step 1 - Identification of Relevant Samples Size from Population Database


Step 2 - Approaches for Defining Global Market Size (Value, Volume* & Price*)

Note*: In applicable scenarios
Step 3 - Data Sources
Primary Research
- Web Analytics
- Survey Reports
- Research Institute
- Latest Research Reports
- Opinion Leaders
Secondary Research
- Annual Reports
- White Paper
- Latest Press Release
- Industry Association
- Paid Database
- Investor Presentations

Step 4 - Data Triangulation
Involves using different sources of information in order to increase the validity of a study
These sources are likely to be stakeholders in a program - participants, other researchers, program staff, other community members, and so on.
Then we put all data in single framework & apply various statistical tools to find out the dynamic on the market.
During the analysis stage, feedback from the stakeholder groups would be compared to determine areas of agreement as well as areas of divergence