

Key Insights
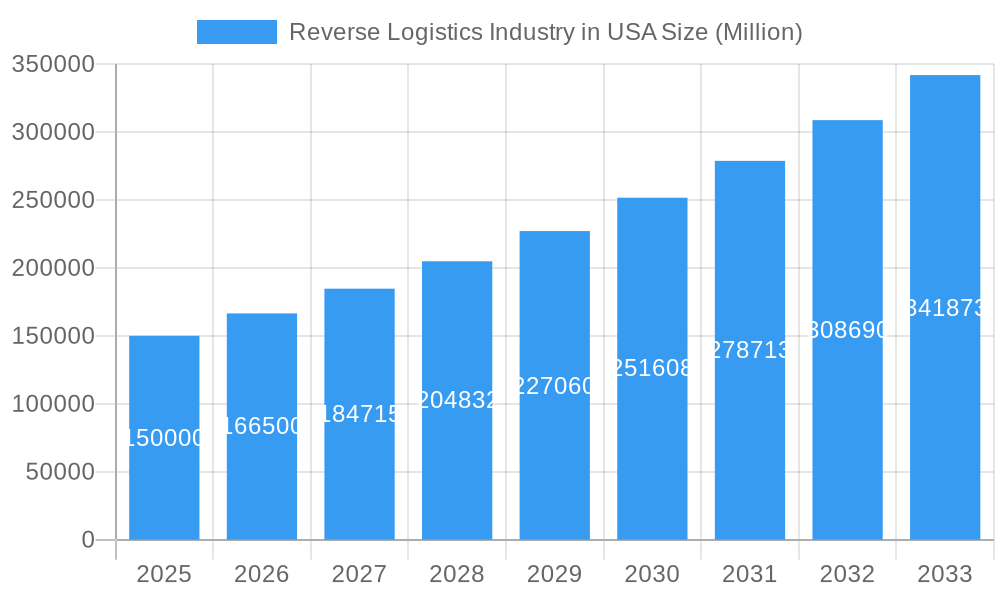
The US reverse logistics market, encompassing the processes of returning, repairing, and reselling goods, is experiencing robust growth, fueled by the expanding e-commerce sector and increasing consumer expectations for convenient returns. The market, valued at approximately $150 billion in 2025, is projected to maintain a Compound Annual Growth Rate (CAGR) exceeding 11% through 2033. Key drivers include the rise of online shopping, stricter environmental regulations promoting product reuse and recycling, and the growing adoption of sustainable business practices by companies. E-commerce, consumer electronics, and apparel sectors significantly contribute to this market's growth, demanding efficient return processing, warehousing, and refurbishment services. Transportation and warehousing constitute major functional segments within the reverse logistics chain, alongside value-added services like return processing, restocking, and product refurbishment. Competition is intense, with established players like FedEx, UPS, and DHL alongside specialized companies like Happy Returns and Optoro vying for market share. Regional variations exist, reflecting differences in e-commerce penetration and industrial activity across the Northeast, Southeast, Midwest, Southwest, and West. The increasing emphasis on sustainability is further driving innovation within the sector, leading to the development of more efficient and environmentally friendly solutions for managing returns. This includes advancements in technology for tracking and managing returns, optimizing warehousing and transportation, and facilitating the refurbishment and resale of returned products.
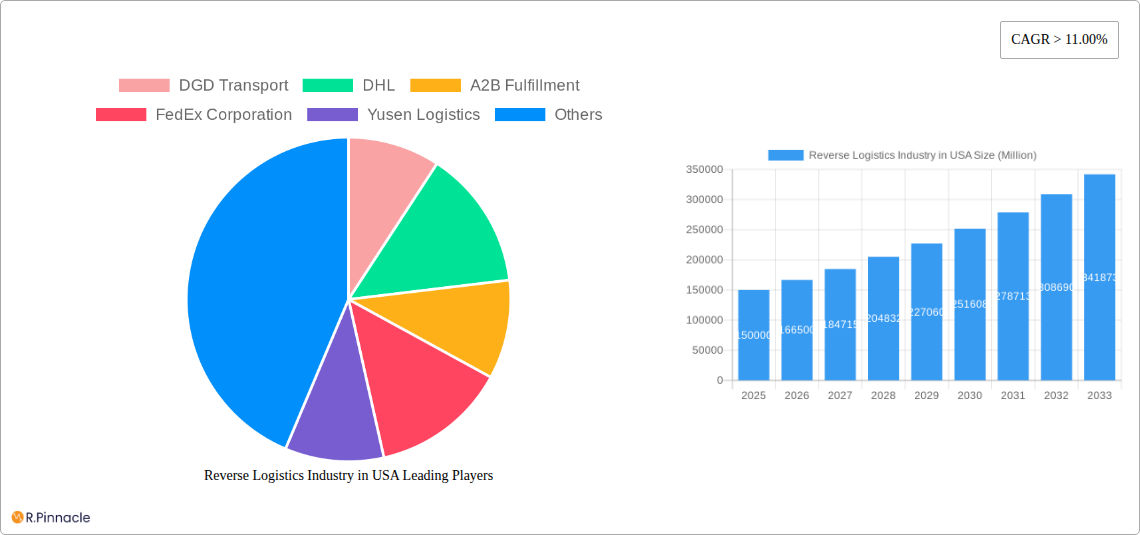
Reverse Logistics Industry in USA Market Size (In Billion)
The significant growth in the US reverse logistics market is indicative of a broader shift towards circular economy models. Companies are increasingly recognizing the financial and environmental benefits of managing returns efficiently. This translates to a demand for sophisticated reverse logistics solutions that cater to the specific needs of various industries. Challenges remain, including managing the increasing volume of returns, optimizing transportation networks, and ensuring compliance with environmental regulations. However, the continued growth of e-commerce and the evolving consumer landscape suggest a bright future for this dynamic and expanding sector, with significant opportunities for companies capable of providing innovative and efficient solutions.
Reverse Logistics Industry in USA Company Market Share
Reverse Logistics Industry in the USA: A Comprehensive Market Report (2019-2033)
This in-depth report provides a comprehensive analysis of the Reverse Logistics industry in the USA, covering market size, growth drivers, key players, and future trends. The study period spans from 2019 to 2033, with a base year of 2025 and a forecast period from 2025 to 2033. This report is invaluable for industry professionals, investors, and anyone seeking a detailed understanding of this dynamic sector. The market is projected to reach xx Million by 2033, exhibiting a strong CAGR of xx% during the forecast period.
Reverse Logistics Industry in USA Market Structure & Innovation Trends
The US reverse logistics market is characterized by a moderately concentrated structure, with a few large players holding significant market share. DHL, FedEx Corporation, and United Parcel Service (UPS) dominate the transportation segment, while companies like Optoro and Happy Returns specialize in returns processing and related value-added services. The market share of the top 5 players is estimated at xx%, reflecting both the scale of operations and the strategic acquisitions in the sector. The past five years have witnessed significant M&A activity, with deal values exceeding xx Million in total. Key drivers for innovation include growing e-commerce returns, increasing sustainability concerns, and the need for efficient and cost-effective return management solutions. Regulatory frameworks, such as those related to waste management and environmental protection, are also shaping the industry landscape. Product substitutes, such as improved packaging and product design aimed at reducing returns, are emerging as competitive forces. The end-user demographics are shifting towards a more digitally savvy and demanding customer base, driving innovation in technology and service offerings.
- Market Concentration: Top 5 players hold xx% market share (estimated).
- M&A Activity: Total deal value exceeding xx Million in 2019-2024.
- Key Innovation Drivers: E-commerce returns, sustainability, efficient return management.
Reverse Logistics Industry in USA Market Dynamics & Trends
The US reverse logistics market is experiencing robust growth driven by several key factors. The explosive growth of e-commerce, particularly in consumer electronics and apparel, significantly increases return volumes. Simultaneously, heightened consumer expectations regarding return policies and convenience are pushing companies to invest in sophisticated reverse logistics infrastructure. Technological advancements, particularly in areas like AI-powered return prediction and automation in warehousing and transportation, are improving efficiency and reducing costs. This is leading to increased market penetration of technology-driven solutions. However, competitive dynamics are intense, with established players facing challenges from emerging technology providers and specialized return management companies. The increasing adoption of sustainable practices in reverse logistics is further driving market expansion, with companies prioritizing responsible waste management and circular economy strategies. The overall market is expected to achieve a CAGR of xx% during the forecast period (2025-2033). This is largely driven by the continued rise of e-commerce, and the growing adoption of innovative reverse logistics technologies and services.
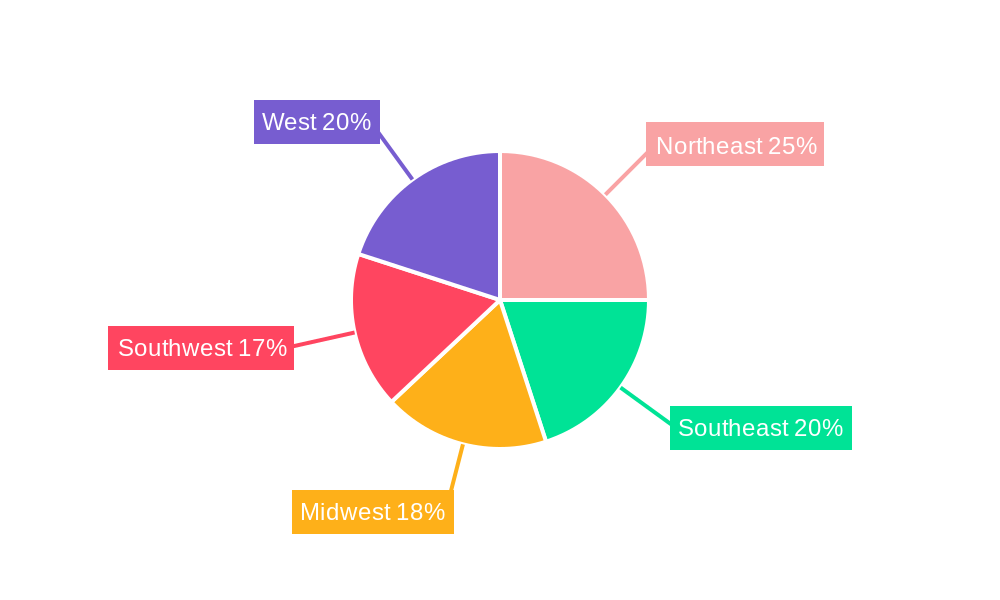
Dominant Regions & Segments in Reverse Logistics Industry in USA
The Consumer and Retail segment, particularly e-commerce, dominates the US reverse logistics market, accounting for xx% of total revenue in 2025. This segment is experiencing the fastest growth, fueled by increasing online shopping and liberal return policies. The Northeast and West Coast regions represent the most significant markets due to high population density and concentration of e-commerce businesses.
Key Drivers:
- High e-commerce penetration in consumer goods.
- Developed infrastructure and logistics networks.
- Stringent environmental regulations promoting sustainable practices.
Dominant Segments:
- By End User: Consumer and Retail (E-commerce, Consumer Electronics, Apparel)
- By Function: Transportation and Warehousing (Storage, Distribution)
The detailed dominance analysis reveals that while all segments are growing, the Consumer and Retail sector, particularly e-commerce, is far outpacing others in terms of revenue generation and growth projection. Strong infrastructure combined with the aforementioned trends contributes to this dominance.
Reverse Logistics Industry in USA Product Innovations
The landscape of product innovations within the US reverse logistics industry is rapidly evolving, driven by an imperative for enhanced operational efficiency, heightened sustainability, and superior customer experience. Cutting-edge automated sorting systems are now employing advanced robotics and AI-powered vision systems to rapidly and accurately categorize returned items, significantly reducing manual labor and processing times. Furthermore, the sophistication of tracking and tracing technologies has reached new heights, with IoT devices and real-time data analytics providing unparalleled visibility into the journey of returned products from the point of origin to their final disposition. Robust software platforms are now serving as the central nervous system of reverse logistics operations, offering end-to-end management capabilities that encompass return authorization, disposition management, and inventory reconciliation. The strategic integration of Artificial Intelligence (AI) and Machine Learning (ML) is revolutionizing predictive analytics for return volumes, optimizing refurbishment processes with intelligent diagnostics, and personalizing return experiences for consumers. These advancements are not merely incremental improvements; they represent a fundamental shift towards a more intelligent, agile, and cost-effective reverse logistics ecosystem, directly addressing the escalating demands of e-commerce growth and heightened consumer expectations for seamless and sustainable return solutions.
Report Scope & Segmentation Analysis
This comprehensive report meticulously segments the dynamic US reverse logistics market to provide deep insights into its structure and growth drivers. The analysis is bifurcated by key end-user industries, including the rapidly expanding Consumer & Retail sector, the intricate Automotive industry, the highly regulated Healthcare & Pharmaceuticals segment, and a consolidated category for Other Industrial and Other End Users. Complementing this, the report also dissects the market by core function: Transportation, encompassing the movement of goods; Warehousing, focusing on storage and inventory management; and a diverse array of Other Value-Added Services, such as refurbishment, repair, and remarketing. Each meticulously defined segment undergoes rigorous analysis, detailing its projected growth trajectory, current market size, and the intricate competitive dynamics at play. The Consumer & Retail segment, overwhelmingly influenced by the relentless expansion of e-commerce, is anticipated to lead the market in terms of growth rate. Concurrently, the Warehousing segment is poised for substantial expansion, fueled by the escalating requirement for efficient and technologically advanced storage and distribution solutions tailored for the unique demands of returned inventory. Competitive landscapes vary significantly across these segments; while some are characterized by intense, established competition, others present more specialized, niche market structures, offering distinct opportunities for targeted strategies.
Key Drivers of Reverse Logistics Industry in USA Growth
The growth of the US reverse logistics industry is driven by a confluence of factors: The booming e-commerce sector and its associated high return rates are the primary growth catalysts. Technological advancements like AI and automation are enhancing efficiency and reducing costs. Furthermore, increasing regulatory pressure on environmental sustainability is promoting innovative solutions for recycling and waste management in reverse logistics. These factors combined contribute to a strong growth trajectory for the industry.
Challenges in the Reverse Logistics Industry in USA Sector
The US reverse logistics industry grapples with a formidable array of challenges that impact operational efficiency and profitability. Prominently, the escalating costs associated with transportation, exacerbated by fluctuating fuel prices and an increasing volume of returns, present a significant hurdle. The inherent complexity of managing a vast diversity of product types, conditions, and origins in returns processes demands sophisticated operational strategies and specialized handling protocols. Furthermore, navigating the intricate web of regulatory compliance, particularly concerning responsible waste disposal and environmental mandates, adds another layer of complexity and potential cost. Disruptions within the broader supply chain, from manufacturing delays to logistical bottlenecks, inevitably spill over into reverse logistics, leading to increased costs, extended processing times, and a compromised ability to meet service level agreements. The perpetual tension between the imperative to maintain high customer service levels, which are critical in today's competitive market, and the relentless pressure of escalating operational costs creates a significant and ongoing challenge for businesses operating within this sector.
Emerging Opportunities in Reverse Logistics Industry in USA
The US reverse logistics industry is brimming with emerging opportunities, largely driven by a growing societal and corporate emphasis on sustainability, circular economy principles, and technological advancement. The surging demand for environmentally conscious and ethically managed reverse logistics solutions presents a substantial avenue for growth, as businesses increasingly seek partners who can demonstrate a commitment to reduce waste and maximize resource recovery. The integration of blockchain technology is poised to revolutionize transparency and traceability throughout the reverse supply chain, providing an immutable ledger for returned goods, enhancing trust, and mitigating fraud. Furthermore, the burgeoning circular economy model, which emphasizes repair, reuse, and remanufacturing, is creating entirely new markets and revenue streams for reverse logistics providers who can effectively manage these closed-loop systems. Expanding service offerings into specialized areas such as product lifecycle management, data security for returned electronics, and certified refurbishment provides significant potential for market differentiation and accelerated growth.
Leading Players in the Reverse Logistics Industry in USA Market
- DGD Transport
- DHL
- A2B Fulfillment
- FedEx Corporation
- Yusen Logistics
- United Parcel Service (UPS)
- YRC Worldwide Inc
- 7 COMPANY PROFILES
- C H Robinson Worldwide Inc
- XPO Logistics
- Excelsior Integrated LLC
- Happy Returns Inc
- American Distribution Inc
- FW Logistics
- Newgistics Inc
- United States Postal Service (USPS)
- Optoro
Key Developments in Reverse Logistics Industry in USA Industry
- 2022 Q3: DHL significantly bolstered its operational capabilities and service reach by expanding its dedicated reverse logistics network throughout the strategically important Southeast region of the United States.
- 2023 Q1: FedEx introduced a groundbreaking AI-powered return management system designed to optimize the processing of customer returns, enhance efficiency, and provide predictive insights into return volumes.
- 2024 Q2: UPS forged a strategic partnership with a leading sustainability technology company, aiming to significantly enhance its recycling practices and further its commitment to environmentally responsible reverse logistics operations. (Further significant developments and strategic initiatives will be comprehensively detailed in the final, in-depth report)
Future Outlook for Reverse Logistics Industry in USA Market
The future of the US reverse logistics industry is bright, fueled by ongoing e-commerce growth, technological innovation, and increasing focus on sustainability. Strategic investments in advanced technologies and a commitment to circular economy principles will be crucial for success. The market is poised for continued expansion, driven by increasing consumer demand and evolving industry practices.
Reverse Logistics Industry in USA Segmentation
-
1. Function
-
1.1. Transportation
- 1.1.1. Road
- 1.1.2. Air
- 1.1.3. Other Modes of Transportation
- 1.2. Warehous
- 1.3. Other Va
-
1.1. Transportation
-
2. End User
- 2.1. Consumer
- 2.2. Automotive
- 2.3. Healthcare and Pharmaceuticals
- 2.4. Other Industrial Activity Sectors
- 2.5. Other End Users
Reverse Logistics Industry in USA Segmentation By Geography
-
1. North America
- 1.1. United States
- 1.2. Canada
- 1.3. Mexico
-
2. South America
- 2.1. Brazil
- 2.2. Argentina
- 2.3. Rest of South America
-
3. Europe
- 3.1. United Kingdom
- 3.2. Germany
- 3.3. France
- 3.4. Italy
- 3.5. Spain
- 3.6. Russia
- 3.7. Benelux
- 3.8. Nordics
- 3.9. Rest of Europe
-
4. Middle East & Africa
- 4.1. Turkey
- 4.2. Israel
- 4.3. GCC
- 4.4. North Africa
- 4.5. South Africa
- 4.6. Rest of Middle East & Africa
-
5. Asia Pacific
- 5.1. China
- 5.2. India
- 5.3. Japan
- 5.4. South Korea
- 5.5. ASEAN
- 5.6. Oceania
- 5.7. Rest of Asia Pacific
Reverse Logistics Industry in USA Regional Market Share
Geographic Coverage of Reverse Logistics Industry in USA
Reverse Logistics Industry in USA REPORT HIGHLIGHTS
| Aspects | Details |
|---|---|
| Study Period | 2020-2034 |
| Base Year | 2025 |
| Estimated Year | 2026 |
| Forecast Period | 2026-2034 |
| Historical Period | 2020-2025 |
| Growth Rate | CAGR of 6.2% from 2020-2034 |
| Segmentation |
|
Table of Contents
- 1. Introduction
- 1.1. Research Scope
- 1.2. Market Segmentation
- 1.3. Research Objective
- 1.4. Definitions and Assumptions
- 2. Executive Summary
- 2.1. Market Snapshot
- 3. Market Dynamics
- 3.1. Market Drivers
- 3.2. Market Restrains
- 3.3. Market Trends
- 3.4. Market Opportunities
- 4. Market Factor Analysis
- 4.1. Porters Five Forces
- 4.1.1. Bargaining Power of Suppliers
- 4.1.2. Bargaining Power of Buyers
- 4.1.3. Threat of New Entrants
- 4.1.4. Threat of Substitutes
- 4.1.5. Competitive Rivalry
- 4.2. PESTEL analysis
- 4.3. BCG Analysis
- 4.3.1. Stars (High Growth, High Market Share)
- 4.3.2. Cash Cows (Low Growth, High Market Share)
- 4.3.3. Question Mark (High Growth, Low Market Share)
- 4.3.4. Dogs (Low Growth, Low Market Share)
- 4.4. Ansoff Matrix Analysis
- 4.5. Supply Chain Analysis
- 4.6. Regulatory Landscape
- 4.7. Current Market Potential and Opportunity Assessment (TAM–SAM–SOM Framework)
- 4.8. PRI Analyst Note
- 4.1. Porters Five Forces
- 5. Market Analysis, Insights and Forecast 2021-2033
- 5.1. Market Analysis, Insights and Forecast - by Function
- 5.1.1. Transportation
- 5.1.1.1. Road
- 5.1.1.2. Air
- 5.1.1.3. Other Modes of Transportation
- 5.1.2. Warehous
- 5.1.3. Other Va
- 5.1.1. Transportation
- 5.2. Market Analysis, Insights and Forecast - by End User
- 5.2.1. Consumer
- 5.2.2. Automotive
- 5.2.3. Healthcare and Pharmaceuticals
- 5.2.4. Other Industrial Activity Sectors
- 5.2.5. Other End Users
- 5.3. Market Analysis, Insights and Forecast - by Region
- 5.3.1. North America
- 5.3.2. South America
- 5.3.3. Europe
- 5.3.4. Middle East & Africa
- 5.3.5. Asia Pacific
- 5.1. Market Analysis, Insights and Forecast - by Function
- 6. Global Reverse Logistics Industry in USA Analysis, Insights and Forecast, 2021-2033
- 6.1. Market Analysis, Insights and Forecast - by Function
- 6.1.1. Transportation
- 6.1.1.1. Road
- 6.1.1.2. Air
- 6.1.1.3. Other Modes of Transportation
- 6.1.2. Warehous
- 6.1.3. Other Va
- 6.1.1. Transportation
- 6.2. Market Analysis, Insights and Forecast - by End User
- 6.2.1. Consumer
- 6.2.2. Automotive
- 6.2.3. Healthcare and Pharmaceuticals
- 6.2.4. Other Industrial Activity Sectors
- 6.2.5. Other End Users
- 6.1. Market Analysis, Insights and Forecast - by Function
- 7. North America Reverse Logistics Industry in USA Analysis, Insights and Forecast, 2020-2032
- 7.1. Market Analysis, Insights and Forecast - by Function
- 7.1.1. Transportation
- 7.1.1.1. Road
- 7.1.1.2. Air
- 7.1.1.3. Other Modes of Transportation
- 7.1.2. Warehous
- 7.1.3. Other Va
- 7.1.1. Transportation
- 7.2. Market Analysis, Insights and Forecast - by End User
- 7.2.1. Consumer
- 7.2.2. Automotive
- 7.2.3. Healthcare and Pharmaceuticals
- 7.2.4. Other Industrial Activity Sectors
- 7.2.5. Other End Users
- 7.1. Market Analysis, Insights and Forecast - by Function
- 8. South America Reverse Logistics Industry in USA Analysis, Insights and Forecast, 2020-2032
- 8.1. Market Analysis, Insights and Forecast - by Function
- 8.1.1. Transportation
- 8.1.1.1. Road
- 8.1.1.2. Air
- 8.1.1.3. Other Modes of Transportation
- 8.1.2. Warehous
- 8.1.3. Other Va
- 8.1.1. Transportation
- 8.2. Market Analysis, Insights and Forecast - by End User
- 8.2.1. Consumer
- 8.2.2. Automotive
- 8.2.3. Healthcare and Pharmaceuticals
- 8.2.4. Other Industrial Activity Sectors
- 8.2.5. Other End Users
- 8.1. Market Analysis, Insights and Forecast - by Function
- 9. Europe Reverse Logistics Industry in USA Analysis, Insights and Forecast, 2020-2032
- 9.1. Market Analysis, Insights and Forecast - by Function
- 9.1.1. Transportation
- 9.1.1.1. Road
- 9.1.1.2. Air
- 9.1.1.3. Other Modes of Transportation
- 9.1.2. Warehous
- 9.1.3. Other Va
- 9.1.1. Transportation
- 9.2. Market Analysis, Insights and Forecast - by End User
- 9.2.1. Consumer
- 9.2.2. Automotive
- 9.2.3. Healthcare and Pharmaceuticals
- 9.2.4. Other Industrial Activity Sectors
- 9.2.5. Other End Users
- 9.1. Market Analysis, Insights and Forecast - by Function
- 10. Middle East & Africa Reverse Logistics Industry in USA Analysis, Insights and Forecast, 2020-2032
- 10.1. Market Analysis, Insights and Forecast - by Function
- 10.1.1. Transportation
- 10.1.1.1. Road
- 10.1.1.2. Air
- 10.1.1.3. Other Modes of Transportation
- 10.1.2. Warehous
- 10.1.3. Other Va
- 10.1.1. Transportation
- 10.2. Market Analysis, Insights and Forecast - by End User
- 10.2.1. Consumer
- 10.2.2. Automotive
- 10.2.3. Healthcare and Pharmaceuticals
- 10.2.4. Other Industrial Activity Sectors
- 10.2.5. Other End Users
- 10.1. Market Analysis, Insights and Forecast - by Function
- 11. Asia Pacific Reverse Logistics Industry in USA Analysis, Insights and Forecast, 2020-2032
- 11.1. Market Analysis, Insights and Forecast - by Function
- 11.1.1. Transportation
- 11.1.1.1. Road
- 11.1.1.2. Air
- 11.1.1.3. Other Modes of Transportation
- 11.1.2. Warehous
- 11.1.3. Other Va
- 11.1.1. Transportation
- 11.2. Market Analysis, Insights and Forecast - by End User
- 11.2.1. Consumer
- 11.2.2. Automotive
- 11.2.3. Healthcare and Pharmaceuticals
- 11.2.4. Other Industrial Activity Sectors
- 11.2.5. Other End Users
- 11.1. Market Analysis, Insights and Forecast - by Function
- 12. Competitive Analysis
- 12.1. Company Profiles
- 12.1.1 DGD Transport
- 12.1.1.1. Company Overview
- 12.1.1.2. Products
- 12.1.1.3. Company Financials
- 12.1.1.4. SWOT Analysis
- 12.1.2 DHL
- 12.1.2.1. Company Overview
- 12.1.2.2. Products
- 12.1.2.3. Company Financials
- 12.1.2.4. SWOT Analysis
- 12.1.3 A2B Fulfillment
- 12.1.3.1. Company Overview
- 12.1.3.2. Products
- 12.1.3.3. Company Financials
- 12.1.3.4. SWOT Analysis
- 12.1.4 FedEx Corporation
- 12.1.4.1. Company Overview
- 12.1.4.2. Products
- 12.1.4.3. Company Financials
- 12.1.4.4. SWOT Analysis
- 12.1.5 Yusen Logistics
- 12.1.5.1. Company Overview
- 12.1.5.2. Products
- 12.1.5.3. Company Financials
- 12.1.5.4. SWOT Analysis
- 12.1.6 United Parcel Service (UPS)
- 12.1.6.1. Company Overview
- 12.1.6.2. Products
- 12.1.6.3. Company Financials
- 12.1.6.4. SWOT Analysis
- 12.1.7 YRC Worldwide Inc
- 12.1.7.1. Company Overview
- 12.1.7.2. Products
- 12.1.7.3. Company Financials
- 12.1.7.4. SWOT Analysis
- 12.1.8 7 COMPANY PROFILES
- 12.1.8.1. Company Overview
- 12.1.8.2. Products
- 12.1.8.3. Company Financials
- 12.1.8.4. SWOT Analysis
- 12.1.9 C H Robinson Worldwide Inc
- 12.1.9.1. Company Overview
- 12.1.9.2. Products
- 12.1.9.3. Company Financials
- 12.1.9.4. SWOT Analysis
- 12.1.10 XPO Logistics
- 12.1.10.1. Company Overview
- 12.1.10.2. Products
- 12.1.10.3. Company Financials
- 12.1.10.4. SWOT Analysis
- 12.1.11 Excelsior Integrated LLC
- 12.1.11.1. Company Overview
- 12.1.11.2. Products
- 12.1.11.3. Company Financials
- 12.1.11.4. SWOT Analysis
- 12.1.12 Happy Returns Inc
- 12.1.12.1. Company Overview
- 12.1.12.2. Products
- 12.1.12.3. Company Financials
- 12.1.12.4. SWOT Analysis
- 12.1.13 American Distribution Inc
- 12.1.13.1. Company Overview
- 12.1.13.2. Products
- 12.1.13.3. Company Financials
- 12.1.13.4. SWOT Analysis
- 12.1.14 FW Logistics
- 12.1.14.1. Company Overview
- 12.1.14.2. Products
- 12.1.14.3. Company Financials
- 12.1.14.4. SWOT Analysis
- 12.1.15 Newgistics Inc
- 12.1.15.1. Company Overview
- 12.1.15.2. Products
- 12.1.15.3. Company Financials
- 12.1.15.4. SWOT Analysis
- 12.1.16 United States Postal Service (USPS)
- 12.1.16.1. Company Overview
- 12.1.16.2. Products
- 12.1.16.3. Company Financials
- 12.1.16.4. SWOT Analysis
- 12.1.17 Optoro
- 12.1.17.1. Company Overview
- 12.1.17.2. Products
- 12.1.17.3. Company Financials
- 12.1.17.4. SWOT Analysis
- 12.1.1 DGD Transport
- 12.2. Market Entropy
- 12.2.1 Company's Key Areas Served
- 12.2.2 Recent Developments
- 12.3. Company Market Share Analysis 2025
- 12.3.1 Top 5 Companies Market Share Analysis
- 12.3.2 Top 3 Companies Market Share Analysis
- 12.4. List of Potential Customers
- 13. Research Methodology
List of Figures
- Figure 1: Global Reverse Logistics Industry in USA Revenue Breakdown (undefined, %) by Region 2025 & 2033
- Figure 2: North America Reverse Logistics Industry in USA Revenue (undefined), by Function 2025 & 2033
- Figure 3: North America Reverse Logistics Industry in USA Revenue Share (%), by Function 2025 & 2033
- Figure 4: North America Reverse Logistics Industry in USA Revenue (undefined), by End User 2025 & 2033
- Figure 5: North America Reverse Logistics Industry in USA Revenue Share (%), by End User 2025 & 2033
- Figure 6: North America Reverse Logistics Industry in USA Revenue (undefined), by Country 2025 & 2033
- Figure 7: North America Reverse Logistics Industry in USA Revenue Share (%), by Country 2025 & 2033
- Figure 8: South America Reverse Logistics Industry in USA Revenue (undefined), by Function 2025 & 2033
- Figure 9: South America Reverse Logistics Industry in USA Revenue Share (%), by Function 2025 & 2033
- Figure 10: South America Reverse Logistics Industry in USA Revenue (undefined), by End User 2025 & 2033
- Figure 11: South America Reverse Logistics Industry in USA Revenue Share (%), by End User 2025 & 2033
- Figure 12: South America Reverse Logistics Industry in USA Revenue (undefined), by Country 2025 & 2033
- Figure 13: South America Reverse Logistics Industry in USA Revenue Share (%), by Country 2025 & 2033
- Figure 14: Europe Reverse Logistics Industry in USA Revenue (undefined), by Function 2025 & 2033
- Figure 15: Europe Reverse Logistics Industry in USA Revenue Share (%), by Function 2025 & 2033
- Figure 16: Europe Reverse Logistics Industry in USA Revenue (undefined), by End User 2025 & 2033
- Figure 17: Europe Reverse Logistics Industry in USA Revenue Share (%), by End User 2025 & 2033
- Figure 18: Europe Reverse Logistics Industry in USA Revenue (undefined), by Country 2025 & 2033
- Figure 19: Europe Reverse Logistics Industry in USA Revenue Share (%), by Country 2025 & 2033
- Figure 20: Middle East & Africa Reverse Logistics Industry in USA Revenue (undefined), by Function 2025 & 2033
- Figure 21: Middle East & Africa Reverse Logistics Industry in USA Revenue Share (%), by Function 2025 & 2033
- Figure 22: Middle East & Africa Reverse Logistics Industry in USA Revenue (undefined), by End User 2025 & 2033
- Figure 23: Middle East & Africa Reverse Logistics Industry in USA Revenue Share (%), by End User 2025 & 2033
- Figure 24: Middle East & Africa Reverse Logistics Industry in USA Revenue (undefined), by Country 2025 & 2033
- Figure 25: Middle East & Africa Reverse Logistics Industry in USA Revenue Share (%), by Country 2025 & 2033
- Figure 26: Asia Pacific Reverse Logistics Industry in USA Revenue (undefined), by Function 2025 & 2033
- Figure 27: Asia Pacific Reverse Logistics Industry in USA Revenue Share (%), by Function 2025 & 2033
- Figure 28: Asia Pacific Reverse Logistics Industry in USA Revenue (undefined), by End User 2025 & 2033
- Figure 29: Asia Pacific Reverse Logistics Industry in USA Revenue Share (%), by End User 2025 & 2033
- Figure 30: Asia Pacific Reverse Logistics Industry in USA Revenue (undefined), by Country 2025 & 2033
- Figure 31: Asia Pacific Reverse Logistics Industry in USA Revenue Share (%), by Country 2025 & 2033
List of Tables
- Table 1: Global Reverse Logistics Industry in USA Revenue undefined Forecast, by Function 2020 & 2033
- Table 2: Global Reverse Logistics Industry in USA Revenue undefined Forecast, by End User 2020 & 2033
- Table 3: Global Reverse Logistics Industry in USA Revenue undefined Forecast, by Region 2020 & 2033
- Table 4: Global Reverse Logistics Industry in USA Revenue undefined Forecast, by Function 2020 & 2033
- Table 5: Global Reverse Logistics Industry in USA Revenue undefined Forecast, by End User 2020 & 2033
- Table 6: Global Reverse Logistics Industry in USA Revenue undefined Forecast, by Country 2020 & 2033
- Table 7: United States Reverse Logistics Industry in USA Revenue (undefined) Forecast, by Application 2020 & 2033
- Table 8: Canada Reverse Logistics Industry in USA Revenue (undefined) Forecast, by Application 2020 & 2033
- Table 9: Mexico Reverse Logistics Industry in USA Revenue (undefined) Forecast, by Application 2020 & 2033
- Table 10: Global Reverse Logistics Industry in USA Revenue undefined Forecast, by Function 2020 & 2033
- Table 11: Global Reverse Logistics Industry in USA Revenue undefined Forecast, by End User 2020 & 2033
- Table 12: Global Reverse Logistics Industry in USA Revenue undefined Forecast, by Country 2020 & 2033
- Table 13: Brazil Reverse Logistics Industry in USA Revenue (undefined) Forecast, by Application 2020 & 2033
- Table 14: Argentina Reverse Logistics Industry in USA Revenue (undefined) Forecast, by Application 2020 & 2033
- Table 15: Rest of South America Reverse Logistics Industry in USA Revenue (undefined) Forecast, by Application 2020 & 2033
- Table 16: Global Reverse Logistics Industry in USA Revenue undefined Forecast, by Function 2020 & 2033
- Table 17: Global Reverse Logistics Industry in USA Revenue undefined Forecast, by End User 2020 & 2033
- Table 18: Global Reverse Logistics Industry in USA Revenue undefined Forecast, by Country 2020 & 2033
- Table 19: United Kingdom Reverse Logistics Industry in USA Revenue (undefined) Forecast, by Application 2020 & 2033
- Table 20: Germany Reverse Logistics Industry in USA Revenue (undefined) Forecast, by Application 2020 & 2033
- Table 21: France Reverse Logistics Industry in USA Revenue (undefined) Forecast, by Application 2020 & 2033
- Table 22: Italy Reverse Logistics Industry in USA Revenue (undefined) Forecast, by Application 2020 & 2033
- Table 23: Spain Reverse Logistics Industry in USA Revenue (undefined) Forecast, by Application 2020 & 2033
- Table 24: Russia Reverse Logistics Industry in USA Revenue (undefined) Forecast, by Application 2020 & 2033
- Table 25: Benelux Reverse Logistics Industry in USA Revenue (undefined) Forecast, by Application 2020 & 2033
- Table 26: Nordics Reverse Logistics Industry in USA Revenue (undefined) Forecast, by Application 2020 & 2033
- Table 27: Rest of Europe Reverse Logistics Industry in USA Revenue (undefined) Forecast, by Application 2020 & 2033
- Table 28: Global Reverse Logistics Industry in USA Revenue undefined Forecast, by Function 2020 & 2033
- Table 29: Global Reverse Logistics Industry in USA Revenue undefined Forecast, by End User 2020 & 2033
- Table 30: Global Reverse Logistics Industry in USA Revenue undefined Forecast, by Country 2020 & 2033
- Table 31: Turkey Reverse Logistics Industry in USA Revenue (undefined) Forecast, by Application 2020 & 2033
- Table 32: Israel Reverse Logistics Industry in USA Revenue (undefined) Forecast, by Application 2020 & 2033
- Table 33: GCC Reverse Logistics Industry in USA Revenue (undefined) Forecast, by Application 2020 & 2033
- Table 34: North Africa Reverse Logistics Industry in USA Revenue (undefined) Forecast, by Application 2020 & 2033
- Table 35: South Africa Reverse Logistics Industry in USA Revenue (undefined) Forecast, by Application 2020 & 2033
- Table 36: Rest of Middle East & Africa Reverse Logistics Industry in USA Revenue (undefined) Forecast, by Application 2020 & 2033
- Table 37: Global Reverse Logistics Industry in USA Revenue undefined Forecast, by Function 2020 & 2033
- Table 38: Global Reverse Logistics Industry in USA Revenue undefined Forecast, by End User 2020 & 2033
- Table 39: Global Reverse Logistics Industry in USA Revenue undefined Forecast, by Country 2020 & 2033
- Table 40: China Reverse Logistics Industry in USA Revenue (undefined) Forecast, by Application 2020 & 2033
- Table 41: India Reverse Logistics Industry in USA Revenue (undefined) Forecast, by Application 2020 & 2033
- Table 42: Japan Reverse Logistics Industry in USA Revenue (undefined) Forecast, by Application 2020 & 2033
- Table 43: South Korea Reverse Logistics Industry in USA Revenue (undefined) Forecast, by Application 2020 & 2033
- Table 44: ASEAN Reverse Logistics Industry in USA Revenue (undefined) Forecast, by Application 2020 & 2033
- Table 45: Oceania Reverse Logistics Industry in USA Revenue (undefined) Forecast, by Application 2020 & 2033
- Table 46: Rest of Asia Pacific Reverse Logistics Industry in USA Revenue (undefined) Forecast, by Application 2020 & 2033
Frequently Asked Questions
1. What is the projected Compound Annual Growth Rate (CAGR) of the Reverse Logistics Industry in USA?
The projected CAGR is approximately 6.2%.
2. Which companies are prominent players in the Reverse Logistics Industry in USA?
Key companies in the market include DGD Transport, DHL, A2B Fulfillment, FedEx Corporation, Yusen Logistics, United Parcel Service (UPS), YRC Worldwide Inc, 7 COMPANY PROFILES, C H Robinson Worldwide Inc, XPO Logistics, Excelsior Integrated LLC, Happy Returns Inc, American Distribution Inc, FW Logistics, Newgistics Inc, United States Postal Service (USPS), Optoro.
3. What are the main segments of the Reverse Logistics Industry in USA?
The market segments include Function, End User.
4. Can you provide details about the market size?
The market size is estimated to be USD XXX N/A as of 2022.
5. What are some drivers contributing to market growth?
N/A
6. What are the notable trends driving market growth?
Growth in E-commerce and Technology Propels the Demand for Efficient Return Logistics.
7. Are there any restraints impacting market growth?
N/A
8. Can you provide examples of recent developments in the market?
N/A
9. What pricing options are available for accessing the report?
Pricing options include single-user, multi-user, and enterprise licenses priced at USD 3800, USD 4500, and USD 5800 respectively.
10. Is the market size provided in terms of value or volume?
The market size is provided in terms of value, measured in N/A.
11. Are there any specific market keywords associated with the report?
Yes, the market keyword associated with the report is "Reverse Logistics Industry in USA," which aids in identifying and referencing the specific market segment covered.
12. How do I determine which pricing option suits my needs best?
The pricing options vary based on user requirements and access needs. Individual users may opt for single-user licenses, while businesses requiring broader access may choose multi-user or enterprise licenses for cost-effective access to the report.
13. Are there any additional resources or data provided in the Reverse Logistics Industry in USA report?
While the report offers comprehensive insights, it's advisable to review the specific contents or supplementary materials provided to ascertain if additional resources or data are available.
14. How can I stay updated on further developments or reports in the Reverse Logistics Industry in USA?
To stay informed about further developments, trends, and reports in the Reverse Logistics Industry in USA, consider subscribing to industry newsletters, following relevant companies and organizations, or regularly checking reputable industry news sources and publications.
Methodology
Step 1 - Identification of Relevant Samples Size from Population Database


Step 2 - Approaches for Defining Global Market Size (Value, Volume* & Price*)

Note*: In applicable scenarios
Step 3 - Data Sources
Primary Research
- Web Analytics
- Survey Reports
- Research Institute
- Latest Research Reports
- Opinion Leaders
Secondary Research
- Annual Reports
- White Paper
- Latest Press Release
- Industry Association
- Paid Database
- Investor Presentations

Step 4 - Data Triangulation
Involves using different sources of information in order to increase the validity of a study
These sources are likely to be stakeholders in a program - participants, other researchers, program staff, other community members, and so on.
Then we put all data in single framework & apply various statistical tools to find out the dynamic on the market.
During the analysis stage, feedback from the stakeholder groups would be compared to determine areas of agreement as well as areas of divergence