

Key Insights
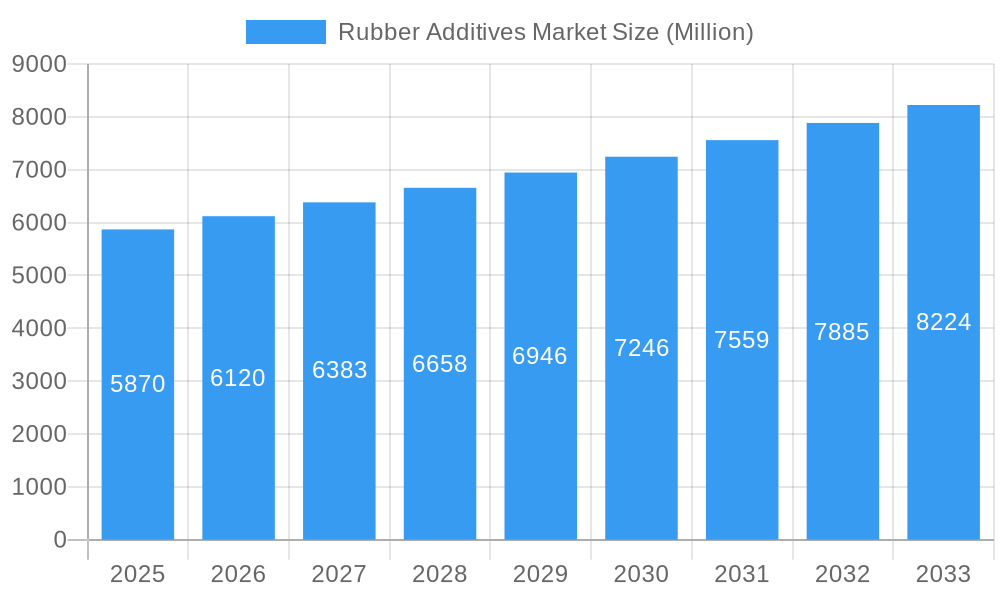
The global rubber additives market, valued at $5.87 billion in 2025, is projected to experience robust growth, driven by a compound annual growth rate (CAGR) of 4.32% from 2025 to 2033. This expansion is fueled by several key factors. The burgeoning automotive industry, particularly the increasing demand for high-performance tires and advanced vehicle components, significantly contributes to market growth. Furthermore, the construction sector's reliance on rubber in conveyor belts, roofing materials, and other applications fuels demand for rubber additives. Growth in the electrical and electronics industries, requiring specialized rubber additives for cable insulation and other components, also plays a significant role. Technological advancements leading to the development of innovative, high-performance additives with improved properties like enhanced durability, heat resistance, and UV protection are further driving market expansion. Regional variations exist, with Asia Pacific, particularly China and India, exhibiting significant growth potential due to their expanding manufacturing sectors and rising infrastructure development. However, fluctuations in raw material prices and stringent environmental regulations pose potential challenges to market growth.
Rubber Additives Market Market Size (In Billion)
The market segmentation reveals key trends. Activators, crucial for vulcanization, dominate the type segment, followed by vulcanization inhibitors essential for controlling the curing process. The tire industry remains the largest application segment, driven by the global automotive boom. However, growing adoption of rubber in various other applications, such as conveyor belts, electric cables, and industrial hoses, is broadening market reach. Among fillers, carbon black maintains its market leadership due to its cost-effectiveness and performance characteristics, although silica and calcium carbonate are gaining traction due to their enhanced properties in specific applications. Key players, including Sumitomo Chemical, BASF, and Lanxess, are investing heavily in R&D to develop advanced additives and expand their market presence through strategic acquisitions and partnerships. The competitive landscape is characterized by both large multinational corporations and specialized regional players, leading to innovation and price competition within the market.
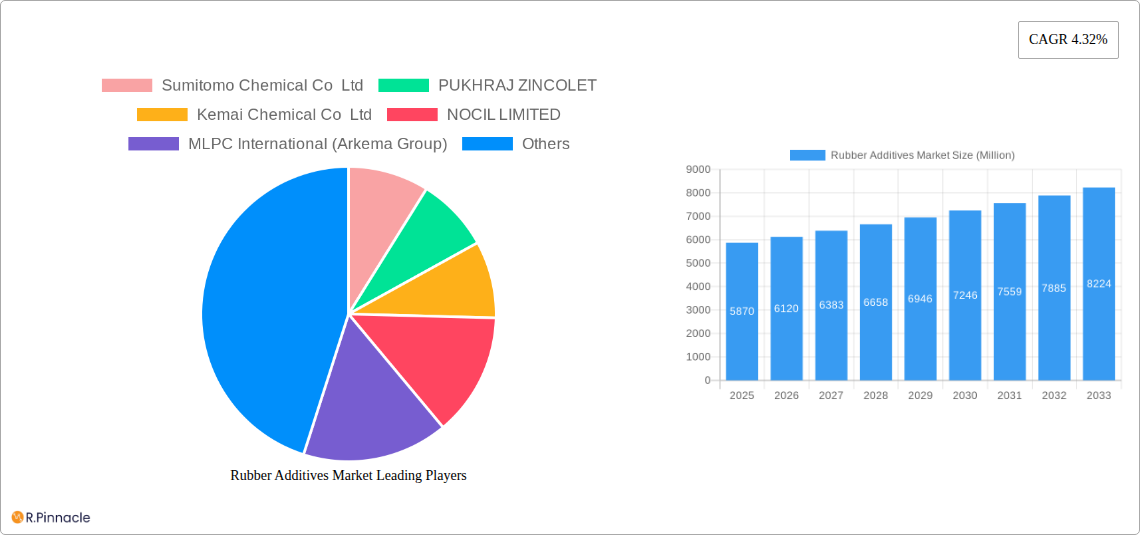
Rubber Additives Market Company Market Share
Rubber Additives Market Report: 2019-2033 Forecast
This comprehensive report provides an in-depth analysis of the global Rubber Additives Market, offering invaluable insights for industry professionals, investors, and strategic decision-makers. The study period spans from 2019 to 2033, with 2025 serving as the base and estimated year. We delve into market dynamics, segmentation, key players, and future trends, providing a 360-degree view of this dynamic sector. The market is valued at xx Million in 2025 and is projected to reach xx Million by 2033, exhibiting a CAGR of xx%.
Rubber Additives Market Structure & Innovation Trends
The Rubber Additives Market exhibits a moderately consolidated structure, with several major players holding significant market share. Sumitomo Chemical Co Ltd, BASF SE, and Arkema (through MLPC International) are among the leading companies, each commanding a substantial portion of the market. The exact market share for each company is xx%, xx% and xx% respectively. However, several smaller, specialized players also contribute significantly, particularly in niche applications. Innovation is driven by the increasing demand for high-performance rubber products with enhanced properties like durability, flexibility, and sustainability. Stringent environmental regulations are prompting the development of eco-friendly additives, a trend further propelled by growing consumer awareness. Mergers and acquisitions (M&A) activities are frequent, with deal values exceeding xx Million in the past five years, showcasing the sector's consolidation trend.
- Market Concentration: Moderately consolidated, with a few dominant players.
- Innovation Drivers: Demand for high-performance rubber, environmental regulations, consumer preferences.
- Regulatory Frameworks: Varying globally, influencing additive choices and production processes.
- Product Substitutes: Limited, due to specialized functionalities of rubber additives.
- End-User Demographics: Primarily focused on the automotive, industrial, and construction sectors.
- M&A Activity: Significant, driving consolidation and technological advancement.
Rubber Additives Market Dynamics & Trends
The Rubber Additives Market is experiencing robust growth, fueled by several key factors. The automotive industry's expansion, particularly in developing economies, is a major driver, with a projected xx% increase in tire production by 2033. The rise of electric vehicles (EVs) is also shaping the market, demanding specialized additives to meet performance requirements. Technological advancements, such as nanotechnology and bio-based additives, are enhancing product functionalities, improving sustainability and creating new market opportunities. Competitive dynamics are intense, with leading players investing heavily in R&D and strategic partnerships to maintain market share. Market penetration of sustainable additives is increasing, driven by both consumer and regulatory pressures.
Dominant Regions & Segments in Rubber Additives Market
The Asia-Pacific region dominates the Rubber Additives Market, driven by robust economic growth, burgeoning automotive industries (e.g., India and China) and rising infrastructure development. Within this region, China, India and Japan are the key contributors, influenced by local manufacturing and growing demand.
- Leading Region: Asia-Pacific
- Key Country Drivers:
- China: Large manufacturing base, strong automotive sector, government support.
- India: Rapid economic growth, expanding automotive sector.
- Japan: Advanced technology, focus on innovation.
- Dominant Segments:
- Type: Activators and Vulcanization Inhibitors hold the largest market shares due to their essential roles in rubber processing and performance.
- Application: The Tire segment dominates due to high volume consumption.
- Fillers: Carbon Black maintains a significant share because of its cost-effectiveness and performance characteristics.
Rubber Additives Market Product Innovations
Recent innovations in the rubber additives market focus on enhancing sustainability and performance. The launch of bio-based additives and sustainable liquid polybutadienes (like Evonik's POLYVEST eCO) addresses growing environmental concerns. Nanotechnology is improving additive dispersion and enhancing overall product properties. These innovations are expanding market applications and enabling the development of more high-performance and eco-friendly rubber products.
Report Scope & Segmentation Analysis
This report analyzes the Rubber Additives Market across various segments:
By Type: Activators, Vulcanization Inhibitors, Plasticizers, and Other Types. Each segment exhibits distinct growth trajectories, influenced by specific application requirements. The Activators segment projects the highest growth due to increasing demand from the tire industry.
By Application: Tires, Conveyor Belts, Electric Cables, and Other Applications. The Tire application segment holds the largest market share, and is experiencing steady growth due to increasing vehicle production.
By Fillers: Carbon Black, Calcium Carbonate, Silica, and Other Fillers. Carbon Black dominates the fillers segment owing to its widespread use in tire manufacturing.
Key Drivers of Rubber Additives Market Growth
Several factors fuel the Rubber Additives Market's growth:
- Rising Automotive Production: Global automotive production fuels high demand for rubber additives, particularly in tires.
- Infrastructure Development: Expansion in construction and infrastructure projects necessitates robust rubber products, boosting demand.
- Technological Advancements: Innovations in materials science are driving the development of high-performance, sustainable rubber additives.
- Government Regulations: Environmental regulations are promoting the adoption of eco-friendly rubber additives.
Challenges in the Rubber Additives Market Sector
The Rubber Additives Market faces several challenges:
- Fluctuating Raw Material Prices: Volatility in raw material costs impacts profitability and pricing strategies.
- Stringent Environmental Regulations: Compliance with increasingly strict environmental standards adds to manufacturing costs.
- Intense Competition: The market is highly competitive, requiring constant innovation and cost optimization.
Emerging Opportunities in Rubber Additives Market
The Rubber Additives Market presents several emerging opportunities:
- Sustainable Additives: Growing demand for eco-friendly products creates opportunities for bio-based and recycled additives.
- High-Performance Applications: Demand for advanced materials in niche applications like aerospace and medical devices opens new market segments.
- Developing Economies: Expanding automotive and infrastructure markets in developing nations offer significant growth potential.
Leading Players in the Rubber Additives Market Market
- Sumitomo Chemical Co Ltd
- PUKHRAJ ZINCOLET
- Kemai Chemical Co Ltd
- NOCIL LIMITED
- MLPC International (Arkema Group)
- Emery Oleochemicals
- BASF SE
- China Sunsine Chemical Holdings Limited
- Thomas Swan & Co Ltd
- Eastman Chemical Company
- Behn Meyer
- Rhein Chemie (Lanxess)
- China Petrochemical Corporation (SINOPEC)
Key Developments in Rubber Additives Market Industry
- February 2023: Yokohama Rubber Co., Ltd. expands passenger car tire production capacity in India by 60%, reaching 4.5 Million units annually. This significantly boosts demand for rubber additives in the region.
- July 2022: Birch Chemicals establishes a new entity in India, targeting the growing Asian market and automotive sector with curing activators and desiccants.
- June 2022: Evonik launches POLYVEST eCO, sustainable liquid polybutadienes for tire manufacturing, catering to the growing demand for eco-friendly materials.
Future Outlook for Rubber Additives Market Market
The Rubber Additives Market is poised for continued growth, driven by factors such as rising automotive production, infrastructure development, and the increasing adoption of sustainable technologies. The market's future potential lies in the development and adoption of advanced, high-performance additives that meet the demands of diverse and evolving applications across various industries. Strategic partnerships and investments in R&D will play crucial roles in shaping the market's future landscape.
Rubber Additives Market Segmentation
-
1. Type
- 1.1. Activators
- 1.2. Vulcanization Inhibitors
- 1.3. Plasticizers
- 1.4. Other Types
-
2. Application
- 2.1. Tires
- 2.2. Conveyor Belts
- 2.3. Electric Cables
- 2.4. Other Applications
-
3. Fillers
- 3.1. Carbon Black
- 3.2. Calcium Carbonate
- 3.3. Silica
- 3.4. Other Fillers
Rubber Additives Market Segmentation By Geography
-
1. Asia Pacific
- 1.1. China
- 1.2. India
- 1.3. Japan
- 1.4. South Korea
- 1.5. Rest of Asia Pacific
-
2. North America
- 2.1. United States
- 2.2. Canada
- 2.3. Mexico
-
3. Europe
- 3.1. Germany
- 3.2. United Kingdom
- 3.3. France
- 3.4. Italy
- 3.5. Rest of Europe
-
4. South America
- 4.1. Brazil
- 4.2. Argentina
- 4.3. Rest of South America
-
5. Middle East and Africa
- 5.1. Saudi Arabia
- 5.2. South Africa
- 5.3. Rest of Middle East and Africa
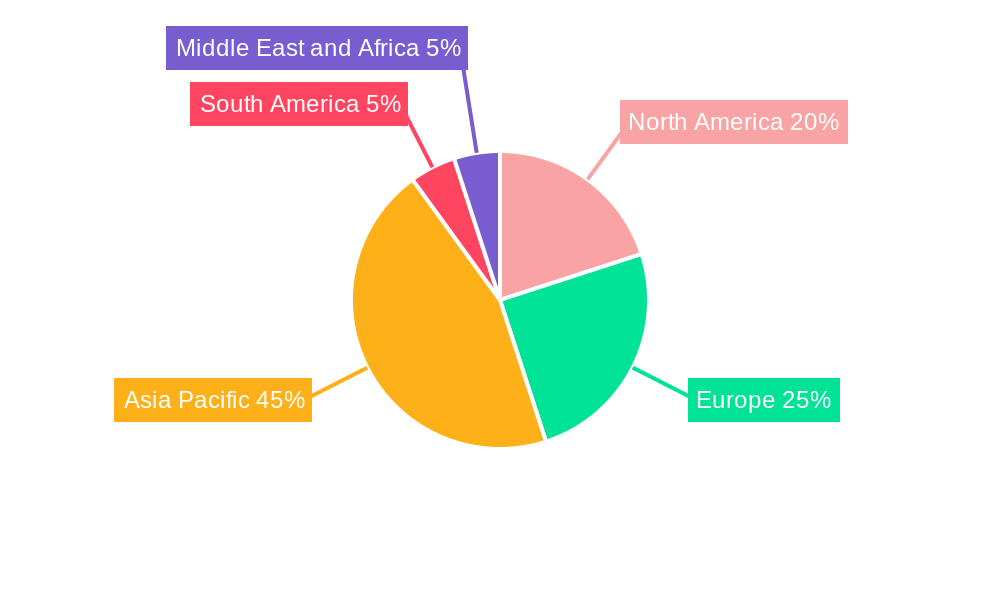
Rubber Additives Market Regional Market Share
Geographic Coverage of Rubber Additives Market
Rubber Additives Market REPORT HIGHLIGHTS
| Aspects | Details |
|---|---|
| Study Period | 2020-2034 |
| Base Year | 2025 |
| Estimated Year | 2026 |
| Forecast Period | 2026-2034 |
| Historical Period | 2020-2025 |
| Growth Rate | CAGR of 4.32% from 2020-2034 |
| Segmentation |
|
Table of Contents
- 1. Introduction
- 1.1. Research Scope
- 1.2. Market Segmentation
- 1.3. Research Objective
- 1.4. Definitions and Assumptions
- 2. Executive Summary
- 2.1. Market Snapshot
- 3. Market Dynamics
- 3.1. Market Drivers
- 3.2. Market Restrains
- 3.3. Market Trends
- 3.4. Market Opportunities
- 4. Market Factor Analysis
- 4.1. Porters Five Forces
- 4.1.1. Bargaining Power of Suppliers
- 4.1.2. Bargaining Power of Buyers
- 4.1.3. Threat of New Entrants
- 4.1.4. Threat of Substitutes
- 4.1.5. Competitive Rivalry
- 4.2. PESTEL analysis
- 4.3. BCG Analysis
- 4.3.1. Stars (High Growth, High Market Share)
- 4.3.2. Cash Cows (Low Growth, High Market Share)
- 4.3.3. Question Mark (High Growth, Low Market Share)
- 4.3.4. Dogs (Low Growth, Low Market Share)
- 4.4. Ansoff Matrix Analysis
- 4.5. Supply Chain Analysis
- 4.6. Regulatory Landscape
- 4.7. Current Market Potential and Opportunity Assessment (TAM–SAM–SOM Framework)
- 4.8. PRI Analyst Note
- 4.1. Porters Five Forces
- 5. Market Analysis, Insights and Forecast 2021-2033
- 5.1. Market Analysis, Insights and Forecast - by Type
- 5.1.1. Activators
- 5.1.2. Vulcanization Inhibitors
- 5.1.3. Plasticizers
- 5.1.4. Other Types
- 5.2. Market Analysis, Insights and Forecast - by Application
- 5.2.1. Tires
- 5.2.2. Conveyor Belts
- 5.2.3. Electric Cables
- 5.2.4. Other Applications
- 5.3. Market Analysis, Insights and Forecast - by Fillers
- 5.3.1. Carbon Black
- 5.3.2. Calcium Carbonate
- 5.3.3. Silica
- 5.3.4. Other Fillers
- 5.4. Market Analysis, Insights and Forecast - by Region
- 5.4.1. Asia Pacific
- 5.4.2. North America
- 5.4.3. Europe
- 5.4.4. South America
- 5.4.5. Middle East and Africa
- 5.1. Market Analysis, Insights and Forecast - by Type
- 6. Global Rubber Additives Market Analysis, Insights and Forecast, 2021-2033
- 6.1. Market Analysis, Insights and Forecast - by Type
- 6.1.1. Activators
- 6.1.2. Vulcanization Inhibitors
- 6.1.3. Plasticizers
- 6.1.4. Other Types
- 6.2. Market Analysis, Insights and Forecast - by Application
- 6.2.1. Tires
- 6.2.2. Conveyor Belts
- 6.2.3. Electric Cables
- 6.2.4. Other Applications
- 6.3. Market Analysis, Insights and Forecast - by Fillers
- 6.3.1. Carbon Black
- 6.3.2. Calcium Carbonate
- 6.3.3. Silica
- 6.3.4. Other Fillers
- 6.1. Market Analysis, Insights and Forecast - by Type
- 7. Asia Pacific Rubber Additives Market Analysis, Insights and Forecast, 2020-2032
- 7.1. Market Analysis, Insights and Forecast - by Type
- 7.1.1. Activators
- 7.1.2. Vulcanization Inhibitors
- 7.1.3. Plasticizers
- 7.1.4. Other Types
- 7.2. Market Analysis, Insights and Forecast - by Application
- 7.2.1. Tires
- 7.2.2. Conveyor Belts
- 7.2.3. Electric Cables
- 7.2.4. Other Applications
- 7.3. Market Analysis, Insights and Forecast - by Fillers
- 7.3.1. Carbon Black
- 7.3.2. Calcium Carbonate
- 7.3.3. Silica
- 7.3.4. Other Fillers
- 7.1. Market Analysis, Insights and Forecast - by Type
- 8. North America Rubber Additives Market Analysis, Insights and Forecast, 2020-2032
- 8.1. Market Analysis, Insights and Forecast - by Type
- 8.1.1. Activators
- 8.1.2. Vulcanization Inhibitors
- 8.1.3. Plasticizers
- 8.1.4. Other Types
- 8.2. Market Analysis, Insights and Forecast - by Application
- 8.2.1. Tires
- 8.2.2. Conveyor Belts
- 8.2.3. Electric Cables
- 8.2.4. Other Applications
- 8.3. Market Analysis, Insights and Forecast - by Fillers
- 8.3.1. Carbon Black
- 8.3.2. Calcium Carbonate
- 8.3.3. Silica
- 8.3.4. Other Fillers
- 8.1. Market Analysis, Insights and Forecast - by Type
- 9. Europe Rubber Additives Market Analysis, Insights and Forecast, 2020-2032
- 9.1. Market Analysis, Insights and Forecast - by Type
- 9.1.1. Activators
- 9.1.2. Vulcanization Inhibitors
- 9.1.3. Plasticizers
- 9.1.4. Other Types
- 9.2. Market Analysis, Insights and Forecast - by Application
- 9.2.1. Tires
- 9.2.2. Conveyor Belts
- 9.2.3. Electric Cables
- 9.2.4. Other Applications
- 9.3. Market Analysis, Insights and Forecast - by Fillers
- 9.3.1. Carbon Black
- 9.3.2. Calcium Carbonate
- 9.3.3. Silica
- 9.3.4. Other Fillers
- 9.1. Market Analysis, Insights and Forecast - by Type
- 10. South America Rubber Additives Market Analysis, Insights and Forecast, 2020-2032
- 10.1. Market Analysis, Insights and Forecast - by Type
- 10.1.1. Activators
- 10.1.2. Vulcanization Inhibitors
- 10.1.3. Plasticizers
- 10.1.4. Other Types
- 10.2. Market Analysis, Insights and Forecast - by Application
- 10.2.1. Tires
- 10.2.2. Conveyor Belts
- 10.2.3. Electric Cables
- 10.2.4. Other Applications
- 10.3. Market Analysis, Insights and Forecast - by Fillers
- 10.3.1. Carbon Black
- 10.3.2. Calcium Carbonate
- 10.3.3. Silica
- 10.3.4. Other Fillers
- 10.1. Market Analysis, Insights and Forecast - by Type
- 11. Middle East and Africa Rubber Additives Market Analysis, Insights and Forecast, 2020-2032
- 11.1. Market Analysis, Insights and Forecast - by Type
- 11.1.1. Activators
- 11.1.2. Vulcanization Inhibitors
- 11.1.3. Plasticizers
- 11.1.4. Other Types
- 11.2. Market Analysis, Insights and Forecast - by Application
- 11.2.1. Tires
- 11.2.2. Conveyor Belts
- 11.2.3. Electric Cables
- 11.2.4. Other Applications
- 11.3. Market Analysis, Insights and Forecast - by Fillers
- 11.3.1. Carbon Black
- 11.3.2. Calcium Carbonate
- 11.3.3. Silica
- 11.3.4. Other Fillers
- 11.1. Market Analysis, Insights and Forecast - by Type
- 12. Competitive Analysis
- 12.1. Company Profiles
- 12.1.1 Sumitomo Chemical Co Ltd
- 12.1.1.1. Company Overview
- 12.1.1.2. Products
- 12.1.1.3. Company Financials
- 12.1.1.4. SWOT Analysis
- 12.1.2 PUKHRAJ ZINCOLET
- 12.1.2.1. Company Overview
- 12.1.2.2. Products
- 12.1.2.3. Company Financials
- 12.1.2.4. SWOT Analysis
- 12.1.3 Kemai Chemical Co Ltd
- 12.1.3.1. Company Overview
- 12.1.3.2. Products
- 12.1.3.3. Company Financials
- 12.1.3.4. SWOT Analysis
- 12.1.4 NOCIL LIMITED
- 12.1.4.1. Company Overview
- 12.1.4.2. Products
- 12.1.4.3. Company Financials
- 12.1.4.4. SWOT Analysis
- 12.1.5 MLPC International (Arkema Group)
- 12.1.5.1. Company Overview
- 12.1.5.2. Products
- 12.1.5.3. Company Financials
- 12.1.5.4. SWOT Analysis
- 12.1.6 Emery Oleochemicals
- 12.1.6.1. Company Overview
- 12.1.6.2. Products
- 12.1.6.3. Company Financials
- 12.1.6.4. SWOT Analysis
- 12.1.7 BASF SE
- 12.1.7.1. Company Overview
- 12.1.7.2. Products
- 12.1.7.3. Company Financials
- 12.1.7.4. SWOT Analysis
- 12.1.8 China Sunsine Chemical Holdings Limited
- 12.1.8.1. Company Overview
- 12.1.8.2. Products
- 12.1.8.3. Company Financials
- 12.1.8.4. SWOT Analysis
- 12.1.9 Thomas Swan & Co Ltd*List Not Exhaustive
- 12.1.9.1. Company Overview
- 12.1.9.2. Products
- 12.1.9.3. Company Financials
- 12.1.9.4. SWOT Analysis
- 12.1.10 Eastman Chemical Company
- 12.1.10.1. Company Overview
- 12.1.10.2. Products
- 12.1.10.3. Company Financials
- 12.1.10.4. SWOT Analysis
- 12.1.11 Behn Meyer
- 12.1.11.1. Company Overview
- 12.1.11.2. Products
- 12.1.11.3. Company Financials
- 12.1.11.4. SWOT Analysis
- 12.1.12 Rhein Chemie (Lanxess)
- 12.1.12.1. Company Overview
- 12.1.12.2. Products
- 12.1.12.3. Company Financials
- 12.1.12.4. SWOT Analysis
- 12.1.13 China Petrochemical Corporation (SINOPEC)
- 12.1.13.1. Company Overview
- 12.1.13.2. Products
- 12.1.13.3. Company Financials
- 12.1.13.4. SWOT Analysis
- 12.1.1 Sumitomo Chemical Co Ltd
- 12.2. Market Entropy
- 12.2.1 Company's Key Areas Served
- 12.2.2 Recent Developments
- 12.3. Company Market Share Analysis 2025
- 12.3.1 Top 5 Companies Market Share Analysis
- 12.3.2 Top 3 Companies Market Share Analysis
- 12.4. List of Potential Customers
- 13. Research Methodology
List of Figures
- Figure 1: Global Rubber Additives Market Revenue Breakdown (Million, %) by Region 2025 & 2033
- Figure 2: Asia Pacific Rubber Additives Market Revenue (Million), by Type 2025 & 2033
- Figure 3: Asia Pacific Rubber Additives Market Revenue Share (%), by Type 2025 & 2033
- Figure 4: Asia Pacific Rubber Additives Market Revenue (Million), by Application 2025 & 2033
- Figure 5: Asia Pacific Rubber Additives Market Revenue Share (%), by Application 2025 & 2033
- Figure 6: Asia Pacific Rubber Additives Market Revenue (Million), by Fillers 2025 & 2033
- Figure 7: Asia Pacific Rubber Additives Market Revenue Share (%), by Fillers 2025 & 2033
- Figure 8: Asia Pacific Rubber Additives Market Revenue (Million), by Country 2025 & 2033
- Figure 9: Asia Pacific Rubber Additives Market Revenue Share (%), by Country 2025 & 2033
- Figure 10: North America Rubber Additives Market Revenue (Million), by Type 2025 & 2033
- Figure 11: North America Rubber Additives Market Revenue Share (%), by Type 2025 & 2033
- Figure 12: North America Rubber Additives Market Revenue (Million), by Application 2025 & 2033
- Figure 13: North America Rubber Additives Market Revenue Share (%), by Application 2025 & 2033
- Figure 14: North America Rubber Additives Market Revenue (Million), by Fillers 2025 & 2033
- Figure 15: North America Rubber Additives Market Revenue Share (%), by Fillers 2025 & 2033
- Figure 16: North America Rubber Additives Market Revenue (Million), by Country 2025 & 2033
- Figure 17: North America Rubber Additives Market Revenue Share (%), by Country 2025 & 2033
- Figure 18: Europe Rubber Additives Market Revenue (Million), by Type 2025 & 2033
- Figure 19: Europe Rubber Additives Market Revenue Share (%), by Type 2025 & 2033
- Figure 20: Europe Rubber Additives Market Revenue (Million), by Application 2025 & 2033
- Figure 21: Europe Rubber Additives Market Revenue Share (%), by Application 2025 & 2033
- Figure 22: Europe Rubber Additives Market Revenue (Million), by Fillers 2025 & 2033
- Figure 23: Europe Rubber Additives Market Revenue Share (%), by Fillers 2025 & 2033
- Figure 24: Europe Rubber Additives Market Revenue (Million), by Country 2025 & 2033
- Figure 25: Europe Rubber Additives Market Revenue Share (%), by Country 2025 & 2033
- Figure 26: South America Rubber Additives Market Revenue (Million), by Type 2025 & 2033
- Figure 27: South America Rubber Additives Market Revenue Share (%), by Type 2025 & 2033
- Figure 28: South America Rubber Additives Market Revenue (Million), by Application 2025 & 2033
- Figure 29: South America Rubber Additives Market Revenue Share (%), by Application 2025 & 2033
- Figure 30: South America Rubber Additives Market Revenue (Million), by Fillers 2025 & 2033
- Figure 31: South America Rubber Additives Market Revenue Share (%), by Fillers 2025 & 2033
- Figure 32: South America Rubber Additives Market Revenue (Million), by Country 2025 & 2033
- Figure 33: South America Rubber Additives Market Revenue Share (%), by Country 2025 & 2033
- Figure 34: Middle East and Africa Rubber Additives Market Revenue (Million), by Type 2025 & 2033
- Figure 35: Middle East and Africa Rubber Additives Market Revenue Share (%), by Type 2025 & 2033
- Figure 36: Middle East and Africa Rubber Additives Market Revenue (Million), by Application 2025 & 2033
- Figure 37: Middle East and Africa Rubber Additives Market Revenue Share (%), by Application 2025 & 2033
- Figure 38: Middle East and Africa Rubber Additives Market Revenue (Million), by Fillers 2025 & 2033
- Figure 39: Middle East and Africa Rubber Additives Market Revenue Share (%), by Fillers 2025 & 2033
- Figure 40: Middle East and Africa Rubber Additives Market Revenue (Million), by Country 2025 & 2033
- Figure 41: Middle East and Africa Rubber Additives Market Revenue Share (%), by Country 2025 & 2033
List of Tables
- Table 1: Global Rubber Additives Market Revenue Million Forecast, by Type 2020 & 2033
- Table 2: Global Rubber Additives Market Revenue Million Forecast, by Application 2020 & 2033
- Table 3: Global Rubber Additives Market Revenue Million Forecast, by Fillers 2020 & 2033
- Table 4: Global Rubber Additives Market Revenue Million Forecast, by Region 2020 & 2033
- Table 5: Global Rubber Additives Market Revenue Million Forecast, by Type 2020 & 2033
- Table 6: Global Rubber Additives Market Revenue Million Forecast, by Application 2020 & 2033
- Table 7: Global Rubber Additives Market Revenue Million Forecast, by Fillers 2020 & 2033
- Table 8: Global Rubber Additives Market Revenue Million Forecast, by Country 2020 & 2033
- Table 9: China Rubber Additives Market Revenue (Million) Forecast, by Application 2020 & 2033
- Table 10: India Rubber Additives Market Revenue (Million) Forecast, by Application 2020 & 2033
- Table 11: Japan Rubber Additives Market Revenue (Million) Forecast, by Application 2020 & 2033
- Table 12: South Korea Rubber Additives Market Revenue (Million) Forecast, by Application 2020 & 2033
- Table 13: Rest of Asia Pacific Rubber Additives Market Revenue (Million) Forecast, by Application 2020 & 2033
- Table 14: Global Rubber Additives Market Revenue Million Forecast, by Type 2020 & 2033
- Table 15: Global Rubber Additives Market Revenue Million Forecast, by Application 2020 & 2033
- Table 16: Global Rubber Additives Market Revenue Million Forecast, by Fillers 2020 & 2033
- Table 17: Global Rubber Additives Market Revenue Million Forecast, by Country 2020 & 2033
- Table 18: United States Rubber Additives Market Revenue (Million) Forecast, by Application 2020 & 2033
- Table 19: Canada Rubber Additives Market Revenue (Million) Forecast, by Application 2020 & 2033
- Table 20: Mexico Rubber Additives Market Revenue (Million) Forecast, by Application 2020 & 2033
- Table 21: Global Rubber Additives Market Revenue Million Forecast, by Type 2020 & 2033
- Table 22: Global Rubber Additives Market Revenue Million Forecast, by Application 2020 & 2033
- Table 23: Global Rubber Additives Market Revenue Million Forecast, by Fillers 2020 & 2033
- Table 24: Global Rubber Additives Market Revenue Million Forecast, by Country 2020 & 2033
- Table 25: Germany Rubber Additives Market Revenue (Million) Forecast, by Application 2020 & 2033
- Table 26: United Kingdom Rubber Additives Market Revenue (Million) Forecast, by Application 2020 & 2033
- Table 27: France Rubber Additives Market Revenue (Million) Forecast, by Application 2020 & 2033
- Table 28: Italy Rubber Additives Market Revenue (Million) Forecast, by Application 2020 & 2033
- Table 29: Rest of Europe Rubber Additives Market Revenue (Million) Forecast, by Application 2020 & 2033
- Table 30: Global Rubber Additives Market Revenue Million Forecast, by Type 2020 & 2033
- Table 31: Global Rubber Additives Market Revenue Million Forecast, by Application 2020 & 2033
- Table 32: Global Rubber Additives Market Revenue Million Forecast, by Fillers 2020 & 2033
- Table 33: Global Rubber Additives Market Revenue Million Forecast, by Country 2020 & 2033
- Table 34: Brazil Rubber Additives Market Revenue (Million) Forecast, by Application 2020 & 2033
- Table 35: Argentina Rubber Additives Market Revenue (Million) Forecast, by Application 2020 & 2033
- Table 36: Rest of South America Rubber Additives Market Revenue (Million) Forecast, by Application 2020 & 2033
- Table 37: Global Rubber Additives Market Revenue Million Forecast, by Type 2020 & 2033
- Table 38: Global Rubber Additives Market Revenue Million Forecast, by Application 2020 & 2033
- Table 39: Global Rubber Additives Market Revenue Million Forecast, by Fillers 2020 & 2033
- Table 40: Global Rubber Additives Market Revenue Million Forecast, by Country 2020 & 2033
- Table 41: Saudi Arabia Rubber Additives Market Revenue (Million) Forecast, by Application 2020 & 2033
- Table 42: South Africa Rubber Additives Market Revenue (Million) Forecast, by Application 2020 & 2033
- Table 43: Rest of Middle East and Africa Rubber Additives Market Revenue (Million) Forecast, by Application 2020 & 2033
Frequently Asked Questions
1. What is the projected Compound Annual Growth Rate (CAGR) of the Rubber Additives Market?
The projected CAGR is approximately 4.32%.
2. Which companies are prominent players in the Rubber Additives Market?
Key companies in the market include Sumitomo Chemical Co Ltd, PUKHRAJ ZINCOLET, Kemai Chemical Co Ltd, NOCIL LIMITED, MLPC International (Arkema Group), Emery Oleochemicals, BASF SE, China Sunsine Chemical Holdings Limited, Thomas Swan & Co Ltd*List Not Exhaustive, Eastman Chemical Company, Behn Meyer, Rhein Chemie (Lanxess), China Petrochemical Corporation (SINOPEC).
3. What are the main segments of the Rubber Additives Market?
The market segments include Type, Application, Fillers.
4. Can you provide details about the market size?
The market size is estimated to be USD 5.87 Million as of 2022.
5. What are some drivers contributing to market growth?
Growth in the Tire and Rubber Industry; Growing Demand from the Non-Tire Segment in the Construction Industry; Other Drivers.
6. What are the notable trends driving market growth?
Tire Segment to Dominate the Market.
7. Are there any restraints impacting market growth?
Environmental Constraints Pertaining to Rubber Chemicals; Other Restraints.
8. Can you provide examples of recent developments in the market?
In February 2023, The Yokohama Rubber Co., Ltd. (YRC) announced details of its 2023 expansion program following the completion of its ongoing medium-term business plan Under Yokohama Transformation 2023 (YX2023). The project includes an expansion of passenger car tire production capacity in India, increasing the Group's production by 60% to 4.5 million units per year.
9. What pricing options are available for accessing the report?
Pricing options include single-user, multi-user, and enterprise licenses priced at USD 4750, USD 5250, and USD 8750 respectively.
10. Is the market size provided in terms of value or volume?
The market size is provided in terms of value, measured in Million.
11. Are there any specific market keywords associated with the report?
Yes, the market keyword associated with the report is "Rubber Additives Market," which aids in identifying and referencing the specific market segment covered.
12. How do I determine which pricing option suits my needs best?
The pricing options vary based on user requirements and access needs. Individual users may opt for single-user licenses, while businesses requiring broader access may choose multi-user or enterprise licenses for cost-effective access to the report.
13. Are there any additional resources or data provided in the Rubber Additives Market report?
While the report offers comprehensive insights, it's advisable to review the specific contents or supplementary materials provided to ascertain if additional resources or data are available.
14. How can I stay updated on further developments or reports in the Rubber Additives Market?
To stay informed about further developments, trends, and reports in the Rubber Additives Market, consider subscribing to industry newsletters, following relevant companies and organizations, or regularly checking reputable industry news sources and publications.
Methodology
Step 1 - Identification of Relevant Samples Size from Population Database


Step 2 - Approaches for Defining Global Market Size (Value, Volume* & Price*)

Note*: In applicable scenarios
Step 3 - Data Sources
Primary Research
- Web Analytics
- Survey Reports
- Research Institute
- Latest Research Reports
- Opinion Leaders
Secondary Research
- Annual Reports
- White Paper
- Latest Press Release
- Industry Association
- Paid Database
- Investor Presentations

Step 4 - Data Triangulation
Involves using different sources of information in order to increase the validity of a study
These sources are likely to be stakeholders in a program - participants, other researchers, program staff, other community members, and so on.
Then we put all data in single framework & apply various statistical tools to find out the dynamic on the market.
During the analysis stage, feedback from the stakeholder groups would be compared to determine areas of agreement as well as areas of divergence