

Key Insights
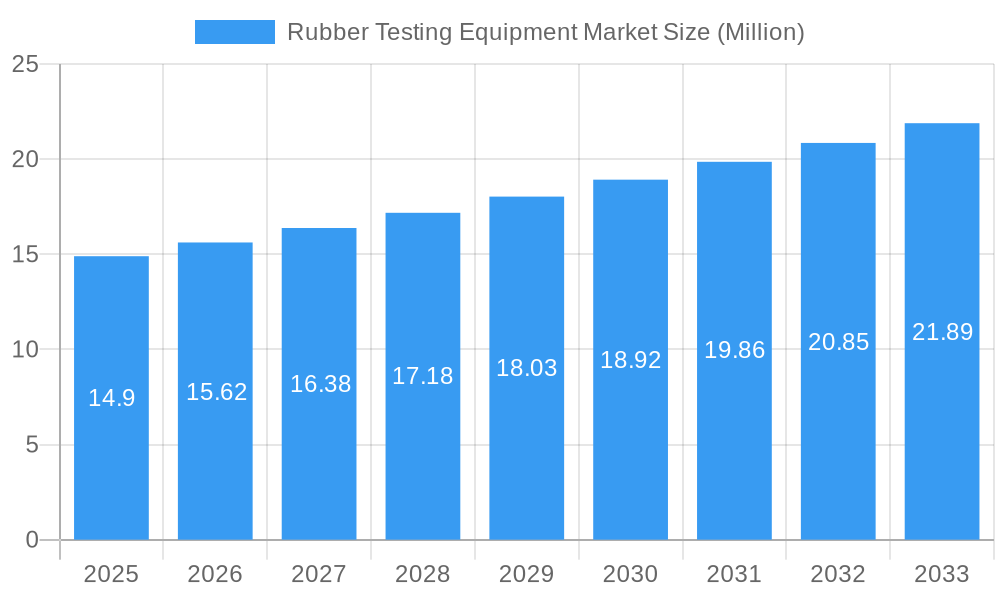
The global Rubber Testing Equipment market is poised for steady growth, projected to reach $14.90 million in 2025 and maintain a Compound Annual Growth Rate (CAGR) of 4.70% from 2025 to 2033. This expansion is driven by several key factors. Firstly, the increasing demand for high-quality rubber products across diverse industries, such as automotive (tires), construction (industrial rubber goods), and consumer goods (general rubber goods), necessitates rigorous quality control and testing. This translates into a higher demand for sophisticated and reliable testing equipment. Secondly, advancements in material science and the development of new rubber compounds are pushing the boundaries of performance and durability, requiring more advanced testing methodologies and equipment to ensure compliance with stringent safety and performance standards. Stringent regulations regarding product safety and quality further contribute to the market's growth, mandating comprehensive testing procedures. Finally, the growing adoption of automation and digitalization in manufacturing processes is driving demand for automated and data-driven rubber testing equipment.
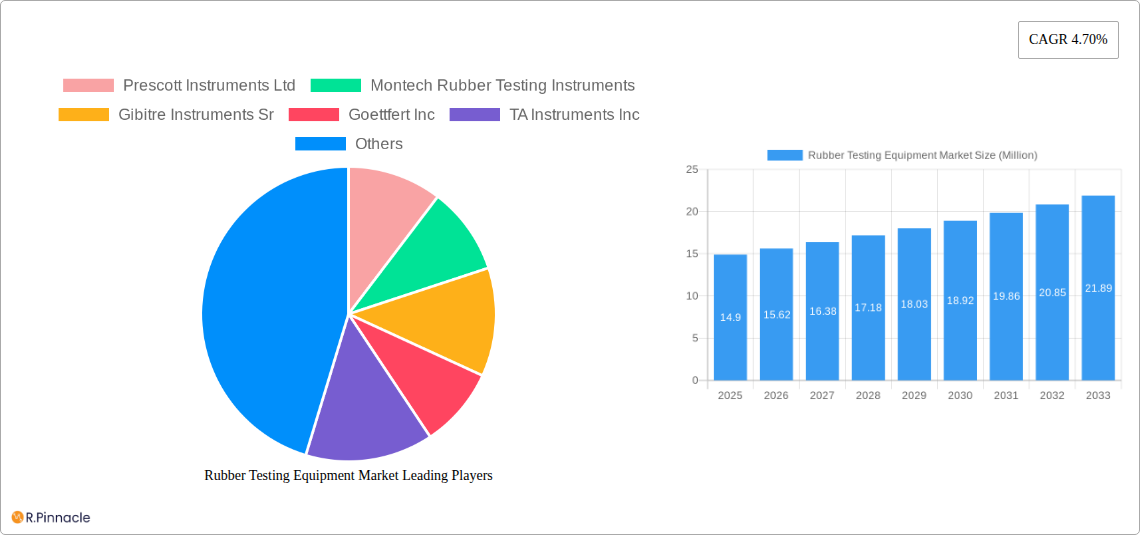
Rubber Testing Equipment Market Market Size (In Million)
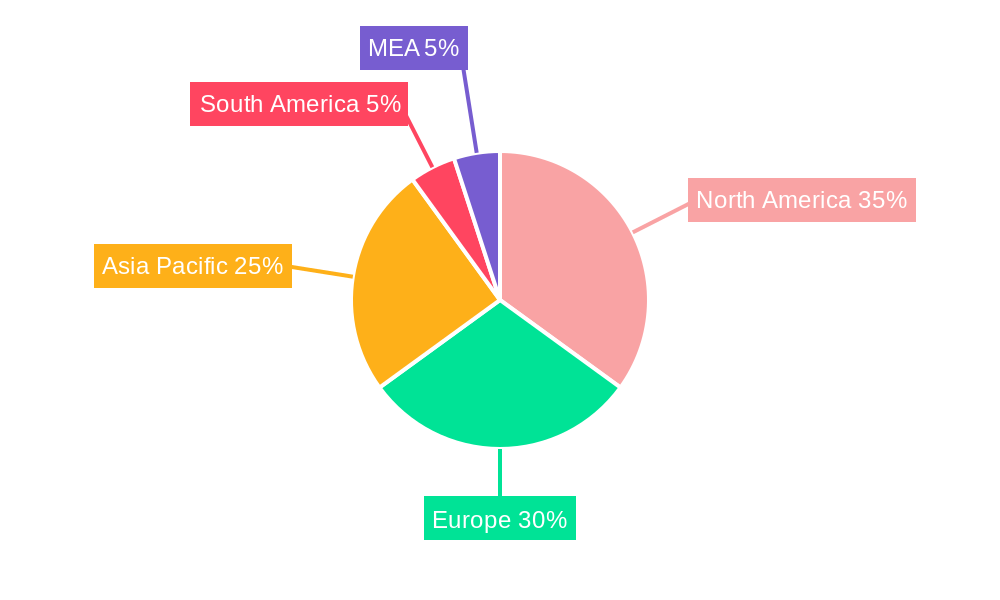
However, market growth is not without its challenges. The high initial investment cost associated with purchasing advanced testing equipment can be a significant barrier to entry for small and medium-sized enterprises (SMEs). Additionally, the complexity of operation and maintenance of some high-end equipment necessitates skilled technicians, potentially increasing operational costs. Nevertheless, the long-term benefits of improved product quality, reduced production defects, and enhanced safety compliance are likely to outweigh these initial hurdles. Furthermore, the market is segmented by testing type (density, viscosity, hardness, flex, and others) and end-user application (tires, general rubber goods, industrial rubber products, and general polymers/compounds), providing opportunities for specialized equipment manufacturers to cater to specific niche demands. The geographical distribution of the market is expected to be influenced by the growth of manufacturing hubs in regions like Asia-Pacific and continued strong demand from North America and Europe.
Rubber Testing Equipment Market Company Market Share
Rubber Testing Equipment Market: A Comprehensive Report (2019-2033)
This comprehensive report provides an in-depth analysis of the Rubber Testing Equipment market, offering valuable insights for industry professionals, investors, and strategic decision-makers. Covering the period from 2019 to 2033, with a base year of 2025 and a forecast period of 2025-2033, this report unveils the market's structure, dynamics, dominant segments, and future outlook. The market is projected to reach xx Million by 2033, exhibiting a CAGR of xx% during the forecast period.
Rubber Testing Equipment Market Structure & Innovation Trends
The Rubber Testing Equipment market exhibits a moderately fragmented structure, with several key players competing for market share. Prescott Instruments Ltd, Montech Rubber Testing Instruments, Gibitre Instruments Sr, Goettfert Inc, TA Instruments Inc, Alpha Technologies, U-Can Dynatex Inc, Norka Instruments Shanghai Ltd, Ektron Tek Co Ltd, and Gotech Testing Machines are among the prominent companies shaping the market landscape. Market share is currently estimated at xx% for the top 5 players, with the remaining share distributed amongst smaller players and new entrants.
Innovation is a key driver, fueled by the need for improved accuracy, efficiency, and automation in rubber testing. Stringent regulatory frameworks regarding material safety and quality control further necessitate advanced testing equipment. The market witnesses continuous product development, focusing on features like enhanced data analysis capabilities, improved durability, and user-friendly interfaces. The presence of substitute materials and technologies also plays a crucial role, influencing market dynamics. The rising adoption of digital technologies such as AI and machine learning to enhance data analysis and automation of testing processes is also contributing to innovation. M&A activities within the market remain moderate, with deal values averaging xx Million in recent years.
Rubber Testing Equipment Market Dynamics & Trends
The Rubber Testing Equipment market is experiencing robust growth, primarily driven by increasing demand from the automotive, aerospace, and construction industries. The expanding global tire industry, coupled with the growing adoption of high-performance rubber materials in various applications, is a major catalyst for market expansion. Technological advancements, such as the development of non-destructive testing methods and the integration of advanced sensors, are enhancing the efficiency and precision of rubber testing. Consumer preferences towards higher quality and safer rubber products further fuel the demand for sophisticated testing equipment. The growing focus on environmental sustainability is also influencing the market, driving the adoption of eco-friendly testing methods and materials. Intense competition among established players and new entrants fuels innovation and drives down prices, benefiting end-users. The market penetration rate for automated testing systems is projected to reach xx% by 2033.
Dominant Regions & Segments in Rubber Testing Equipment Market
The Asia-Pacific region continues to assert its dominance in the global Rubber Testing Equipment market. This leadership is primarily fueled by accelerated industrialization, a significant surge in automotive production, and the ever-growing demand for comprehensive infrastructure development across the region. China and India stand out as pivotal contributors to this sustained regional leadership, showcasing robust market activity and expansion.
Key Drivers Propelling Asia-Pacific's Dominance:
- Supportive Government Policies: Proactive and favorable government initiatives actively promoting industrial expansion and innovation.
- Aggressive Infrastructure Development: Large-scale and ongoing investment in infrastructure projects, requiring extensive use of rubber components.
- Thriving Automotive and Tire Sectors: Continuous growth and expansion of the automotive manufacturing industry and its critical supply chain, particularly the tire sector.
- Increasing Awareness of Quality Standards: A growing emphasis on product quality and safety across various manufacturing sectors.
Segment Dominance Insights:
By Type of Testing: Hardness testing commands the largest market share. This is largely attributed to its fundamental importance and widespread application across a diverse range of rubber product manufacturing, from simple components to complex industrial materials.
By End-user Application: The tire industry unequivocally leads the market, followed closely by general rubber goods and industrial rubber products. This preeminence is driven by the exceptionally stringent quality control and safety regulations mandated within these sectors, necessitating rigorous and consistent testing protocols.
A comprehensive and in-depth analysis of the dominance across each specific segment and region is thoroughly detailed within the full market report.
Rubber Testing Equipment Market Product Innovations
Recent innovations include the development of portable and compact testing devices, improved data acquisition systems, and advanced software for comprehensive data analysis. These innovations cater to the increasing demand for faster, more accurate, and user-friendly testing solutions. Furthermore, the integration of artificial intelligence and machine learning is enhancing the automation and efficiency of rubber testing processes, leading to improved productivity and reduced operational costs. These developments reflect the market's continuous efforts to improve testing methods and meet the evolving needs of end-users.
Report Scope & Segmentation Analysis
This report segments the Rubber Testing Equipment market by type of testing (Density Testing, Viscosity Testing, Hardness Testing, Flex Testing, Other Types of Testing) and by end-user application (Tire, General Rubber Goods, Industrial Rubber Products, General Polymer, Compound). Each segment is analyzed based on its growth projections, market size, and competitive dynamics. Detailed market size and growth projections for each segment are presented in the full report. For example, the Hardness testing segment is expected to grow at a CAGR of xx% during the forecast period, while the Tire industry segment is expected to reach xx Million by 2033.
Key Drivers of Rubber Testing Equipment Market Growth
The Rubber Testing Equipment market is experiencing robust expansion, propelled by a confluence of influential factors. Foremost among these are the relentless technological advancements, which are continuously ushering in more precise, efficient, and sophisticated testing methodologies. Simultaneously, significant economic growth in developing economies is directly translating into a heightened demand for a wide array of rubber products, consequently necessitating the establishment of more advanced and reliable testing infrastructure. Furthermore, stringent government regulations concerning product quality, safety, and environmental impact are compelling manufacturers to adopt cutting-edge testing equipment to ensure compliance and market access. The sustained and dynamic growth of the automotive and tire industries remains a foundational contributor to the overall market demand, as these sectors rely heavily on the performance and durability of rubber components.
Challenges in the Rubber Testing Equipment Market Sector
While growth is evident, the Rubber Testing Equipment market navigates a landscape marked by several significant challenges. The high initial investment costs associated with acquiring sophisticated and advanced testing equipment can present a considerable barrier, particularly for small and medium-sized enterprises (SMEs) looking to upgrade their capabilities. The industry also remains susceptible to supply chain disruptions, which can impact the timely availability and cost of essential raw materials and specialized components crucial for manufacturing testing equipment. Moreover, the intense competition among a mix of established market leaders and emerging new entrants often leads to significant price pressures, potentially affecting profit margins. Navigating and adhering to complex regulatory compliance requirements, both for the equipment itself and for the testing standards it facilitates, adds another layer of operational complexity and cost to manufacturers and users alike.
Emerging Opportunities in Rubber Testing Equipment Market
The market presents several opportunities. The growing adoption of automation and AI in the testing process offers considerable potential for growth. Emerging economies offer expanding markets for rubber testing equipment, particularly in rapidly developing industrial sectors. The development of eco-friendly and sustainable testing methods holds immense potential for future growth. The increasing demand for high-performance rubber materials in specialized industries like aerospace and healthcare creates new opportunities.
Leading Players in the Rubber Testing Equipment Market
- Prescott Instruments Ltd
- Montech Rubber Testing Instruments
- Gibitre Instruments Sr
- Goettfert Inc
- TA Instruments Inc
- Alpha Technologies
- U-Can Dynatex Inc
- Norka Instruments Shanghai Ltd
- Ektron Tek Co Ltd
- Gotech Testing Machines
Key Developments in Rubber Testing Equipment Market Industry
- 2022: Goettfert Inc. unveiled an innovative new series of automated hardness testers, significantly enhancing efficiency and accuracy in hardness measurement.
- 2023: Prescott Instruments Ltd. strategically expanded its market footprint and capabilities through the successful acquisition of a prominent smaller competitor, consolidating its industry position.
- 2024: TA Instruments Inc. introduced a groundbreaking new software platform designed for advanced data analysis, offering users deeper insights and improved interpretation of test results. (Further detailed insights into key developments, including specific dates and their demonstrable market impacts, are comprehensively covered in the full market report.)
Future Outlook for Rubber Testing Equipment Market
The trajectory for the Rubber Testing Equipment market is firmly set for sustained and robust growth. This optimistic outlook is underpinned by the continuous evolution of technological advancements, a burgeoning demand from pivotal industries such as automotive, aerospace, and healthcare, and the presence of generally favorable economic conditions globally. To effectively navigate this dynamic landscape and secure a competitive advantage, market players will find it imperative to focus on strategic partnerships, relentless product innovation, and the proactive expansion into promising emerging markets. Furthermore, the escalating global emphasis on sustainable and eco-friendly materials will undoubtedly play a crucial role in shaping the future direction of the market, driving the development of testing equipment capable of evaluating these new material compositions and their performance characteristics.
Rubber Testing Equipment Market Segmentation
-
1. Type of Testing
- 1.1. Density Testing
- 1.2. Viscocity Testing
- 1.3. Hardness Testing
- 1.4. Flex Testing
- 1.5. Other Types of Testing
-
2. End-user Application
- 2.1. Tire
- 2.2. General Rubber Goods
- 2.3. Industrial Rubber Products
- 2.4. General Polymer
- 2.5. Compound
Rubber Testing Equipment Market Segmentation By Geography
- 1. North America
- 2. Europe
- 3. Asia
- 4. Australia and New Zealand
- 5. Latin America
- 6. Middle East and Africa
Rubber Testing Equipment Market Regional Market Share
Geographic Coverage of Rubber Testing Equipment Market
Rubber Testing Equipment Market REPORT HIGHLIGHTS
| Aspects | Details |
|---|---|
| Study Period | 2020-2034 |
| Base Year | 2025 |
| Estimated Year | 2026 |
| Forecast Period | 2026-2034 |
| Historical Period | 2020-2025 |
| Growth Rate | CAGR of 4.70% from 2020-2034 |
| Segmentation |
|
Table of Contents
- 1. Introduction
- 1.1. Research Scope
- 1.2. Market Segmentation
- 1.3. Research Objective
- 1.4. Definitions and Assumptions
- 2. Executive Summary
- 2.1. Market Snapshot
- 3. Market Dynamics
- 3.1. Market Drivers
- 3.2. Market Restrains
- 3.3. Market Trends
- 3.4. Market Opportunities
- 4. Market Factor Analysis
- 4.1. Porters Five Forces
- 4.1.1. Bargaining Power of Suppliers
- 4.1.2. Bargaining Power of Buyers
- 4.1.3. Threat of New Entrants
- 4.1.4. Threat of Substitutes
- 4.1.5. Competitive Rivalry
- 4.2. PESTEL analysis
- 4.3. BCG Analysis
- 4.3.1. Stars (High Growth, High Market Share)
- 4.3.2. Cash Cows (Low Growth, High Market Share)
- 4.3.3. Question Mark (High Growth, Low Market Share)
- 4.3.4. Dogs (Low Growth, Low Market Share)
- 4.4. Ansoff Matrix Analysis
- 4.5. Supply Chain Analysis
- 4.6. Regulatory Landscape
- 4.7. Current Market Potential and Opportunity Assessment (TAM–SAM–SOM Framework)
- 4.8. PRI Analyst Note
- 4.1. Porters Five Forces
- 5. Market Analysis, Insights and Forecast 2021-2033
- 5.1. Market Analysis, Insights and Forecast - by Type of Testing
- 5.1.1. Density Testing
- 5.1.2. Viscocity Testing
- 5.1.3. Hardness Testing
- 5.1.4. Flex Testing
- 5.1.5. Other Types of Testing
- 5.2. Market Analysis, Insights and Forecast - by End-user Application
- 5.2.1. Tire
- 5.2.2. General Rubber Goods
- 5.2.3. Industrial Rubber Products
- 5.2.4. General Polymer
- 5.2.5. Compound
- 5.3. Market Analysis, Insights and Forecast - by Region
- 5.3.1. North America
- 5.3.2. Europe
- 5.3.3. Asia
- 5.3.4. Australia and New Zealand
- 5.3.5. Latin America
- 5.3.6. Middle East and Africa
- 5.1. Market Analysis, Insights and Forecast - by Type of Testing
- 6. Global Rubber Testing Equipment Market Analysis, Insights and Forecast, 2021-2033
- 6.1. Market Analysis, Insights and Forecast - by Type of Testing
- 6.1.1. Density Testing
- 6.1.2. Viscocity Testing
- 6.1.3. Hardness Testing
- 6.1.4. Flex Testing
- 6.1.5. Other Types of Testing
- 6.2. Market Analysis, Insights and Forecast - by End-user Application
- 6.2.1. Tire
- 6.2.2. General Rubber Goods
- 6.2.3. Industrial Rubber Products
- 6.2.4. General Polymer
- 6.2.5. Compound
- 6.1. Market Analysis, Insights and Forecast - by Type of Testing
- 7. North America Rubber Testing Equipment Market Analysis, Insights and Forecast, 2020-2032
- 7.1. Market Analysis, Insights and Forecast - by Type of Testing
- 7.1.1. Density Testing
- 7.1.2. Viscocity Testing
- 7.1.3. Hardness Testing
- 7.1.4. Flex Testing
- 7.1.5. Other Types of Testing
- 7.2. Market Analysis, Insights and Forecast - by End-user Application
- 7.2.1. Tire
- 7.2.2. General Rubber Goods
- 7.2.3. Industrial Rubber Products
- 7.2.4. General Polymer
- 7.2.5. Compound
- 7.1. Market Analysis, Insights and Forecast - by Type of Testing
- 8. Europe Rubber Testing Equipment Market Analysis, Insights and Forecast, 2020-2032
- 8.1. Market Analysis, Insights and Forecast - by Type of Testing
- 8.1.1. Density Testing
- 8.1.2. Viscocity Testing
- 8.1.3. Hardness Testing
- 8.1.4. Flex Testing
- 8.1.5. Other Types of Testing
- 8.2. Market Analysis, Insights and Forecast - by End-user Application
- 8.2.1. Tire
- 8.2.2. General Rubber Goods
- 8.2.3. Industrial Rubber Products
- 8.2.4. General Polymer
- 8.2.5. Compound
- 8.1. Market Analysis, Insights and Forecast - by Type of Testing
- 9. Asia Rubber Testing Equipment Market Analysis, Insights and Forecast, 2020-2032
- 9.1. Market Analysis, Insights and Forecast - by Type of Testing
- 9.1.1. Density Testing
- 9.1.2. Viscocity Testing
- 9.1.3. Hardness Testing
- 9.1.4. Flex Testing
- 9.1.5. Other Types of Testing
- 9.2. Market Analysis, Insights and Forecast - by End-user Application
- 9.2.1. Tire
- 9.2.2. General Rubber Goods
- 9.2.3. Industrial Rubber Products
- 9.2.4. General Polymer
- 9.2.5. Compound
- 9.1. Market Analysis, Insights and Forecast - by Type of Testing
- 10. Australia and New Zealand Rubber Testing Equipment Market Analysis, Insights and Forecast, 2020-2032
- 10.1. Market Analysis, Insights and Forecast - by Type of Testing
- 10.1.1. Density Testing
- 10.1.2. Viscocity Testing
- 10.1.3. Hardness Testing
- 10.1.4. Flex Testing
- 10.1.5. Other Types of Testing
- 10.2. Market Analysis, Insights and Forecast - by End-user Application
- 10.2.1. Tire
- 10.2.2. General Rubber Goods
- 10.2.3. Industrial Rubber Products
- 10.2.4. General Polymer
- 10.2.5. Compound
- 10.1. Market Analysis, Insights and Forecast - by Type of Testing
- 11. Latin America Rubber Testing Equipment Market Analysis, Insights and Forecast, 2020-2032
- 11.1. Market Analysis, Insights and Forecast - by Type of Testing
- 11.1.1. Density Testing
- 11.1.2. Viscocity Testing
- 11.1.3. Hardness Testing
- 11.1.4. Flex Testing
- 11.1.5. Other Types of Testing
- 11.2. Market Analysis, Insights and Forecast - by End-user Application
- 11.2.1. Tire
- 11.2.2. General Rubber Goods
- 11.2.3. Industrial Rubber Products
- 11.2.4. General Polymer
- 11.2.5. Compound
- 11.1. Market Analysis, Insights and Forecast - by Type of Testing
- 12. Middle East and Africa Rubber Testing Equipment Market Analysis, Insights and Forecast, 2020-2032
- 12.1. Market Analysis, Insights and Forecast - by Type of Testing
- 12.1.1. Density Testing
- 12.1.2. Viscocity Testing
- 12.1.3. Hardness Testing
- 12.1.4. Flex Testing
- 12.1.5. Other Types of Testing
- 12.2. Market Analysis, Insights and Forecast - by End-user Application
- 12.2.1. Tire
- 12.2.2. General Rubber Goods
- 12.2.3. Industrial Rubber Products
- 12.2.4. General Polymer
- 12.2.5. Compound
- 12.1. Market Analysis, Insights and Forecast - by Type of Testing
- 13. Competitive Analysis
- 13.1. Company Profiles
- 13.1.1 Prescott Instruments Ltd
- 13.1.1.1. Company Overview
- 13.1.1.2. Products
- 13.1.1.3. Company Financials
- 13.1.1.4. SWOT Analysis
- 13.1.2 Montech Rubber Testing Instruments
- 13.1.2.1. Company Overview
- 13.1.2.2. Products
- 13.1.2.3. Company Financials
- 13.1.2.4. SWOT Analysis
- 13.1.3 Gibitre Instruments Sr
- 13.1.3.1. Company Overview
- 13.1.3.2. Products
- 13.1.3.3. Company Financials
- 13.1.3.4. SWOT Analysis
- 13.1.4 Goettfert Inc
- 13.1.4.1. Company Overview
- 13.1.4.2. Products
- 13.1.4.3. Company Financials
- 13.1.4.4. SWOT Analysis
- 13.1.5 TA Instruments Inc
- 13.1.5.1. Company Overview
- 13.1.5.2. Products
- 13.1.5.3. Company Financials
- 13.1.5.4. SWOT Analysis
- 13.1.6 Alpha Technologies
- 13.1.6.1. Company Overview
- 13.1.6.2. Products
- 13.1.6.3. Company Financials
- 13.1.6.4. SWOT Analysis
- 13.1.7 U-Can Dynatex Inc
- 13.1.7.1. Company Overview
- 13.1.7.2. Products
- 13.1.7.3. Company Financials
- 13.1.7.4. SWOT Analysis
- 13.1.8 Norka Instruments Sanghai Ltd
- 13.1.8.1. Company Overview
- 13.1.8.2. Products
- 13.1.8.3. Company Financials
- 13.1.8.4. SWOT Analysis
- 13.1.9 Ektron Tek Co Ltd
- 13.1.9.1. Company Overview
- 13.1.9.2. Products
- 13.1.9.3. Company Financials
- 13.1.9.4. SWOT Analysis
- 13.1.10 Gotech Testing Machines
- 13.1.10.1. Company Overview
- 13.1.10.2. Products
- 13.1.10.3. Company Financials
- 13.1.10.4. SWOT Analysis
- 13.1.1 Prescott Instruments Ltd
- 13.2. Market Entropy
- 13.2.1 Company's Key Areas Served
- 13.2.2 Recent Developments
- 13.3. Company Market Share Analysis 2025
- 13.3.1 Top 5 Companies Market Share Analysis
- 13.3.2 Top 3 Companies Market Share Analysis
- 13.4. List of Potential Customers
- 14. Research Methodology
List of Figures
- Figure 1: Global Rubber Testing Equipment Market Revenue Breakdown (Million, %) by Region 2025 & 2033
- Figure 2: Global Rubber Testing Equipment Market Volume Breakdown (K Unit, %) by Region 2025 & 2033
- Figure 3: North America Rubber Testing Equipment Market Revenue (Million), by Type of Testing 2025 & 2033
- Figure 4: North America Rubber Testing Equipment Market Volume (K Unit), by Type of Testing 2025 & 2033
- Figure 5: North America Rubber Testing Equipment Market Revenue Share (%), by Type of Testing 2025 & 2033
- Figure 6: North America Rubber Testing Equipment Market Volume Share (%), by Type of Testing 2025 & 2033
- Figure 7: North America Rubber Testing Equipment Market Revenue (Million), by End-user Application 2025 & 2033
- Figure 8: North America Rubber Testing Equipment Market Volume (K Unit), by End-user Application 2025 & 2033
- Figure 9: North America Rubber Testing Equipment Market Revenue Share (%), by End-user Application 2025 & 2033
- Figure 10: North America Rubber Testing Equipment Market Volume Share (%), by End-user Application 2025 & 2033
- Figure 11: North America Rubber Testing Equipment Market Revenue (Million), by Country 2025 & 2033
- Figure 12: North America Rubber Testing Equipment Market Volume (K Unit), by Country 2025 & 2033
- Figure 13: North America Rubber Testing Equipment Market Revenue Share (%), by Country 2025 & 2033
- Figure 14: North America Rubber Testing Equipment Market Volume Share (%), by Country 2025 & 2033
- Figure 15: Europe Rubber Testing Equipment Market Revenue (Million), by Type of Testing 2025 & 2033
- Figure 16: Europe Rubber Testing Equipment Market Volume (K Unit), by Type of Testing 2025 & 2033
- Figure 17: Europe Rubber Testing Equipment Market Revenue Share (%), by Type of Testing 2025 & 2033
- Figure 18: Europe Rubber Testing Equipment Market Volume Share (%), by Type of Testing 2025 & 2033
- Figure 19: Europe Rubber Testing Equipment Market Revenue (Million), by End-user Application 2025 & 2033
- Figure 20: Europe Rubber Testing Equipment Market Volume (K Unit), by End-user Application 2025 & 2033
- Figure 21: Europe Rubber Testing Equipment Market Revenue Share (%), by End-user Application 2025 & 2033
- Figure 22: Europe Rubber Testing Equipment Market Volume Share (%), by End-user Application 2025 & 2033
- Figure 23: Europe Rubber Testing Equipment Market Revenue (Million), by Country 2025 & 2033
- Figure 24: Europe Rubber Testing Equipment Market Volume (K Unit), by Country 2025 & 2033
- Figure 25: Europe Rubber Testing Equipment Market Revenue Share (%), by Country 2025 & 2033
- Figure 26: Europe Rubber Testing Equipment Market Volume Share (%), by Country 2025 & 2033
- Figure 27: Asia Rubber Testing Equipment Market Revenue (Million), by Type of Testing 2025 & 2033
- Figure 28: Asia Rubber Testing Equipment Market Volume (K Unit), by Type of Testing 2025 & 2033
- Figure 29: Asia Rubber Testing Equipment Market Revenue Share (%), by Type of Testing 2025 & 2033
- Figure 30: Asia Rubber Testing Equipment Market Volume Share (%), by Type of Testing 2025 & 2033
- Figure 31: Asia Rubber Testing Equipment Market Revenue (Million), by End-user Application 2025 & 2033
- Figure 32: Asia Rubber Testing Equipment Market Volume (K Unit), by End-user Application 2025 & 2033
- Figure 33: Asia Rubber Testing Equipment Market Revenue Share (%), by End-user Application 2025 & 2033
- Figure 34: Asia Rubber Testing Equipment Market Volume Share (%), by End-user Application 2025 & 2033
- Figure 35: Asia Rubber Testing Equipment Market Revenue (Million), by Country 2025 & 2033
- Figure 36: Asia Rubber Testing Equipment Market Volume (K Unit), by Country 2025 & 2033
- Figure 37: Asia Rubber Testing Equipment Market Revenue Share (%), by Country 2025 & 2033
- Figure 38: Asia Rubber Testing Equipment Market Volume Share (%), by Country 2025 & 2033
- Figure 39: Australia and New Zealand Rubber Testing Equipment Market Revenue (Million), by Type of Testing 2025 & 2033
- Figure 40: Australia and New Zealand Rubber Testing Equipment Market Volume (K Unit), by Type of Testing 2025 & 2033
- Figure 41: Australia and New Zealand Rubber Testing Equipment Market Revenue Share (%), by Type of Testing 2025 & 2033
- Figure 42: Australia and New Zealand Rubber Testing Equipment Market Volume Share (%), by Type of Testing 2025 & 2033
- Figure 43: Australia and New Zealand Rubber Testing Equipment Market Revenue (Million), by End-user Application 2025 & 2033
- Figure 44: Australia and New Zealand Rubber Testing Equipment Market Volume (K Unit), by End-user Application 2025 & 2033
- Figure 45: Australia and New Zealand Rubber Testing Equipment Market Revenue Share (%), by End-user Application 2025 & 2033
- Figure 46: Australia and New Zealand Rubber Testing Equipment Market Volume Share (%), by End-user Application 2025 & 2033
- Figure 47: Australia and New Zealand Rubber Testing Equipment Market Revenue (Million), by Country 2025 & 2033
- Figure 48: Australia and New Zealand Rubber Testing Equipment Market Volume (K Unit), by Country 2025 & 2033
- Figure 49: Australia and New Zealand Rubber Testing Equipment Market Revenue Share (%), by Country 2025 & 2033
- Figure 50: Australia and New Zealand Rubber Testing Equipment Market Volume Share (%), by Country 2025 & 2033
- Figure 51: Latin America Rubber Testing Equipment Market Revenue (Million), by Type of Testing 2025 & 2033
- Figure 52: Latin America Rubber Testing Equipment Market Volume (K Unit), by Type of Testing 2025 & 2033
- Figure 53: Latin America Rubber Testing Equipment Market Revenue Share (%), by Type of Testing 2025 & 2033
- Figure 54: Latin America Rubber Testing Equipment Market Volume Share (%), by Type of Testing 2025 & 2033
- Figure 55: Latin America Rubber Testing Equipment Market Revenue (Million), by End-user Application 2025 & 2033
- Figure 56: Latin America Rubber Testing Equipment Market Volume (K Unit), by End-user Application 2025 & 2033
- Figure 57: Latin America Rubber Testing Equipment Market Revenue Share (%), by End-user Application 2025 & 2033
- Figure 58: Latin America Rubber Testing Equipment Market Volume Share (%), by End-user Application 2025 & 2033
- Figure 59: Latin America Rubber Testing Equipment Market Revenue (Million), by Country 2025 & 2033
- Figure 60: Latin America Rubber Testing Equipment Market Volume (K Unit), by Country 2025 & 2033
- Figure 61: Latin America Rubber Testing Equipment Market Revenue Share (%), by Country 2025 & 2033
- Figure 62: Latin America Rubber Testing Equipment Market Volume Share (%), by Country 2025 & 2033
- Figure 63: Middle East and Africa Rubber Testing Equipment Market Revenue (Million), by Type of Testing 2025 & 2033
- Figure 64: Middle East and Africa Rubber Testing Equipment Market Volume (K Unit), by Type of Testing 2025 & 2033
- Figure 65: Middle East and Africa Rubber Testing Equipment Market Revenue Share (%), by Type of Testing 2025 & 2033
- Figure 66: Middle East and Africa Rubber Testing Equipment Market Volume Share (%), by Type of Testing 2025 & 2033
- Figure 67: Middle East and Africa Rubber Testing Equipment Market Revenue (Million), by End-user Application 2025 & 2033
- Figure 68: Middle East and Africa Rubber Testing Equipment Market Volume (K Unit), by End-user Application 2025 & 2033
- Figure 69: Middle East and Africa Rubber Testing Equipment Market Revenue Share (%), by End-user Application 2025 & 2033
- Figure 70: Middle East and Africa Rubber Testing Equipment Market Volume Share (%), by End-user Application 2025 & 2033
- Figure 71: Middle East and Africa Rubber Testing Equipment Market Revenue (Million), by Country 2025 & 2033
- Figure 72: Middle East and Africa Rubber Testing Equipment Market Volume (K Unit), by Country 2025 & 2033
- Figure 73: Middle East and Africa Rubber Testing Equipment Market Revenue Share (%), by Country 2025 & 2033
- Figure 74: Middle East and Africa Rubber Testing Equipment Market Volume Share (%), by Country 2025 & 2033
List of Tables
- Table 1: Global Rubber Testing Equipment Market Revenue Million Forecast, by Type of Testing 2020 & 2033
- Table 2: Global Rubber Testing Equipment Market Volume K Unit Forecast, by Type of Testing 2020 & 2033
- Table 3: Global Rubber Testing Equipment Market Revenue Million Forecast, by End-user Application 2020 & 2033
- Table 4: Global Rubber Testing Equipment Market Volume K Unit Forecast, by End-user Application 2020 & 2033
- Table 5: Global Rubber Testing Equipment Market Revenue Million Forecast, by Region 2020 & 2033
- Table 6: Global Rubber Testing Equipment Market Volume K Unit Forecast, by Region 2020 & 2033
- Table 7: Global Rubber Testing Equipment Market Revenue Million Forecast, by Type of Testing 2020 & 2033
- Table 8: Global Rubber Testing Equipment Market Volume K Unit Forecast, by Type of Testing 2020 & 2033
- Table 9: Global Rubber Testing Equipment Market Revenue Million Forecast, by End-user Application 2020 & 2033
- Table 10: Global Rubber Testing Equipment Market Volume K Unit Forecast, by End-user Application 2020 & 2033
- Table 11: Global Rubber Testing Equipment Market Revenue Million Forecast, by Country 2020 & 2033
- Table 12: Global Rubber Testing Equipment Market Volume K Unit Forecast, by Country 2020 & 2033
- Table 13: Global Rubber Testing Equipment Market Revenue Million Forecast, by Type of Testing 2020 & 2033
- Table 14: Global Rubber Testing Equipment Market Volume K Unit Forecast, by Type of Testing 2020 & 2033
- Table 15: Global Rubber Testing Equipment Market Revenue Million Forecast, by End-user Application 2020 & 2033
- Table 16: Global Rubber Testing Equipment Market Volume K Unit Forecast, by End-user Application 2020 & 2033
- Table 17: Global Rubber Testing Equipment Market Revenue Million Forecast, by Country 2020 & 2033
- Table 18: Global Rubber Testing Equipment Market Volume K Unit Forecast, by Country 2020 & 2033
- Table 19: Global Rubber Testing Equipment Market Revenue Million Forecast, by Type of Testing 2020 & 2033
- Table 20: Global Rubber Testing Equipment Market Volume K Unit Forecast, by Type of Testing 2020 & 2033
- Table 21: Global Rubber Testing Equipment Market Revenue Million Forecast, by End-user Application 2020 & 2033
- Table 22: Global Rubber Testing Equipment Market Volume K Unit Forecast, by End-user Application 2020 & 2033
- Table 23: Global Rubber Testing Equipment Market Revenue Million Forecast, by Country 2020 & 2033
- Table 24: Global Rubber Testing Equipment Market Volume K Unit Forecast, by Country 2020 & 2033
- Table 25: Global Rubber Testing Equipment Market Revenue Million Forecast, by Type of Testing 2020 & 2033
- Table 26: Global Rubber Testing Equipment Market Volume K Unit Forecast, by Type of Testing 2020 & 2033
- Table 27: Global Rubber Testing Equipment Market Revenue Million Forecast, by End-user Application 2020 & 2033
- Table 28: Global Rubber Testing Equipment Market Volume K Unit Forecast, by End-user Application 2020 & 2033
- Table 29: Global Rubber Testing Equipment Market Revenue Million Forecast, by Country 2020 & 2033
- Table 30: Global Rubber Testing Equipment Market Volume K Unit Forecast, by Country 2020 & 2033
- Table 31: Global Rubber Testing Equipment Market Revenue Million Forecast, by Type of Testing 2020 & 2033
- Table 32: Global Rubber Testing Equipment Market Volume K Unit Forecast, by Type of Testing 2020 & 2033
- Table 33: Global Rubber Testing Equipment Market Revenue Million Forecast, by End-user Application 2020 & 2033
- Table 34: Global Rubber Testing Equipment Market Volume K Unit Forecast, by End-user Application 2020 & 2033
- Table 35: Global Rubber Testing Equipment Market Revenue Million Forecast, by Country 2020 & 2033
- Table 36: Global Rubber Testing Equipment Market Volume K Unit Forecast, by Country 2020 & 2033
- Table 37: Global Rubber Testing Equipment Market Revenue Million Forecast, by Type of Testing 2020 & 2033
- Table 38: Global Rubber Testing Equipment Market Volume K Unit Forecast, by Type of Testing 2020 & 2033
- Table 39: Global Rubber Testing Equipment Market Revenue Million Forecast, by End-user Application 2020 & 2033
- Table 40: Global Rubber Testing Equipment Market Volume K Unit Forecast, by End-user Application 2020 & 2033
- Table 41: Global Rubber Testing Equipment Market Revenue Million Forecast, by Country 2020 & 2033
- Table 42: Global Rubber Testing Equipment Market Volume K Unit Forecast, by Country 2020 & 2033
Frequently Asked Questions
1. What is the projected Compound Annual Growth Rate (CAGR) of the Rubber Testing Equipment Market?
The projected CAGR is approximately 4.70%.
2. Which companies are prominent players in the Rubber Testing Equipment Market?
Key companies in the market include Prescott Instruments Ltd, Montech Rubber Testing Instruments, Gibitre Instruments Sr, Goettfert Inc, TA Instruments Inc, Alpha Technologies, U-Can Dynatex Inc, Norka Instruments Sanghai Ltd, Ektron Tek Co Ltd, Gotech Testing Machines.
3. What are the main segments of the Rubber Testing Equipment Market?
The market segments include Type of Testing, End-user Application.
4. Can you provide details about the market size?
The market size is estimated to be USD 14.90 Million as of 2022.
5. What are some drivers contributing to market growth?
Growing Demand for Durable Goods; Technological Advancements in Rubber Testing.
6. What are the notable trends driving market growth?
The Rising Demand for Tires to Drive the Market.
7. Are there any restraints impacting market growth?
High Cost of Ownership.
8. Can you provide examples of recent developments in the market?
N/A
9. What pricing options are available for accessing the report?
Pricing options include single-user, multi-user, and enterprise licenses priced at USD 4750, USD 5250, and USD 8750 respectively.
10. Is the market size provided in terms of value or volume?
The market size is provided in terms of value, measured in Million and volume, measured in K Unit.
11. Are there any specific market keywords associated with the report?
Yes, the market keyword associated with the report is "Rubber Testing Equipment Market," which aids in identifying and referencing the specific market segment covered.
12. How do I determine which pricing option suits my needs best?
The pricing options vary based on user requirements and access needs. Individual users may opt for single-user licenses, while businesses requiring broader access may choose multi-user or enterprise licenses for cost-effective access to the report.
13. Are there any additional resources or data provided in the Rubber Testing Equipment Market report?
While the report offers comprehensive insights, it's advisable to review the specific contents or supplementary materials provided to ascertain if additional resources or data are available.
14. How can I stay updated on further developments or reports in the Rubber Testing Equipment Market?
To stay informed about further developments, trends, and reports in the Rubber Testing Equipment Market, consider subscribing to industry newsletters, following relevant companies and organizations, or regularly checking reputable industry news sources and publications.
Methodology
Step 1 - Identification of Relevant Samples Size from Population Database


Step 2 - Approaches for Defining Global Market Size (Value, Volume* & Price*)

Note*: In applicable scenarios
Step 3 - Data Sources
Primary Research
- Web Analytics
- Survey Reports
- Research Institute
- Latest Research Reports
- Opinion Leaders
Secondary Research
- Annual Reports
- White Paper
- Latest Press Release
- Industry Association
- Paid Database
- Investor Presentations

Step 4 - Data Triangulation
Involves using different sources of information in order to increase the validity of a study
These sources are likely to be stakeholders in a program - participants, other researchers, program staff, other community members, and so on.
Then we put all data in single framework & apply various statistical tools to find out the dynamic on the market.
During the analysis stage, feedback from the stakeholder groups would be compared to determine areas of agreement as well as areas of divergence