

Key Insights
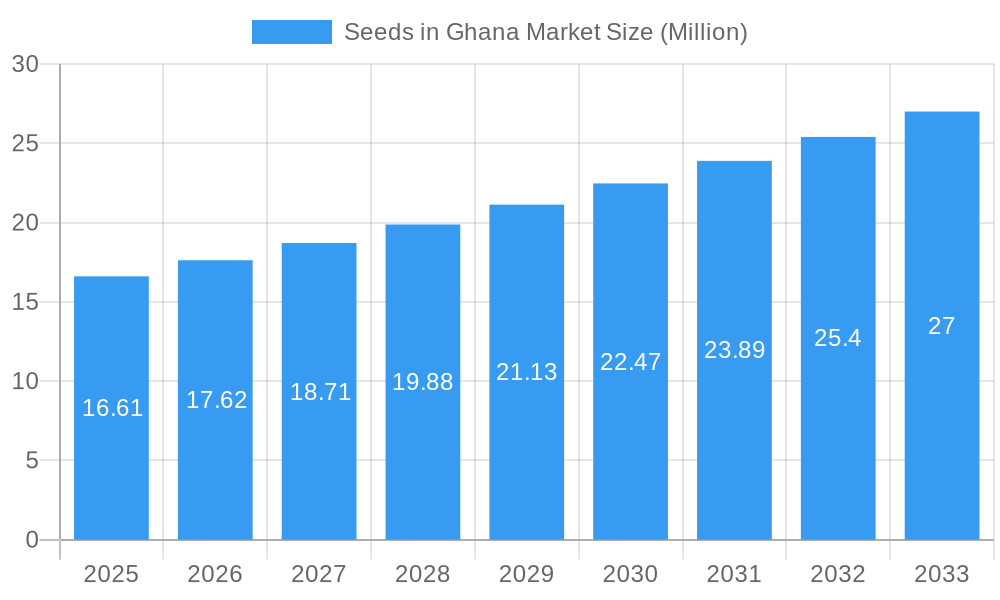
The Ghanaian seed market, valued at $16.61 million in 2025, is projected to experience robust growth, driven by factors such as increasing agricultural investment, government initiatives promoting improved seed varieties, and a rising demand for higher crop yields to meet food security needs. The market's Compound Annual Growth Rate (CAGR) of 5.78% from 2025 to 2033 signifies a promising outlook. Key segments driving this growth include Non-GM/Hybrid seeds, which are likely to dominate due to consumer preference and potential regulatory hurdles surrounding genetically modified (GM) seeds. The Grains and Cereals crop type segment is expected to hold a significant market share, reflecting Ghana's reliance on staple crops. However, the growing demand for diverse fruits and vegetables is likely to contribute to the expansion of the corresponding seed segment. Competition is relatively high among established players like RMG Ghana Ltd, Rijk Zwaan, Corteva Agriscience, Limagrain, Syngenta, Seed Co Limited, and M&B Seeds, who are likely to leverage their distribution networks and research & development capabilities to maintain their market positions. Future growth will depend on overcoming challenges such as inadequate infrastructure, limited access to financing for smallholder farmers, and the potential impact of climate change on crop production.
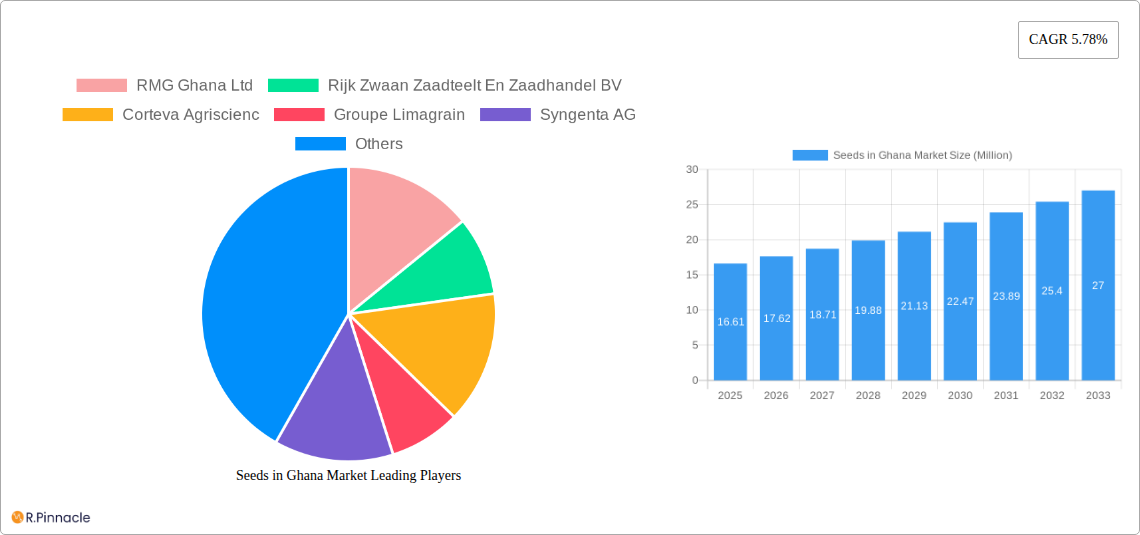
Seeds in Ghana Market Market Size (In Million)
The forecast period (2025-2033) will witness a gradual shift towards higher-yielding, disease-resistant seed varieties, further fueled by technological advancements in seed production and distribution. Government initiatives focused on farmer education and training will play a crucial role in accelerating market adoption. The market's trajectory is influenced by various factors, including fluctuating global seed prices, government regulations regarding seed quality and certification, and the overall economic health of the agricultural sector. Continued investment in research and development of locally adapted seed varieties will be essential for ensuring sustainable growth and improving the livelihoods of Ghanaian farmers. The success of the Ghanaian seed market ultimately hinges on effective collaboration between stakeholders—including seed companies, government agencies, and farmers—to overcome existing challenges and maximize the potential of the country's agricultural sector.
Seeds in Ghana Market Company Market Share
Seeds in Ghana Market: A Comprehensive Report (2019-2033)
This comprehensive report provides an in-depth analysis of the Seeds in Ghana Market, covering the period from 2019 to 2033, with a focus on the estimated year 2025. It offers actionable insights for industry professionals, investors, and stakeholders seeking to understand the market's dynamics, opportunities, and challenges. The report utilizes a robust methodology, incorporating historical data (2019-2024), current market estimations (2025), and future projections (2025-2033). Key players such as RMG Ghana Ltd, Rijk Zwaan Zaadteelt En Zaadhandel BV, Corteva Agriscience, Groupe Limagrain, Syngenta AG, Seed Co Limited, and M&B Seeds are profiled, offering a competitive landscape analysis. The report segments the market by seed type (Non-GM/Hybrid Seeds, GM Seeds, Open-pollinated Varieties) and crop type (Grains and Cereals, Pulses and Oilseeds, Fruits and Vegetables, Other Crop Types), providing granular insights into each segment's performance and growth potential. With a total market value exceeding xx Million USD by 2033, this report is an invaluable resource for strategic decision-making.
Seeds in Ghana Market Market Structure & Innovation Trends
The Ghanaian seed market is characterized by a moderately concentrated structure, with a significant presence of multinational corporations that command a substantial portion of the market share. Key industry leaders include Rijk Zwaan Zaadteelt En Zaadhandel BV, Corteva Agriscience, and Syngenta AG, collectively holding an estimated [Insert specific percentage]% of the total market in 2025. Complementing these global players are numerous local companies and distributors who are vital in providing regionally adapted open-pollinated varieties, catering to the specific needs of diverse farming communities.
Innovation within the Ghanaian seed market is prominently driven by the persistent demand for enhanced crop yields, superior disease resistance, and greater climate resilience. Crucial government initiatives, such as the recently drafted Seed Sector Strategy and Investment Plan (November 2022), are actively working to foster innovation and accelerate technology adoption among local farmers. While regulatory frameworks are continuously evolving, their primary focus remains on ensuring stringent seed quality control and robust certification processes. The market experiences limited direct substitution of seed types, as the selection is predominantly dictated by crop requirements and prevailing agricultural practices. The end-user base is largely comprised of smallholder farmers, with a discernible and growing segment of larger commercial agricultural enterprises. Mergers and acquisitions (M&A) activity within the Ghanaian seed sector has been relatively subdued in recent years, with a cumulative deal value approximating [Insert specific USD amount] Million USD recorded between 2019 and 2024.
- Market Concentration: Moderately concentrated, with top players commanding an estimated [Insert specific percentage]% market share (2025).
- Key Innovation Drivers: Focus on improving crop yields, enhancing disease resistance, and building climate resilience.
- Regulatory Environment: An evolving landscape with a strong emphasis on quality control and certification standards.
- M&A Activity (2019-2024): Total deal value estimated at approximately [Insert specific USD amount] Million USD.
Seeds in Ghana Market Market Dynamics & Trends
The Ghanaian seed market is experiencing significant growth, driven by increasing agricultural production, government support for the agricultural sector, and a rising demand for high-yielding, improved seed varieties. The Compound Annual Growth Rate (CAGR) is projected to be xx% between 2025 and 2033. Technological disruptions, particularly in precision agriculture and seed technology, are accelerating market transformation. Consumer preferences are shifting toward improved varieties that offer higher yields, disease resistance, and better adaptability to changing climatic conditions. Competitive dynamics are characterized by both established multinational companies and smaller local players competing for market share. Market penetration of improved seed varieties is estimated to be xx% in 2025, with significant growth potential remaining. The adoption of GM seeds is comparatively low due to various factors but this segment is showing signs of growth.
Dominant Regions & Segments in Seeds in Ghana Market
The Ashanti Region and other major agricultural regions are leading in the adoption of improved seeds due to favourable agro-ecological conditions and better access to agricultural inputs and information. In terms of seed type, Non-GM/Hybrid seeds currently dominate the market, followed by open-pollinated varieties. The Grains and Cereals segment, specifically maize and rice, represent the largest share of the market. This is due to the high demand for these staple crops.
- Key Drivers for Ashanti Region Dominance: Favourable agro-ecological conditions, better access to inputs and information.
- Dominant Seed Type: Non-GM/Hybrid Seeds.
- Dominant Crop Type: Grains and Cereals (Maize and Rice).
Pulses and oilseeds are also showing significant growth, driven by increasing demand for these crops both domestically and for export. The Fruits and Vegetables segment, though smaller, is experiencing dynamic growth driven by increasing urbanization and changing consumption patterns. The Other Crop Types segment encompasses a variety of crops, which often rely on local seed supplies.
Seeds in Ghana Market Product Innovations
Recent product innovations in the Ghanaian seed market are centered on the development of advanced hybrid varieties designed to deliver significantly improved yields, robust disease resistance, and enhanced drought tolerance. Companies are also actively exploring the transformative potential of biotechnology to elevate seed quality and optimize crop productivity. These innovations are strategically aligned with the pressing needs of Ghana's agricultural sector, aiming to effectively address the dual challenges of climate change impacts and the imperative of ensuring food security. The market readiness and acceptance for these innovations are exceptionally high, particularly among commercial farmers who are keen to boost their operational efficiency and profitability.
Report Scope & Segmentation Analysis
This report segments the Ghanaian seed market by seed type (Non-GM/Hybrid, GM, Open-pollinated) and crop type (Grains and Cereals, Pulses and Oilseeds, Fruits and Vegetables, Other Crop Types). Each segment's market size, growth projections, and competitive dynamics are analyzed. The Non-GM/Hybrid segment is projected to maintain its dominance, driven by farmer preference and regulatory considerations. GM seeds are showing slow but steady growth driven by government policies and private sector initiatives. Open-pollinated varieties continue to hold a significant share, particularly in certain regions. Within crop types, Grains and Cereals represent the largest segment, followed by Pulses and Oilseeds.
Key Drivers of Seeds in Ghana Market Growth
The growth trajectory of the Ghanaian seed market is being propelled by a confluence of significant factors. These include the sustained expansion of agricultural production, robust government support and strategic initiatives aimed at uplifting the agriculture sector, an increasing demand for high-yielding and superior seed varieties, and the continuous advancements in seed technology and the adoption of precision agriculture techniques. Notable drivers contributing to this growth include the recently launched SeedSAT project (June 2022) and the comprehensive Seed Sector Strategy and Investment Plan (November 2022).
Challenges in the Seeds in Ghana Market Sector
Challenges include limited access to high-quality seeds in remote areas, poor infrastructure hindering efficient seed distribution, and the prevalence of counterfeit seeds. Regulatory hurdles can also pose challenges for companies seeking to enter the market or introduce new seed varieties. These factors can result in reduced yields and lower farm incomes, impacting the overall market performance and growth significantly. The impact of these factors is reflected in the relatively low market penetration of improved seeds in 2025.
Emerging Opportunities in Seeds in Ghana Market
Emerging opportunities lie in the expansion of high-quality seed distribution networks, the adoption of precision agriculture technologies to enhance seed utilization, and the development of climate-resilient seed varieties. The increasing demand for organically produced crops presents a new niche market opportunity, creating demand for organic seeds. Furthermore, the growth of the commercial farming segment presents opportunities for companies offering specialized seed varieties and technical support services.
Leading Players in the Seeds in Ghana Market Market
- RMG Ghana Ltd
- Rijk Zwaan Zaadteelt En Zaadhandel BV
- Corteva Agriscience
- Groupe Limagrain
- Syngenta AG
- Seed Co Limited
- M&B Seeds
Key Developments in Seeds in Ghana Market Industry
- June 2022: AGRA launched the SeedSAT project to ensure high-quality seed distribution. This initiative directly impacts market dynamics by improving access to quality seeds.
- September 2022: South Korea and Ghana signed an $8 million agreement for rice seed development and infrastructure improvements. This significantly boosts the rice seed segment.
- October 2022: The SC-WIT incubator program provided seed funding to five women-owned businesses, fostering entrepreneurship within the sector.
- November 2022: Ghana's seed experts drafted a new Seed Sector Strategy and Investment Plan to strengthen the industry and promote certified seed adoption. This is expected to transform market dynamics over the forecast period.
Future Outlook for Seeds in Ghana Market Market
The future outlook for the Ghanaian seed market is decidedly positive, buoyed by ongoing government commitment, rapid technological advancements, and a burgeoning demand for high-performance, improved seed varieties. Strategic opportunities abound in harnessing technological innovations to refine seed quality, optimize distribution networks, and enhance overall seed utilization. Furthermore, there is a significant potential to cater to the evolving and diverse needs of Ghana's farming community. The market is projected to maintain a robust growth trajectory, underpinned by these driving forces and a supportive policy environment, thereby solidifying Ghana's position as a pivotal player in the West African agricultural landscape.
Seeds in Ghana Market Segmentation
- 1. Production Analysis
- 2. Consumption Analysis
- 3. Import Market Analysis (Value & Volume)
- 4. Export Market Analysis (Value & Volume)
- 5. Price Trend Analysis
Seeds in Ghana Market Segmentation By Geography
-
1. North America
- 1.1. United States
- 1.2. Canada
- 1.3. Mexico
-
2. South America
- 2.1. Brazil
- 2.2. Argentina
- 2.3. Rest of South America
-
3. Europe
- 3.1. United Kingdom
- 3.2. Germany
- 3.3. France
- 3.4. Italy
- 3.5. Spain
- 3.6. Russia
- 3.7. Benelux
- 3.8. Nordics
- 3.9. Rest of Europe
-
4. Middle East & Africa
- 4.1. Turkey
- 4.2. Israel
- 4.3. GCC
- 4.4. North Africa
- 4.5. South Africa
- 4.6. Rest of Middle East & Africa
-
5. Asia Pacific
- 5.1. China
- 5.2. India
- 5.3. Japan
- 5.4. South Korea
- 5.5. ASEAN
- 5.6. Oceania
- 5.7. Rest of Asia Pacific
Seeds in Ghana Market Regional Market Share
Geographic Coverage of Seeds in Ghana Market
Seeds in Ghana Market REPORT HIGHLIGHTS
| Aspects | Details |
|---|---|
| Study Period | 2020-2034 |
| Base Year | 2025 |
| Estimated Year | 2026 |
| Forecast Period | 2026-2034 |
| Historical Period | 2020-2025 |
| Growth Rate | CAGR of 5.78% from 2020-2034 |
| Segmentation |
|
Table of Contents
- 1. Introduction
- 1.1. Research Scope
- 1.2. Market Segmentation
- 1.3. Research Objective
- 1.4. Definitions and Assumptions
- 2. Executive Summary
- 2.1. Market Snapshot
- 3. Market Dynamics
- 3.1. Market Drivers
- 3.2. Market Restrains
- 3.3. Market Trends
- 3.4. Market Opportunities
- 4. Market Factor Analysis
- 4.1. Porters Five Forces
- 4.1.1. Bargaining Power of Suppliers
- 4.1.2. Bargaining Power of Buyers
- 4.1.3. Threat of New Entrants
- 4.1.4. Threat of Substitutes
- 4.1.5. Competitive Rivalry
- 4.2. PESTEL analysis
- 4.3. BCG Analysis
- 4.3.1. Stars (High Growth, High Market Share)
- 4.3.2. Cash Cows (Low Growth, High Market Share)
- 4.3.3. Question Mark (High Growth, Low Market Share)
- 4.3.4. Dogs (Low Growth, Low Market Share)
- 4.4. Ansoff Matrix Analysis
- 4.5. Supply Chain Analysis
- 4.6. Regulatory Landscape
- 4.7. Current Market Potential and Opportunity Assessment (TAM–SAM–SOM Framework)
- 4.8. PRI Analyst Note
- 4.1. Porters Five Forces
- 5. Market Analysis, Insights and Forecast 2021-2033
- 5.1. Market Analysis, Insights and Forecast - by Production Analysis
- 5.2. Market Analysis, Insights and Forecast - by Consumption Analysis
- 5.3. Market Analysis, Insights and Forecast - by Import Market Analysis (Value & Volume)
- 5.4. Market Analysis, Insights and Forecast - by Export Market Analysis (Value & Volume)
- 5.5. Market Analysis, Insights and Forecast - by Price Trend Analysis
- 5.6. Market Analysis, Insights and Forecast - by Region
- 5.6.1. North America
- 5.6.2. South America
- 5.6.3. Europe
- 5.6.4. Middle East & Africa
- 5.6.5. Asia Pacific
- 6. Global Seeds in Ghana Market Analysis, Insights and Forecast, 2021-2033
- 6.1. Market Analysis, Insights and Forecast - by Production Analysis
- 6.2. Market Analysis, Insights and Forecast - by Consumption Analysis
- 6.3. Market Analysis, Insights and Forecast - by Import Market Analysis (Value & Volume)
- 6.4. Market Analysis, Insights and Forecast - by Export Market Analysis (Value & Volume)
- 6.5. Market Analysis, Insights and Forecast - by Price Trend Analysis
- 7. North America Seeds in Ghana Market Analysis, Insights and Forecast, 2020-2032
- 7.1. Market Analysis, Insights and Forecast - by Production Analysis
- 7.2. Market Analysis, Insights and Forecast - by Consumption Analysis
- 7.3. Market Analysis, Insights and Forecast - by Import Market Analysis (Value & Volume)
- 7.4. Market Analysis, Insights and Forecast - by Export Market Analysis (Value & Volume)
- 7.5. Market Analysis, Insights and Forecast - by Price Trend Analysis
- 8. South America Seeds in Ghana Market Analysis, Insights and Forecast, 2020-2032
- 8.1. Market Analysis, Insights and Forecast - by Production Analysis
- 8.2. Market Analysis, Insights and Forecast - by Consumption Analysis
- 8.3. Market Analysis, Insights and Forecast - by Import Market Analysis (Value & Volume)
- 8.4. Market Analysis, Insights and Forecast - by Export Market Analysis (Value & Volume)
- 8.5. Market Analysis, Insights and Forecast - by Price Trend Analysis
- 9. Europe Seeds in Ghana Market Analysis, Insights and Forecast, 2020-2032
- 9.1. Market Analysis, Insights and Forecast - by Production Analysis
- 9.2. Market Analysis, Insights and Forecast - by Consumption Analysis
- 9.3. Market Analysis, Insights and Forecast - by Import Market Analysis (Value & Volume)
- 9.4. Market Analysis, Insights and Forecast - by Export Market Analysis (Value & Volume)
- 9.5. Market Analysis, Insights and Forecast - by Price Trend Analysis
- 10. Middle East & Africa Seeds in Ghana Market Analysis, Insights and Forecast, 2020-2032
- 10.1. Market Analysis, Insights and Forecast - by Production Analysis
- 10.2. Market Analysis, Insights and Forecast - by Consumption Analysis
- 10.3. Market Analysis, Insights and Forecast - by Import Market Analysis (Value & Volume)
- 10.4. Market Analysis, Insights and Forecast - by Export Market Analysis (Value & Volume)
- 10.5. Market Analysis, Insights and Forecast - by Price Trend Analysis
- 11. Asia Pacific Seeds in Ghana Market Analysis, Insights and Forecast, 2020-2032
- 11.1. Market Analysis, Insights and Forecast - by Production Analysis
- 11.2. Market Analysis, Insights and Forecast - by Consumption Analysis
- 11.3. Market Analysis, Insights and Forecast - by Import Market Analysis (Value & Volume)
- 11.4. Market Analysis, Insights and Forecast - by Export Market Analysis (Value & Volume)
- 11.5. Market Analysis, Insights and Forecast - by Price Trend Analysis
- 12. Competitive Analysis
- 12.1. Company Profiles
- 12.1.1 RMG Ghana Ltd
- 12.1.1.1. Company Overview
- 12.1.1.2. Products
- 12.1.1.3. Company Financials
- 12.1.1.4. SWOT Analysis
- 12.1.2 Rijk Zwaan Zaadteelt En Zaadhandel BV
- 12.1.2.1. Company Overview
- 12.1.2.2. Products
- 12.1.2.3. Company Financials
- 12.1.2.4. SWOT Analysis
- 12.1.3 Corteva Agriscienc
- 12.1.3.1. Company Overview
- 12.1.3.2. Products
- 12.1.3.3. Company Financials
- 12.1.3.4. SWOT Analysis
- 12.1.4 Groupe Limagrain
- 12.1.4.1. Company Overview
- 12.1.4.2. Products
- 12.1.4.3. Company Financials
- 12.1.4.4. SWOT Analysis
- 12.1.5 Syngenta AG
- 12.1.5.1. Company Overview
- 12.1.5.2. Products
- 12.1.5.3. Company Financials
- 12.1.5.4. SWOT Analysis
- 12.1.6 Seed Co Limited
- 12.1.6.1. Company Overview
- 12.1.6.2. Products
- 12.1.6.3. Company Financials
- 12.1.6.4. SWOT Analysis
- 12.1.7 M&B Seeds
- 12.1.7.1. Company Overview
- 12.1.7.2. Products
- 12.1.7.3. Company Financials
- 12.1.7.4. SWOT Analysis
- 12.1.1 RMG Ghana Ltd
- 12.2. Market Entropy
- 12.2.1 Company's Key Areas Served
- 12.2.2 Recent Developments
- 12.3. Company Market Share Analysis 2025
- 12.3.1 Top 5 Companies Market Share Analysis
- 12.3.2 Top 3 Companies Market Share Analysis
- 12.4. List of Potential Customers
- 13. Research Methodology
List of Figures
- Figure 1: Global Seeds in Ghana Market Revenue Breakdown (Million, %) by Region 2025 & 2033
- Figure 2: Global Seeds in Ghana Market Volume Breakdown (Kiloton, %) by Region 2025 & 2033
- Figure 3: North America Seeds in Ghana Market Revenue (Million), by Production Analysis 2025 & 2033
- Figure 4: North America Seeds in Ghana Market Volume (Kiloton), by Production Analysis 2025 & 2033
- Figure 5: North America Seeds in Ghana Market Revenue Share (%), by Production Analysis 2025 & 2033
- Figure 6: North America Seeds in Ghana Market Volume Share (%), by Production Analysis 2025 & 2033
- Figure 7: North America Seeds in Ghana Market Revenue (Million), by Consumption Analysis 2025 & 2033
- Figure 8: North America Seeds in Ghana Market Volume (Kiloton), by Consumption Analysis 2025 & 2033
- Figure 9: North America Seeds in Ghana Market Revenue Share (%), by Consumption Analysis 2025 & 2033
- Figure 10: North America Seeds in Ghana Market Volume Share (%), by Consumption Analysis 2025 & 2033
- Figure 11: North America Seeds in Ghana Market Revenue (Million), by Import Market Analysis (Value & Volume) 2025 & 2033
- Figure 12: North America Seeds in Ghana Market Volume (Kiloton), by Import Market Analysis (Value & Volume) 2025 & 2033
- Figure 13: North America Seeds in Ghana Market Revenue Share (%), by Import Market Analysis (Value & Volume) 2025 & 2033
- Figure 14: North America Seeds in Ghana Market Volume Share (%), by Import Market Analysis (Value & Volume) 2025 & 2033
- Figure 15: North America Seeds in Ghana Market Revenue (Million), by Export Market Analysis (Value & Volume) 2025 & 2033
- Figure 16: North America Seeds in Ghana Market Volume (Kiloton), by Export Market Analysis (Value & Volume) 2025 & 2033
- Figure 17: North America Seeds in Ghana Market Revenue Share (%), by Export Market Analysis (Value & Volume) 2025 & 2033
- Figure 18: North America Seeds in Ghana Market Volume Share (%), by Export Market Analysis (Value & Volume) 2025 & 2033
- Figure 19: North America Seeds in Ghana Market Revenue (Million), by Price Trend Analysis 2025 & 2033
- Figure 20: North America Seeds in Ghana Market Volume (Kiloton), by Price Trend Analysis 2025 & 2033
- Figure 21: North America Seeds in Ghana Market Revenue Share (%), by Price Trend Analysis 2025 & 2033
- Figure 22: North America Seeds in Ghana Market Volume Share (%), by Price Trend Analysis 2025 & 2033
- Figure 23: North America Seeds in Ghana Market Revenue (Million), by Country 2025 & 2033
- Figure 24: North America Seeds in Ghana Market Volume (Kiloton), by Country 2025 & 2033
- Figure 25: North America Seeds in Ghana Market Revenue Share (%), by Country 2025 & 2033
- Figure 26: North America Seeds in Ghana Market Volume Share (%), by Country 2025 & 2033
- Figure 27: South America Seeds in Ghana Market Revenue (Million), by Production Analysis 2025 & 2033
- Figure 28: South America Seeds in Ghana Market Volume (Kiloton), by Production Analysis 2025 & 2033
- Figure 29: South America Seeds in Ghana Market Revenue Share (%), by Production Analysis 2025 & 2033
- Figure 30: South America Seeds in Ghana Market Volume Share (%), by Production Analysis 2025 & 2033
- Figure 31: South America Seeds in Ghana Market Revenue (Million), by Consumption Analysis 2025 & 2033
- Figure 32: South America Seeds in Ghana Market Volume (Kiloton), by Consumption Analysis 2025 & 2033
- Figure 33: South America Seeds in Ghana Market Revenue Share (%), by Consumption Analysis 2025 & 2033
- Figure 34: South America Seeds in Ghana Market Volume Share (%), by Consumption Analysis 2025 & 2033
- Figure 35: South America Seeds in Ghana Market Revenue (Million), by Import Market Analysis (Value & Volume) 2025 & 2033
- Figure 36: South America Seeds in Ghana Market Volume (Kiloton), by Import Market Analysis (Value & Volume) 2025 & 2033
- Figure 37: South America Seeds in Ghana Market Revenue Share (%), by Import Market Analysis (Value & Volume) 2025 & 2033
- Figure 38: South America Seeds in Ghana Market Volume Share (%), by Import Market Analysis (Value & Volume) 2025 & 2033
- Figure 39: South America Seeds in Ghana Market Revenue (Million), by Export Market Analysis (Value & Volume) 2025 & 2033
- Figure 40: South America Seeds in Ghana Market Volume (Kiloton), by Export Market Analysis (Value & Volume) 2025 & 2033
- Figure 41: South America Seeds in Ghana Market Revenue Share (%), by Export Market Analysis (Value & Volume) 2025 & 2033
- Figure 42: South America Seeds in Ghana Market Volume Share (%), by Export Market Analysis (Value & Volume) 2025 & 2033
- Figure 43: South America Seeds in Ghana Market Revenue (Million), by Price Trend Analysis 2025 & 2033
- Figure 44: South America Seeds in Ghana Market Volume (Kiloton), by Price Trend Analysis 2025 & 2033
- Figure 45: South America Seeds in Ghana Market Revenue Share (%), by Price Trend Analysis 2025 & 2033
- Figure 46: South America Seeds in Ghana Market Volume Share (%), by Price Trend Analysis 2025 & 2033
- Figure 47: South America Seeds in Ghana Market Revenue (Million), by Country 2025 & 2033
- Figure 48: South America Seeds in Ghana Market Volume (Kiloton), by Country 2025 & 2033
- Figure 49: South America Seeds in Ghana Market Revenue Share (%), by Country 2025 & 2033
- Figure 50: South America Seeds in Ghana Market Volume Share (%), by Country 2025 & 2033
- Figure 51: Europe Seeds in Ghana Market Revenue (Million), by Production Analysis 2025 & 2033
- Figure 52: Europe Seeds in Ghana Market Volume (Kiloton), by Production Analysis 2025 & 2033
- Figure 53: Europe Seeds in Ghana Market Revenue Share (%), by Production Analysis 2025 & 2033
- Figure 54: Europe Seeds in Ghana Market Volume Share (%), by Production Analysis 2025 & 2033
- Figure 55: Europe Seeds in Ghana Market Revenue (Million), by Consumption Analysis 2025 & 2033
- Figure 56: Europe Seeds in Ghana Market Volume (Kiloton), by Consumption Analysis 2025 & 2033
- Figure 57: Europe Seeds in Ghana Market Revenue Share (%), by Consumption Analysis 2025 & 2033
- Figure 58: Europe Seeds in Ghana Market Volume Share (%), by Consumption Analysis 2025 & 2033
- Figure 59: Europe Seeds in Ghana Market Revenue (Million), by Import Market Analysis (Value & Volume) 2025 & 2033
- Figure 60: Europe Seeds in Ghana Market Volume (Kiloton), by Import Market Analysis (Value & Volume) 2025 & 2033
- Figure 61: Europe Seeds in Ghana Market Revenue Share (%), by Import Market Analysis (Value & Volume) 2025 & 2033
- Figure 62: Europe Seeds in Ghana Market Volume Share (%), by Import Market Analysis (Value & Volume) 2025 & 2033
- Figure 63: Europe Seeds in Ghana Market Revenue (Million), by Export Market Analysis (Value & Volume) 2025 & 2033
- Figure 64: Europe Seeds in Ghana Market Volume (Kiloton), by Export Market Analysis (Value & Volume) 2025 & 2033
- Figure 65: Europe Seeds in Ghana Market Revenue Share (%), by Export Market Analysis (Value & Volume) 2025 & 2033
- Figure 66: Europe Seeds in Ghana Market Volume Share (%), by Export Market Analysis (Value & Volume) 2025 & 2033
- Figure 67: Europe Seeds in Ghana Market Revenue (Million), by Price Trend Analysis 2025 & 2033
- Figure 68: Europe Seeds in Ghana Market Volume (Kiloton), by Price Trend Analysis 2025 & 2033
- Figure 69: Europe Seeds in Ghana Market Revenue Share (%), by Price Trend Analysis 2025 & 2033
- Figure 70: Europe Seeds in Ghana Market Volume Share (%), by Price Trend Analysis 2025 & 2033
- Figure 71: Europe Seeds in Ghana Market Revenue (Million), by Country 2025 & 2033
- Figure 72: Europe Seeds in Ghana Market Volume (Kiloton), by Country 2025 & 2033
- Figure 73: Europe Seeds in Ghana Market Revenue Share (%), by Country 2025 & 2033
- Figure 74: Europe Seeds in Ghana Market Volume Share (%), by Country 2025 & 2033
- Figure 75: Middle East & Africa Seeds in Ghana Market Revenue (Million), by Production Analysis 2025 & 2033
- Figure 76: Middle East & Africa Seeds in Ghana Market Volume (Kiloton), by Production Analysis 2025 & 2033
- Figure 77: Middle East & Africa Seeds in Ghana Market Revenue Share (%), by Production Analysis 2025 & 2033
- Figure 78: Middle East & Africa Seeds in Ghana Market Volume Share (%), by Production Analysis 2025 & 2033
- Figure 79: Middle East & Africa Seeds in Ghana Market Revenue (Million), by Consumption Analysis 2025 & 2033
- Figure 80: Middle East & Africa Seeds in Ghana Market Volume (Kiloton), by Consumption Analysis 2025 & 2033
- Figure 81: Middle East & Africa Seeds in Ghana Market Revenue Share (%), by Consumption Analysis 2025 & 2033
- Figure 82: Middle East & Africa Seeds in Ghana Market Volume Share (%), by Consumption Analysis 2025 & 2033
- Figure 83: Middle East & Africa Seeds in Ghana Market Revenue (Million), by Import Market Analysis (Value & Volume) 2025 & 2033
- Figure 84: Middle East & Africa Seeds in Ghana Market Volume (Kiloton), by Import Market Analysis (Value & Volume) 2025 & 2033
- Figure 85: Middle East & Africa Seeds in Ghana Market Revenue Share (%), by Import Market Analysis (Value & Volume) 2025 & 2033
- Figure 86: Middle East & Africa Seeds in Ghana Market Volume Share (%), by Import Market Analysis (Value & Volume) 2025 & 2033
- Figure 87: Middle East & Africa Seeds in Ghana Market Revenue (Million), by Export Market Analysis (Value & Volume) 2025 & 2033
- Figure 88: Middle East & Africa Seeds in Ghana Market Volume (Kiloton), by Export Market Analysis (Value & Volume) 2025 & 2033
- Figure 89: Middle East & Africa Seeds in Ghana Market Revenue Share (%), by Export Market Analysis (Value & Volume) 2025 & 2033
- Figure 90: Middle East & Africa Seeds in Ghana Market Volume Share (%), by Export Market Analysis (Value & Volume) 2025 & 2033
- Figure 91: Middle East & Africa Seeds in Ghana Market Revenue (Million), by Price Trend Analysis 2025 & 2033
- Figure 92: Middle East & Africa Seeds in Ghana Market Volume (Kiloton), by Price Trend Analysis 2025 & 2033
- Figure 93: Middle East & Africa Seeds in Ghana Market Revenue Share (%), by Price Trend Analysis 2025 & 2033
- Figure 94: Middle East & Africa Seeds in Ghana Market Volume Share (%), by Price Trend Analysis 2025 & 2033
- Figure 95: Middle East & Africa Seeds in Ghana Market Revenue (Million), by Country 2025 & 2033
- Figure 96: Middle East & Africa Seeds in Ghana Market Volume (Kiloton), by Country 2025 & 2033
- Figure 97: Middle East & Africa Seeds in Ghana Market Revenue Share (%), by Country 2025 & 2033
- Figure 98: Middle East & Africa Seeds in Ghana Market Volume Share (%), by Country 2025 & 2033
- Figure 99: Asia Pacific Seeds in Ghana Market Revenue (Million), by Production Analysis 2025 & 2033
- Figure 100: Asia Pacific Seeds in Ghana Market Volume (Kiloton), by Production Analysis 2025 & 2033
- Figure 101: Asia Pacific Seeds in Ghana Market Revenue Share (%), by Production Analysis 2025 & 2033
- Figure 102: Asia Pacific Seeds in Ghana Market Volume Share (%), by Production Analysis 2025 & 2033
- Figure 103: Asia Pacific Seeds in Ghana Market Revenue (Million), by Consumption Analysis 2025 & 2033
- Figure 104: Asia Pacific Seeds in Ghana Market Volume (Kiloton), by Consumption Analysis 2025 & 2033
- Figure 105: Asia Pacific Seeds in Ghana Market Revenue Share (%), by Consumption Analysis 2025 & 2033
- Figure 106: Asia Pacific Seeds in Ghana Market Volume Share (%), by Consumption Analysis 2025 & 2033
- Figure 107: Asia Pacific Seeds in Ghana Market Revenue (Million), by Import Market Analysis (Value & Volume) 2025 & 2033
- Figure 108: Asia Pacific Seeds in Ghana Market Volume (Kiloton), by Import Market Analysis (Value & Volume) 2025 & 2033
- Figure 109: Asia Pacific Seeds in Ghana Market Revenue Share (%), by Import Market Analysis (Value & Volume) 2025 & 2033
- Figure 110: Asia Pacific Seeds in Ghana Market Volume Share (%), by Import Market Analysis (Value & Volume) 2025 & 2033
- Figure 111: Asia Pacific Seeds in Ghana Market Revenue (Million), by Export Market Analysis (Value & Volume) 2025 & 2033
- Figure 112: Asia Pacific Seeds in Ghana Market Volume (Kiloton), by Export Market Analysis (Value & Volume) 2025 & 2033
- Figure 113: Asia Pacific Seeds in Ghana Market Revenue Share (%), by Export Market Analysis (Value & Volume) 2025 & 2033
- Figure 114: Asia Pacific Seeds in Ghana Market Volume Share (%), by Export Market Analysis (Value & Volume) 2025 & 2033
- Figure 115: Asia Pacific Seeds in Ghana Market Revenue (Million), by Price Trend Analysis 2025 & 2033
- Figure 116: Asia Pacific Seeds in Ghana Market Volume (Kiloton), by Price Trend Analysis 2025 & 2033
- Figure 117: Asia Pacific Seeds in Ghana Market Revenue Share (%), by Price Trend Analysis 2025 & 2033
- Figure 118: Asia Pacific Seeds in Ghana Market Volume Share (%), by Price Trend Analysis 2025 & 2033
- Figure 119: Asia Pacific Seeds in Ghana Market Revenue (Million), by Country 2025 & 2033
- Figure 120: Asia Pacific Seeds in Ghana Market Volume (Kiloton), by Country 2025 & 2033
- Figure 121: Asia Pacific Seeds in Ghana Market Revenue Share (%), by Country 2025 & 2033
- Figure 122: Asia Pacific Seeds in Ghana Market Volume Share (%), by Country 2025 & 2033
List of Tables
- Table 1: Global Seeds in Ghana Market Revenue Million Forecast, by Production Analysis 2020 & 2033
- Table 2: Global Seeds in Ghana Market Volume Kiloton Forecast, by Production Analysis 2020 & 2033
- Table 3: Global Seeds in Ghana Market Revenue Million Forecast, by Consumption Analysis 2020 & 2033
- Table 4: Global Seeds in Ghana Market Volume Kiloton Forecast, by Consumption Analysis 2020 & 2033
- Table 5: Global Seeds in Ghana Market Revenue Million Forecast, by Import Market Analysis (Value & Volume) 2020 & 2033
- Table 6: Global Seeds in Ghana Market Volume Kiloton Forecast, by Import Market Analysis (Value & Volume) 2020 & 2033
- Table 7: Global Seeds in Ghana Market Revenue Million Forecast, by Export Market Analysis (Value & Volume) 2020 & 2033
- Table 8: Global Seeds in Ghana Market Volume Kiloton Forecast, by Export Market Analysis (Value & Volume) 2020 & 2033
- Table 9: Global Seeds in Ghana Market Revenue Million Forecast, by Price Trend Analysis 2020 & 2033
- Table 10: Global Seeds in Ghana Market Volume Kiloton Forecast, by Price Trend Analysis 2020 & 2033
- Table 11: Global Seeds in Ghana Market Revenue Million Forecast, by Region 2020 & 2033
- Table 12: Global Seeds in Ghana Market Volume Kiloton Forecast, by Region 2020 & 2033
- Table 13: Global Seeds in Ghana Market Revenue Million Forecast, by Production Analysis 2020 & 2033
- Table 14: Global Seeds in Ghana Market Volume Kiloton Forecast, by Production Analysis 2020 & 2033
- Table 15: Global Seeds in Ghana Market Revenue Million Forecast, by Consumption Analysis 2020 & 2033
- Table 16: Global Seeds in Ghana Market Volume Kiloton Forecast, by Consumption Analysis 2020 & 2033
- Table 17: Global Seeds in Ghana Market Revenue Million Forecast, by Import Market Analysis (Value & Volume) 2020 & 2033
- Table 18: Global Seeds in Ghana Market Volume Kiloton Forecast, by Import Market Analysis (Value & Volume) 2020 & 2033
- Table 19: Global Seeds in Ghana Market Revenue Million Forecast, by Export Market Analysis (Value & Volume) 2020 & 2033
- Table 20: Global Seeds in Ghana Market Volume Kiloton Forecast, by Export Market Analysis (Value & Volume) 2020 & 2033
- Table 21: Global Seeds in Ghana Market Revenue Million Forecast, by Price Trend Analysis 2020 & 2033
- Table 22: Global Seeds in Ghana Market Volume Kiloton Forecast, by Price Trend Analysis 2020 & 2033
- Table 23: Global Seeds in Ghana Market Revenue Million Forecast, by Country 2020 & 2033
- Table 24: Global Seeds in Ghana Market Volume Kiloton Forecast, by Country 2020 & 2033
- Table 25: United States Seeds in Ghana Market Revenue (Million) Forecast, by Application 2020 & 2033
- Table 26: United States Seeds in Ghana Market Volume (Kiloton) Forecast, by Application 2020 & 2033
- Table 27: Canada Seeds in Ghana Market Revenue (Million) Forecast, by Application 2020 & 2033
- Table 28: Canada Seeds in Ghana Market Volume (Kiloton) Forecast, by Application 2020 & 2033
- Table 29: Mexico Seeds in Ghana Market Revenue (Million) Forecast, by Application 2020 & 2033
- Table 30: Mexico Seeds in Ghana Market Volume (Kiloton) Forecast, by Application 2020 & 2033
- Table 31: Global Seeds in Ghana Market Revenue Million Forecast, by Production Analysis 2020 & 2033
- Table 32: Global Seeds in Ghana Market Volume Kiloton Forecast, by Production Analysis 2020 & 2033
- Table 33: Global Seeds in Ghana Market Revenue Million Forecast, by Consumption Analysis 2020 & 2033
- Table 34: Global Seeds in Ghana Market Volume Kiloton Forecast, by Consumption Analysis 2020 & 2033
- Table 35: Global Seeds in Ghana Market Revenue Million Forecast, by Import Market Analysis (Value & Volume) 2020 & 2033
- Table 36: Global Seeds in Ghana Market Volume Kiloton Forecast, by Import Market Analysis (Value & Volume) 2020 & 2033
- Table 37: Global Seeds in Ghana Market Revenue Million Forecast, by Export Market Analysis (Value & Volume) 2020 & 2033
- Table 38: Global Seeds in Ghana Market Volume Kiloton Forecast, by Export Market Analysis (Value & Volume) 2020 & 2033
- Table 39: Global Seeds in Ghana Market Revenue Million Forecast, by Price Trend Analysis 2020 & 2033
- Table 40: Global Seeds in Ghana Market Volume Kiloton Forecast, by Price Trend Analysis 2020 & 2033
- Table 41: Global Seeds in Ghana Market Revenue Million Forecast, by Country 2020 & 2033
- Table 42: Global Seeds in Ghana Market Volume Kiloton Forecast, by Country 2020 & 2033
- Table 43: Brazil Seeds in Ghana Market Revenue (Million) Forecast, by Application 2020 & 2033
- Table 44: Brazil Seeds in Ghana Market Volume (Kiloton) Forecast, by Application 2020 & 2033
- Table 45: Argentina Seeds in Ghana Market Revenue (Million) Forecast, by Application 2020 & 2033
- Table 46: Argentina Seeds in Ghana Market Volume (Kiloton) Forecast, by Application 2020 & 2033
- Table 47: Rest of South America Seeds in Ghana Market Revenue (Million) Forecast, by Application 2020 & 2033
- Table 48: Rest of South America Seeds in Ghana Market Volume (Kiloton) Forecast, by Application 2020 & 2033
- Table 49: Global Seeds in Ghana Market Revenue Million Forecast, by Production Analysis 2020 & 2033
- Table 50: Global Seeds in Ghana Market Volume Kiloton Forecast, by Production Analysis 2020 & 2033
- Table 51: Global Seeds in Ghana Market Revenue Million Forecast, by Consumption Analysis 2020 & 2033
- Table 52: Global Seeds in Ghana Market Volume Kiloton Forecast, by Consumption Analysis 2020 & 2033
- Table 53: Global Seeds in Ghana Market Revenue Million Forecast, by Import Market Analysis (Value & Volume) 2020 & 2033
- Table 54: Global Seeds in Ghana Market Volume Kiloton Forecast, by Import Market Analysis (Value & Volume) 2020 & 2033
- Table 55: Global Seeds in Ghana Market Revenue Million Forecast, by Export Market Analysis (Value & Volume) 2020 & 2033
- Table 56: Global Seeds in Ghana Market Volume Kiloton Forecast, by Export Market Analysis (Value & Volume) 2020 & 2033
- Table 57: Global Seeds in Ghana Market Revenue Million Forecast, by Price Trend Analysis 2020 & 2033
- Table 58: Global Seeds in Ghana Market Volume Kiloton Forecast, by Price Trend Analysis 2020 & 2033
- Table 59: Global Seeds in Ghana Market Revenue Million Forecast, by Country 2020 & 2033
- Table 60: Global Seeds in Ghana Market Volume Kiloton Forecast, by Country 2020 & 2033
- Table 61: United Kingdom Seeds in Ghana Market Revenue (Million) Forecast, by Application 2020 & 2033
- Table 62: United Kingdom Seeds in Ghana Market Volume (Kiloton) Forecast, by Application 2020 & 2033
- Table 63: Germany Seeds in Ghana Market Revenue (Million) Forecast, by Application 2020 & 2033
- Table 64: Germany Seeds in Ghana Market Volume (Kiloton) Forecast, by Application 2020 & 2033
- Table 65: France Seeds in Ghana Market Revenue (Million) Forecast, by Application 2020 & 2033
- Table 66: France Seeds in Ghana Market Volume (Kiloton) Forecast, by Application 2020 & 2033
- Table 67: Italy Seeds in Ghana Market Revenue (Million) Forecast, by Application 2020 & 2033
- Table 68: Italy Seeds in Ghana Market Volume (Kiloton) Forecast, by Application 2020 & 2033
- Table 69: Spain Seeds in Ghana Market Revenue (Million) Forecast, by Application 2020 & 2033
- Table 70: Spain Seeds in Ghana Market Volume (Kiloton) Forecast, by Application 2020 & 2033
- Table 71: Russia Seeds in Ghana Market Revenue (Million) Forecast, by Application 2020 & 2033
- Table 72: Russia Seeds in Ghana Market Volume (Kiloton) Forecast, by Application 2020 & 2033
- Table 73: Benelux Seeds in Ghana Market Revenue (Million) Forecast, by Application 2020 & 2033
- Table 74: Benelux Seeds in Ghana Market Volume (Kiloton) Forecast, by Application 2020 & 2033
- Table 75: Nordics Seeds in Ghana Market Revenue (Million) Forecast, by Application 2020 & 2033
- Table 76: Nordics Seeds in Ghana Market Volume (Kiloton) Forecast, by Application 2020 & 2033
- Table 77: Rest of Europe Seeds in Ghana Market Revenue (Million) Forecast, by Application 2020 & 2033
- Table 78: Rest of Europe Seeds in Ghana Market Volume (Kiloton) Forecast, by Application 2020 & 2033
- Table 79: Global Seeds in Ghana Market Revenue Million Forecast, by Production Analysis 2020 & 2033
- Table 80: Global Seeds in Ghana Market Volume Kiloton Forecast, by Production Analysis 2020 & 2033
- Table 81: Global Seeds in Ghana Market Revenue Million Forecast, by Consumption Analysis 2020 & 2033
- Table 82: Global Seeds in Ghana Market Volume Kiloton Forecast, by Consumption Analysis 2020 & 2033
- Table 83: Global Seeds in Ghana Market Revenue Million Forecast, by Import Market Analysis (Value & Volume) 2020 & 2033
- Table 84: Global Seeds in Ghana Market Volume Kiloton Forecast, by Import Market Analysis (Value & Volume) 2020 & 2033
- Table 85: Global Seeds in Ghana Market Revenue Million Forecast, by Export Market Analysis (Value & Volume) 2020 & 2033
- Table 86: Global Seeds in Ghana Market Volume Kiloton Forecast, by Export Market Analysis (Value & Volume) 2020 & 2033
- Table 87: Global Seeds in Ghana Market Revenue Million Forecast, by Price Trend Analysis 2020 & 2033
- Table 88: Global Seeds in Ghana Market Volume Kiloton Forecast, by Price Trend Analysis 2020 & 2033
- Table 89: Global Seeds in Ghana Market Revenue Million Forecast, by Country 2020 & 2033
- Table 90: Global Seeds in Ghana Market Volume Kiloton Forecast, by Country 2020 & 2033
- Table 91: Turkey Seeds in Ghana Market Revenue (Million) Forecast, by Application 2020 & 2033
- Table 92: Turkey Seeds in Ghana Market Volume (Kiloton) Forecast, by Application 2020 & 2033
- Table 93: Israel Seeds in Ghana Market Revenue (Million) Forecast, by Application 2020 & 2033
- Table 94: Israel Seeds in Ghana Market Volume (Kiloton) Forecast, by Application 2020 & 2033
- Table 95: GCC Seeds in Ghana Market Revenue (Million) Forecast, by Application 2020 & 2033
- Table 96: GCC Seeds in Ghana Market Volume (Kiloton) Forecast, by Application 2020 & 2033
- Table 97: North Africa Seeds in Ghana Market Revenue (Million) Forecast, by Application 2020 & 2033
- Table 98: North Africa Seeds in Ghana Market Volume (Kiloton) Forecast, by Application 2020 & 2033
- Table 99: South Africa Seeds in Ghana Market Revenue (Million) Forecast, by Application 2020 & 2033
- Table 100: South Africa Seeds in Ghana Market Volume (Kiloton) Forecast, by Application 2020 & 2033
- Table 101: Rest of Middle East & Africa Seeds in Ghana Market Revenue (Million) Forecast, by Application 2020 & 2033
- Table 102: Rest of Middle East & Africa Seeds in Ghana Market Volume (Kiloton) Forecast, by Application 2020 & 2033
- Table 103: Global Seeds in Ghana Market Revenue Million Forecast, by Production Analysis 2020 & 2033
- Table 104: Global Seeds in Ghana Market Volume Kiloton Forecast, by Production Analysis 2020 & 2033
- Table 105: Global Seeds in Ghana Market Revenue Million Forecast, by Consumption Analysis 2020 & 2033
- Table 106: Global Seeds in Ghana Market Volume Kiloton Forecast, by Consumption Analysis 2020 & 2033
- Table 107: Global Seeds in Ghana Market Revenue Million Forecast, by Import Market Analysis (Value & Volume) 2020 & 2033
- Table 108: Global Seeds in Ghana Market Volume Kiloton Forecast, by Import Market Analysis (Value & Volume) 2020 & 2033
- Table 109: Global Seeds in Ghana Market Revenue Million Forecast, by Export Market Analysis (Value & Volume) 2020 & 2033
- Table 110: Global Seeds in Ghana Market Volume Kiloton Forecast, by Export Market Analysis (Value & Volume) 2020 & 2033
- Table 111: Global Seeds in Ghana Market Revenue Million Forecast, by Price Trend Analysis 2020 & 2033
- Table 112: Global Seeds in Ghana Market Volume Kiloton Forecast, by Price Trend Analysis 2020 & 2033
- Table 113: Global Seeds in Ghana Market Revenue Million Forecast, by Country 2020 & 2033
- Table 114: Global Seeds in Ghana Market Volume Kiloton Forecast, by Country 2020 & 2033
- Table 115: China Seeds in Ghana Market Revenue (Million) Forecast, by Application 2020 & 2033
- Table 116: China Seeds in Ghana Market Volume (Kiloton) Forecast, by Application 2020 & 2033
- Table 117: India Seeds in Ghana Market Revenue (Million) Forecast, by Application 2020 & 2033
- Table 118: India Seeds in Ghana Market Volume (Kiloton) Forecast, by Application 2020 & 2033
- Table 119: Japan Seeds in Ghana Market Revenue (Million) Forecast, by Application 2020 & 2033
- Table 120: Japan Seeds in Ghana Market Volume (Kiloton) Forecast, by Application 2020 & 2033
- Table 121: South Korea Seeds in Ghana Market Revenue (Million) Forecast, by Application 2020 & 2033
- Table 122: South Korea Seeds in Ghana Market Volume (Kiloton) Forecast, by Application 2020 & 2033
- Table 123: ASEAN Seeds in Ghana Market Revenue (Million) Forecast, by Application 2020 & 2033
- Table 124: ASEAN Seeds in Ghana Market Volume (Kiloton) Forecast, by Application 2020 & 2033
- Table 125: Oceania Seeds in Ghana Market Revenue (Million) Forecast, by Application 2020 & 2033
- Table 126: Oceania Seeds in Ghana Market Volume (Kiloton) Forecast, by Application 2020 & 2033
- Table 127: Rest of Asia Pacific Seeds in Ghana Market Revenue (Million) Forecast, by Application 2020 & 2033
- Table 128: Rest of Asia Pacific Seeds in Ghana Market Volume (Kiloton) Forecast, by Application 2020 & 2033
Frequently Asked Questions
1. What is the projected Compound Annual Growth Rate (CAGR) of the Seeds in Ghana Market?
The projected CAGR is approximately 5.78%.
2. Which companies are prominent players in the Seeds in Ghana Market?
Key companies in the market include RMG Ghana Ltd, Rijk Zwaan Zaadteelt En Zaadhandel BV, Corteva Agriscienc, Groupe Limagrain, Syngenta AG, Seed Co Limited, M&B Seeds.
3. What are the main segments of the Seeds in Ghana Market?
The market segments include Production Analysis, Consumption Analysis, Import Market Analysis (Value & Volume), Export Market Analysis (Value & Volume), Price Trend Analysis.
4. Can you provide details about the market size?
The market size is estimated to be USD 16.61 Million as of 2022.
5. What are some drivers contributing to market growth?
Decreasing Per Capita Arable Land; Increased Demand for Food.
6. What are the notable trends driving market growth?
Growing Demand for Certified Seeds.
7. Are there any restraints impacting market growth?
High Initial Investments; Requirement of Precision Agriculture.
8. Can you provide examples of recent developments in the market?
November 2022: Ghana's Seed Experts Draft New Seed Sector Strategy and Investment Plan. The Seed Sector Strategy and Investment Plan is expected to strengthen Ghana's seed industry by promoting the adoption and utilization of certified seed by the country's farmers.
9. What pricing options are available for accessing the report?
Pricing options include single-user, multi-user, and enterprise licenses priced at USD 3800, USD 4500, and USD 5800 respectively.
10. Is the market size provided in terms of value or volume?
The market size is provided in terms of value, measured in Million and volume, measured in Kiloton.
11. Are there any specific market keywords associated with the report?
Yes, the market keyword associated with the report is "Seeds in Ghana Market," which aids in identifying and referencing the specific market segment covered.
12. How do I determine which pricing option suits my needs best?
The pricing options vary based on user requirements and access needs. Individual users may opt for single-user licenses, while businesses requiring broader access may choose multi-user or enterprise licenses for cost-effective access to the report.
13. Are there any additional resources or data provided in the Seeds in Ghana Market report?
While the report offers comprehensive insights, it's advisable to review the specific contents or supplementary materials provided to ascertain if additional resources or data are available.
14. How can I stay updated on further developments or reports in the Seeds in Ghana Market?
To stay informed about further developments, trends, and reports in the Seeds in Ghana Market, consider subscribing to industry newsletters, following relevant companies and organizations, or regularly checking reputable industry news sources and publications.
Methodology
Step 1 - Identification of Relevant Samples Size from Population Database


Step 2 - Approaches for Defining Global Market Size (Value, Volume* & Price*)

Note*: In applicable scenarios
Step 3 - Data Sources
Primary Research
- Web Analytics
- Survey Reports
- Research Institute
- Latest Research Reports
- Opinion Leaders
Secondary Research
- Annual Reports
- White Paper
- Latest Press Release
- Industry Association
- Paid Database
- Investor Presentations

Step 4 - Data Triangulation
Involves using different sources of information in order to increase the validity of a study
These sources are likely to be stakeholders in a program - participants, other researchers, program staff, other community members, and so on.
Then we put all data in single framework & apply various statistical tools to find out the dynamic on the market.
During the analysis stage, feedback from the stakeholder groups would be compared to determine areas of agreement as well as areas of divergence