

Key Insights
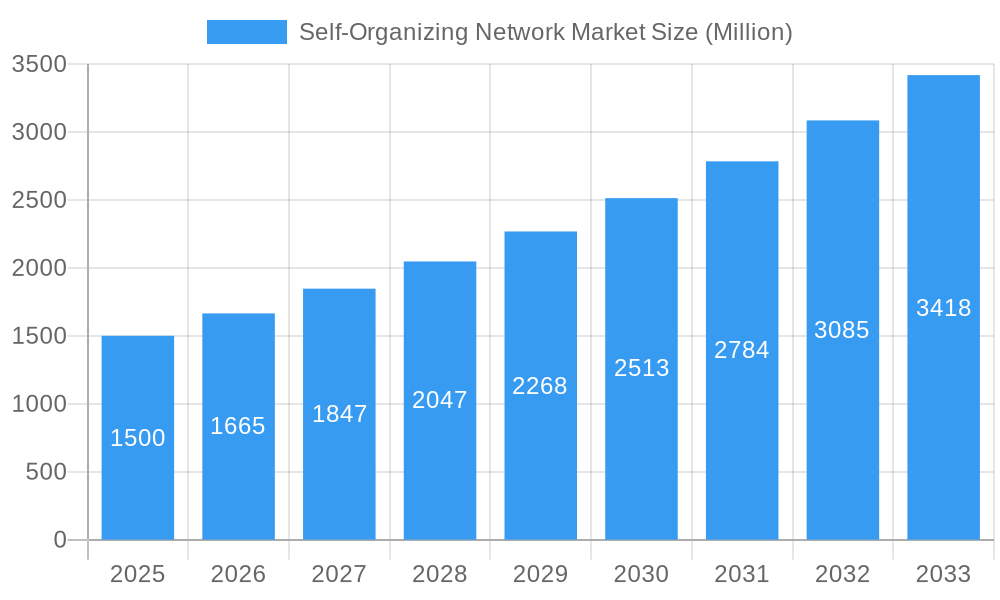
The Self-Organizing Network (SON) market is poised for significant expansion, driven by the escalating demand for automated network management and optimization within the telecommunications industry. The market, valued at $6.55 billion in 2025, is projected to grow at a Compound Annual Growth Rate (CAGR) of 11.2% from 2025 to 2033. This robust growth is underpinned by several critical factors. The rapid deployment of 5G networks necessitates advanced automation to manage their inherent complexity and scale. Concurrently, the imperative to enhance network performance, reduce operational expenditures, and elevate service quality is accelerating SON adoption across all network generations, including 2G/3G, 4G/LTE, and 5G. Market segmentation highlights the significant contributions of both software and service components. Software solutions empower proactive network monitoring and self-healing functionalities, while service providers offer specialized expertise in deployment, integration, and ongoing maintenance. Various SON architectures, including Centralized SON (C-SON), Distributed SON (D-SON), and Hybrid SON (H-SON), address diverse network needs, with a notable trend towards the increasing adoption of advanced architectures like D-SON and H-SON for superior scalability and efficiency.
Self-Organizing Network Market Market Size (In Billion)
Geographic expansion is a pivotal growth catalyst. North America and Europe currently command substantial market share, attributed to their early adoption and well-established infrastructure. However, the Asia Pacific region is anticipated to experience accelerated growth, fueled by substantial investments in 5G infrastructure and pervasive digitalization initiatives across key economies such as China, India, and Japan. While market challenges exist, including substantial initial investment requirements and integration complexities with legacy networks, the compelling long-term advantages of enhanced operational efficiency, reduced costs, and superior network performance are effectively mitigating these concerns. The competitive landscape features a dynamic interplay of established industry leaders such as Cisco, Ericsson, and Huawei, alongside innovative emerging companies specializing in niche technologies. This competitive environment stimulates innovation and contributes to cost optimization, further propelling market expansion.
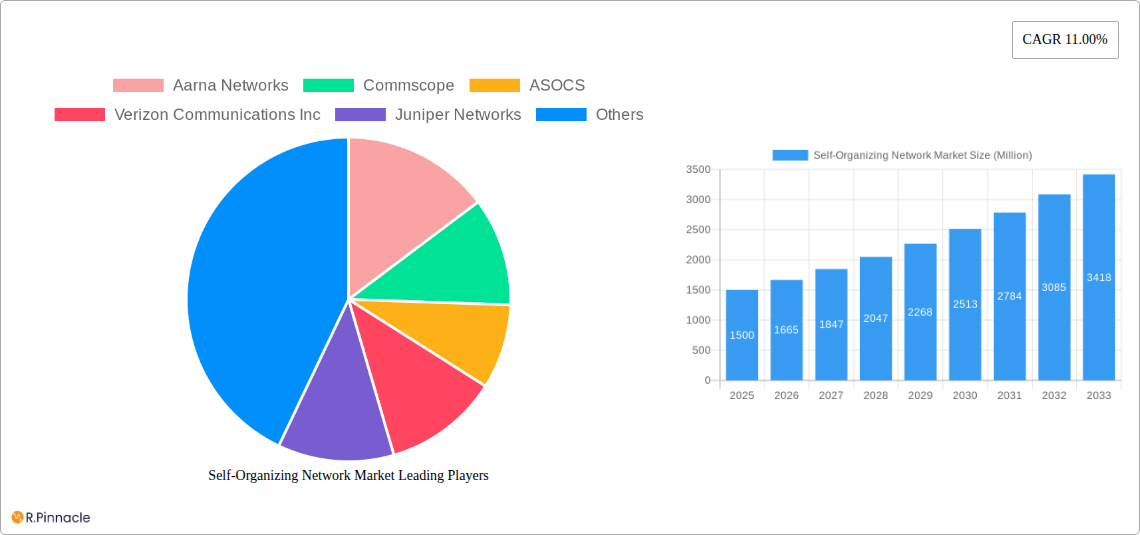
Self-Organizing Network Market Company Market Share
Self-Organizing Network Market Report: 2019-2033
This comprehensive report provides an in-depth analysis of the Self-Organizing Network (SON) market, offering actionable insights for industry professionals and investors. We delve into market structure, dynamics, regional dominance, and future trends, projecting a robust growth trajectory fueled by technological advancements and expanding 5G deployments. The report covers the period 2019-2033, with a focus on the 2025 market landscape.
Self-Organizing Network Market Market Structure & Innovation Trends
The Self-Organizing Network market is experiencing moderate consolidation, with key players such as Cisco Systems, Ericsson, and Huawei Technologies holding significant market share. The exact figures are proprietary to this report, but our analysis reveals a competitive landscape with both established giants and emerging players vying for dominance. Innovation is driven by the need for efficient network management in increasingly complex 5G environments. Regulatory frameworks vary across regions, influencing deployment strategies and market growth. Product substitutes are limited, given the specialized nature of SON technology. End-user demographics primarily comprise telecommunication operators, enterprises, and government entities. Mergers and acquisitions (M&A) activity has been relatively modest in recent years, with total deal values estimated at xx Million in the historical period. Some notable transactions include [mention specific M&A if available, otherwise omit this section].
- Market Concentration: Moderately consolidated, with several major players holding significant shares.
- Innovation Drivers: Demand for automated network management, increasing complexity of 5G networks, and improved network efficiency.
- Regulatory Frameworks: Vary by region, impacting deployment strategies and market access.
- M&A Activity: Estimated at xx Million during the historical period (2019-2024).
Self-Organizing Network Market Market Dynamics & Trends
The Self-Organizing Network market is projected to experience substantial growth during the forecast period (2025-2033), with a Compound Annual Growth Rate (CAGR) estimated at xx%. This growth is propelled by several key factors: increasing adoption of 5G technology, expanding mobile broadband networks, rising demand for improved network performance, and the growing need for efficient network management. Technological disruptions, particularly advancements in artificial intelligence (AI) and machine learning (ML), are further accelerating market expansion. Consumer preference for higher data speeds and improved network reliability is also driving demand for SON solutions. Competitive dynamics are characterized by both cooperation and competition, with leading vendors collaborating on industry standards while simultaneously striving for market share leadership. Market penetration for SON solutions remains relatively low, providing significant opportunities for expansion.
Dominant Regions & Segments in Self-Organizing Network Market
The North American region is currently the dominant market for Self-Organizing Networks, primarily driven by strong investment in 5G infrastructure and a high density of mobile subscribers. However, the Asia-Pacific region is projected to experience the fastest growth rate over the forecast period, fueled by expanding telecommunications networks and rising digital adoption.
Key Drivers:
- North America: Strong 5G investments, high mobile subscriber density.
- Asia-Pacific: Rapidly expanding telecom networks, increasing digital adoption.
- Europe: Government initiatives supporting digital transformation and 5G rollout.
Segment Dominance:
- By Offering: The services segment currently holds a larger market share than the software segment.
- By Architecture: The C-SON architecture dominates due to its established track record and wider availability.
- By Network Technology: The 4G/LTE and 5G segments are experiencing significant growth, driven by the widespread adoption of these technologies.
Self-Organizing Network Market Product Innovations
Recent advancements in Self-Organizing Network technology focus on integrating AI and ML capabilities to enhance network automation and optimization. This includes self-healing capabilities, predictive maintenance, and improved network performance management. New products emphasize seamless integration with existing network infrastructure and improved scalability to meet the demands of evolving network requirements. These innovations are improving network efficiency and reducing operational costs, making SON solutions increasingly attractive to network operators and enterprises.
Report Scope & Segmentation Analysis
This report segments the Self-Organizing Network market across various parameters:
- By Offering: Software and Services, with the services segment projected to maintain a larger market share due to higher complexity and expertise required in implementation and management.
- By Architecture: C-SON, D-SON, and H-SON, with C-SON holding a significant share due to maturity and extensive deployment.
- By Network Technology: 2G/3G, 4G/LTE, and 5G, with the 4G/LTE and 5G segments demonstrating the fastest growth owing to increased adoption.
Each segment's market size, growth projections, and competitive dynamics are analyzed in detail within the report.
Key Drivers of Self-Organizing Network Market Growth
The primary drivers of Self-Organizing Network market growth include the increasing adoption of 5G technology, growing demand for improved network performance and reliability, and the need for efficient network management in complex network environments. Technological advancements such as AI and ML are further boosting market expansion. Government initiatives promoting digital transformation and investments in telecommunications infrastructure also contribute significantly to market growth.
Challenges in the Self-Organizing Network Market Sector
Challenges include the high initial investment costs associated with implementing SON solutions, the complexity of integrating SON technology with existing network infrastructure, and the need for skilled personnel to manage and maintain SON systems. Concerns regarding cybersecurity and data privacy also pose potential barriers to market adoption. Competitive pressures from established vendors and emerging players can further impact market growth. These challenges represent approximately xx% of market barriers.
Emerging Opportunities in Self-Organizing Network Market
Emerging opportunities exist in the development of advanced AI and ML-based SON solutions, expansion into new markets such as IoT and industrial automation, and the integration of SON technology with edge computing. Growth prospects also lie in the increasing adoption of private 5G networks by enterprises and the development of solutions tailored to specific industry requirements. These opportunities represent significant potential for market expansion, estimated at xx Million by 2033.
Leading Players in the Self-Organizing Network Market Market
- Aarna Networks
- Commscope
- ASOCS
- Verizon Communications Inc
- Juniper Networks
- Gemtek Technology
- Cisco Systems
- D-Link Corporation
- Cohere Technologies
- Airhop Communications
- Huawei Technologies
- Ericsson
Key Developments in Self-Organizing Network Market Industry
- October 2022: Ericsson launched a commercial Ericsson Private 5G rollout in Sweden with X Shore, showcasing the potential of SON in private network deployments.
- October 2022: CommScope signed an agreement with Mediacom Communications for a Distributed Access Architecture (DAA) migration, highlighting the increasing importance of SON in next-generation network architectures.
- November 2022: Cisco AppDynamics launched new cloud capabilities enhancing observability, which indirectly supports efficient SON operation by improving overall network visibility.
Future Outlook for Self-Organizing Network Market Market
The future of the Self-Organizing Network market looks promising, with continued growth driven by the expanding adoption of 5G, the increasing demand for advanced network automation, and the emergence of new applications in various sectors. Strategic partnerships and investments in R&D will further fuel market expansion, creating opportunities for both established players and emerging innovators. The market is poised for significant growth, with projections indicating a substantial increase in market size and market penetration over the next decade.
Self-Organizing Network Market Segmentation
-
1. Offering
- 1.1. Software
- 1.2. Services
-
2. Architecture
- 2.1. C-SON
- 2.2. D-SON
- 2.3. H-SON
-
3. Network Technology
- 3.1. 2G/3G
- 3.2. 4G/LTE
- 3.3. 5G
Self-Organizing Network Market Segmentation By Geography
-
1. North America
- 1.1. United States
- 1.2. Canada
- 1.3. Mexico
-
2. South America
- 2.1. Brazil
- 2.2. Argentina
- 2.3. Rest of South America
-
3. Europe
- 3.1. United Kingdom
- 3.2. Germany
- 3.3. France
- 3.4. Italy
- 3.5. Spain
- 3.6. Russia
- 3.7. Benelux
- 3.8. Nordics
- 3.9. Rest of Europe
-
4. Middle East & Africa
- 4.1. Turkey
- 4.2. Israel
- 4.3. GCC
- 4.4. North Africa
- 4.5. South Africa
- 4.6. Rest of Middle East & Africa
-
5. Asia Pacific
- 5.1. China
- 5.2. India
- 5.3. Japan
- 5.4. South Korea
- 5.5. ASEAN
- 5.6. Oceania
- 5.7. Rest of Asia Pacific
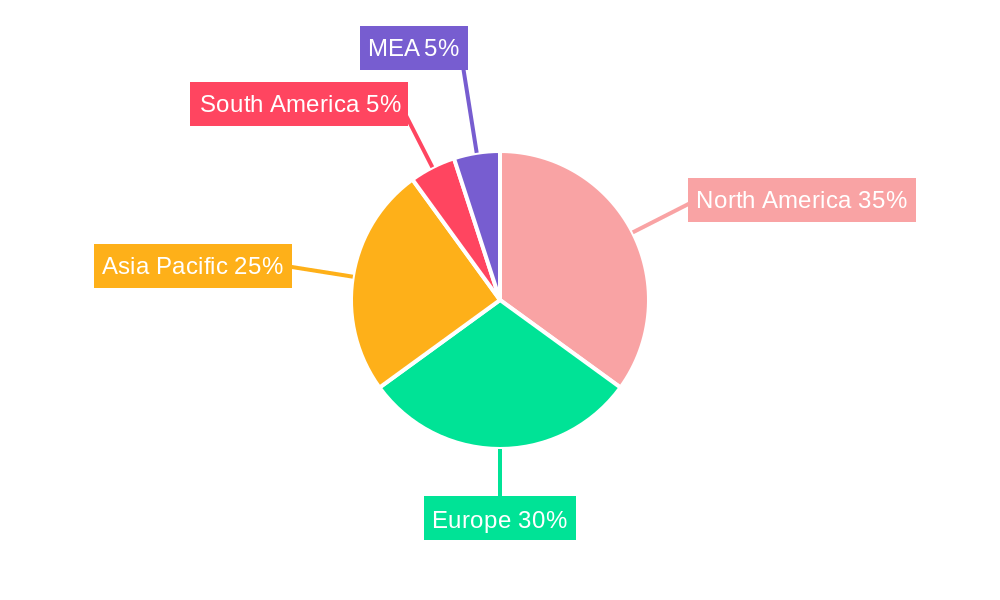
Self-Organizing Network Market Regional Market Share
Geographic Coverage of Self-Organizing Network Market
Self-Organizing Network Market REPORT HIGHLIGHTS
| Aspects | Details |
|---|---|
| Study Period | 2020-2034 |
| Base Year | 2025 |
| Estimated Year | 2026 |
| Forecast Period | 2026-2034 |
| Historical Period | 2020-2025 |
| Growth Rate | CAGR of 11.2% from 2020-2034 |
| Segmentation |
|
Table of Contents
- 1. Introduction
- 1.1. Research Scope
- 1.2. Market Segmentation
- 1.3. Research Objective
- 1.4. Definitions and Assumptions
- 2. Executive Summary
- 2.1. Market Snapshot
- 3. Market Dynamics
- 3.1. Market Drivers
- 3.2. Market Restrains
- 3.3. Market Trends
- 3.4. Market Opportunities
- 4. Market Factor Analysis
- 4.1. Porters Five Forces
- 4.1.1. Bargaining Power of Suppliers
- 4.1.2. Bargaining Power of Buyers
- 4.1.3. Threat of New Entrants
- 4.1.4. Threat of Substitutes
- 4.1.5. Competitive Rivalry
- 4.2. PESTEL analysis
- 4.3. BCG Analysis
- 4.3.1. Stars (High Growth, High Market Share)
- 4.3.2. Cash Cows (Low Growth, High Market Share)
- 4.3.3. Question Mark (High Growth, Low Market Share)
- 4.3.4. Dogs (Low Growth, Low Market Share)
- 4.4. Ansoff Matrix Analysis
- 4.5. Supply Chain Analysis
- 4.6. Regulatory Landscape
- 4.7. Current Market Potential and Opportunity Assessment (TAM–SAM–SOM Framework)
- 4.8. PRI Analyst Note
- 4.1. Porters Five Forces
- 5. Market Analysis, Insights and Forecast 2021-2033
- 5.1. Market Analysis, Insights and Forecast - by Offering
- 5.1.1. Software
- 5.1.2. Services
- 5.2. Market Analysis, Insights and Forecast - by Architecture
- 5.2.1. C-SON
- 5.2.2. D-SON
- 5.2.3. H-SON
- 5.3. Market Analysis, Insights and Forecast - by Network Technology
- 5.3.1. 2G/3G
- 5.3.2. 4G/LTE
- 5.3.3. 5G
- 5.4. Market Analysis, Insights and Forecast - by Region
- 5.4.1. North America
- 5.4.2. South America
- 5.4.3. Europe
- 5.4.4. Middle East & Africa
- 5.4.5. Asia Pacific
- 5.1. Market Analysis, Insights and Forecast - by Offering
- 6. Global Self-Organizing Network Market Analysis, Insights and Forecast, 2021-2033
- 6.1. Market Analysis, Insights and Forecast - by Offering
- 6.1.1. Software
- 6.1.2. Services
- 6.2. Market Analysis, Insights and Forecast - by Architecture
- 6.2.1. C-SON
- 6.2.2. D-SON
- 6.2.3. H-SON
- 6.3. Market Analysis, Insights and Forecast - by Network Technology
- 6.3.1. 2G/3G
- 6.3.2. 4G/LTE
- 6.3.3. 5G
- 6.1. Market Analysis, Insights and Forecast - by Offering
- 7. North America Self-Organizing Network Market Analysis, Insights and Forecast, 2020-2032
- 7.1. Market Analysis, Insights and Forecast - by Offering
- 7.1.1. Software
- 7.1.2. Services
- 7.2. Market Analysis, Insights and Forecast - by Architecture
- 7.2.1. C-SON
- 7.2.2. D-SON
- 7.2.3. H-SON
- 7.3. Market Analysis, Insights and Forecast - by Network Technology
- 7.3.1. 2G/3G
- 7.3.2. 4G/LTE
- 7.3.3. 5G
- 7.1. Market Analysis, Insights and Forecast - by Offering
- 8. South America Self-Organizing Network Market Analysis, Insights and Forecast, 2020-2032
- 8.1. Market Analysis, Insights and Forecast - by Offering
- 8.1.1. Software
- 8.1.2. Services
- 8.2. Market Analysis, Insights and Forecast - by Architecture
- 8.2.1. C-SON
- 8.2.2. D-SON
- 8.2.3. H-SON
- 8.3. Market Analysis, Insights and Forecast - by Network Technology
- 8.3.1. 2G/3G
- 8.3.2. 4G/LTE
- 8.3.3. 5G
- 8.1. Market Analysis, Insights and Forecast - by Offering
- 9. Europe Self-Organizing Network Market Analysis, Insights and Forecast, 2020-2032
- 9.1. Market Analysis, Insights and Forecast - by Offering
- 9.1.1. Software
- 9.1.2. Services
- 9.2. Market Analysis, Insights and Forecast - by Architecture
- 9.2.1. C-SON
- 9.2.2. D-SON
- 9.2.3. H-SON
- 9.3. Market Analysis, Insights and Forecast - by Network Technology
- 9.3.1. 2G/3G
- 9.3.2. 4G/LTE
- 9.3.3. 5G
- 9.1. Market Analysis, Insights and Forecast - by Offering
- 10. Middle East & Africa Self-Organizing Network Market Analysis, Insights and Forecast, 2020-2032
- 10.1. Market Analysis, Insights and Forecast - by Offering
- 10.1.1. Software
- 10.1.2. Services
- 10.2. Market Analysis, Insights and Forecast - by Architecture
- 10.2.1. C-SON
- 10.2.2. D-SON
- 10.2.3. H-SON
- 10.3. Market Analysis, Insights and Forecast - by Network Technology
- 10.3.1. 2G/3G
- 10.3.2. 4G/LTE
- 10.3.3. 5G
- 10.1. Market Analysis, Insights and Forecast - by Offering
- 11. Asia Pacific Self-Organizing Network Market Analysis, Insights and Forecast, 2020-2032
- 11.1. Market Analysis, Insights and Forecast - by Offering
- 11.1.1. Software
- 11.1.2. Services
- 11.2. Market Analysis, Insights and Forecast - by Architecture
- 11.2.1. C-SON
- 11.2.2. D-SON
- 11.2.3. H-SON
- 11.3. Market Analysis, Insights and Forecast - by Network Technology
- 11.3.1. 2G/3G
- 11.3.2. 4G/LTE
- 11.3.3. 5G
- 11.1. Market Analysis, Insights and Forecast - by Offering
- 12. Competitive Analysis
- 12.1. Company Profiles
- 12.1.1 Aarna Networks
- 12.1.1.1. Company Overview
- 12.1.1.2. Products
- 12.1.1.3. Company Financials
- 12.1.1.4. SWOT Analysis
- 12.1.2 Commscope
- 12.1.2.1. Company Overview
- 12.1.2.2. Products
- 12.1.2.3. Company Financials
- 12.1.2.4. SWOT Analysis
- 12.1.3 ASOCS
- 12.1.3.1. Company Overview
- 12.1.3.2. Products
- 12.1.3.3. Company Financials
- 12.1.3.4. SWOT Analysis
- 12.1.4 Verizon Communications Inc
- 12.1.4.1. Company Overview
- 12.1.4.2. Products
- 12.1.4.3. Company Financials
- 12.1.4.4. SWOT Analysis
- 12.1.5 Juniper Networks
- 12.1.5.1. Company Overview
- 12.1.5.2. Products
- 12.1.5.3. Company Financials
- 12.1.5.4. SWOT Analysis
- 12.1.6 Gemtek Technology
- 12.1.6.1. Company Overview
- 12.1.6.2. Products
- 12.1.6.3. Company Financials
- 12.1.6.4. SWOT Analysis
- 12.1.7 Cisco Systems
- 12.1.7.1. Company Overview
- 12.1.7.2. Products
- 12.1.7.3. Company Financials
- 12.1.7.4. SWOT Analysis
- 12.1.8 D-Link Corporation
- 12.1.8.1. Company Overview
- 12.1.8.2. Products
- 12.1.8.3. Company Financials
- 12.1.8.4. SWOT Analysis
- 12.1.9 Cohere Technologies
- 12.1.9.1. Company Overview
- 12.1.9.2. Products
- 12.1.9.3. Company Financials
- 12.1.9.4. SWOT Analysis
- 12.1.10 Airhop Communications
- 12.1.10.1. Company Overview
- 12.1.10.2. Products
- 12.1.10.3. Company Financials
- 12.1.10.4. SWOT Analysis
- 12.1.11 Huawei Technologies
- 12.1.11.1. Company Overview
- 12.1.11.2. Products
- 12.1.11.3. Company Financials
- 12.1.11.4. SWOT Analysis
- 12.1.12 Ericsson
- 12.1.12.1. Company Overview
- 12.1.12.2. Products
- 12.1.12.3. Company Financials
- 12.1.12.4. SWOT Analysis
- 12.1.1 Aarna Networks
- 12.2. Market Entropy
- 12.2.1 Company's Key Areas Served
- 12.2.2 Recent Developments
- 12.3. Company Market Share Analysis 2025
- 12.3.1 Top 5 Companies Market Share Analysis
- 12.3.2 Top 3 Companies Market Share Analysis
- 12.4. List of Potential Customers
- 13. Research Methodology
List of Figures
- Figure 1: Global Self-Organizing Network Market Revenue Breakdown (billion, %) by Region 2025 & 2033
- Figure 2: North America Self-Organizing Network Market Revenue (billion), by Offering 2025 & 2033
- Figure 3: North America Self-Organizing Network Market Revenue Share (%), by Offering 2025 & 2033
- Figure 4: North America Self-Organizing Network Market Revenue (billion), by Architecture 2025 & 2033
- Figure 5: North America Self-Organizing Network Market Revenue Share (%), by Architecture 2025 & 2033
- Figure 6: North America Self-Organizing Network Market Revenue (billion), by Network Technology 2025 & 2033
- Figure 7: North America Self-Organizing Network Market Revenue Share (%), by Network Technology 2025 & 2033
- Figure 8: North America Self-Organizing Network Market Revenue (billion), by Country 2025 & 2033
- Figure 9: North America Self-Organizing Network Market Revenue Share (%), by Country 2025 & 2033
- Figure 10: South America Self-Organizing Network Market Revenue (billion), by Offering 2025 & 2033
- Figure 11: South America Self-Organizing Network Market Revenue Share (%), by Offering 2025 & 2033
- Figure 12: South America Self-Organizing Network Market Revenue (billion), by Architecture 2025 & 2033
- Figure 13: South America Self-Organizing Network Market Revenue Share (%), by Architecture 2025 & 2033
- Figure 14: South America Self-Organizing Network Market Revenue (billion), by Network Technology 2025 & 2033
- Figure 15: South America Self-Organizing Network Market Revenue Share (%), by Network Technology 2025 & 2033
- Figure 16: South America Self-Organizing Network Market Revenue (billion), by Country 2025 & 2033
- Figure 17: South America Self-Organizing Network Market Revenue Share (%), by Country 2025 & 2033
- Figure 18: Europe Self-Organizing Network Market Revenue (billion), by Offering 2025 & 2033
- Figure 19: Europe Self-Organizing Network Market Revenue Share (%), by Offering 2025 & 2033
- Figure 20: Europe Self-Organizing Network Market Revenue (billion), by Architecture 2025 & 2033
- Figure 21: Europe Self-Organizing Network Market Revenue Share (%), by Architecture 2025 & 2033
- Figure 22: Europe Self-Organizing Network Market Revenue (billion), by Network Technology 2025 & 2033
- Figure 23: Europe Self-Organizing Network Market Revenue Share (%), by Network Technology 2025 & 2033
- Figure 24: Europe Self-Organizing Network Market Revenue (billion), by Country 2025 & 2033
- Figure 25: Europe Self-Organizing Network Market Revenue Share (%), by Country 2025 & 2033
- Figure 26: Middle East & Africa Self-Organizing Network Market Revenue (billion), by Offering 2025 & 2033
- Figure 27: Middle East & Africa Self-Organizing Network Market Revenue Share (%), by Offering 2025 & 2033
- Figure 28: Middle East & Africa Self-Organizing Network Market Revenue (billion), by Architecture 2025 & 2033
- Figure 29: Middle East & Africa Self-Organizing Network Market Revenue Share (%), by Architecture 2025 & 2033
- Figure 30: Middle East & Africa Self-Organizing Network Market Revenue (billion), by Network Technology 2025 & 2033
- Figure 31: Middle East & Africa Self-Organizing Network Market Revenue Share (%), by Network Technology 2025 & 2033
- Figure 32: Middle East & Africa Self-Organizing Network Market Revenue (billion), by Country 2025 & 2033
- Figure 33: Middle East & Africa Self-Organizing Network Market Revenue Share (%), by Country 2025 & 2033
- Figure 34: Asia Pacific Self-Organizing Network Market Revenue (billion), by Offering 2025 & 2033
- Figure 35: Asia Pacific Self-Organizing Network Market Revenue Share (%), by Offering 2025 & 2033
- Figure 36: Asia Pacific Self-Organizing Network Market Revenue (billion), by Architecture 2025 & 2033
- Figure 37: Asia Pacific Self-Organizing Network Market Revenue Share (%), by Architecture 2025 & 2033
- Figure 38: Asia Pacific Self-Organizing Network Market Revenue (billion), by Network Technology 2025 & 2033
- Figure 39: Asia Pacific Self-Organizing Network Market Revenue Share (%), by Network Technology 2025 & 2033
- Figure 40: Asia Pacific Self-Organizing Network Market Revenue (billion), by Country 2025 & 2033
- Figure 41: Asia Pacific Self-Organizing Network Market Revenue Share (%), by Country 2025 & 2033
List of Tables
- Table 1: Global Self-Organizing Network Market Revenue billion Forecast, by Offering 2020 & 2033
- Table 2: Global Self-Organizing Network Market Revenue billion Forecast, by Architecture 2020 & 2033
- Table 3: Global Self-Organizing Network Market Revenue billion Forecast, by Network Technology 2020 & 2033
- Table 4: Global Self-Organizing Network Market Revenue billion Forecast, by Region 2020 & 2033
- Table 5: Global Self-Organizing Network Market Revenue billion Forecast, by Offering 2020 & 2033
- Table 6: Global Self-Organizing Network Market Revenue billion Forecast, by Architecture 2020 & 2033
- Table 7: Global Self-Organizing Network Market Revenue billion Forecast, by Network Technology 2020 & 2033
- Table 8: Global Self-Organizing Network Market Revenue billion Forecast, by Country 2020 & 2033
- Table 9: United States Self-Organizing Network Market Revenue (billion) Forecast, by Application 2020 & 2033
- Table 10: Canada Self-Organizing Network Market Revenue (billion) Forecast, by Application 2020 & 2033
- Table 11: Mexico Self-Organizing Network Market Revenue (billion) Forecast, by Application 2020 & 2033
- Table 12: Global Self-Organizing Network Market Revenue billion Forecast, by Offering 2020 & 2033
- Table 13: Global Self-Organizing Network Market Revenue billion Forecast, by Architecture 2020 & 2033
- Table 14: Global Self-Organizing Network Market Revenue billion Forecast, by Network Technology 2020 & 2033
- Table 15: Global Self-Organizing Network Market Revenue billion Forecast, by Country 2020 & 2033
- Table 16: Brazil Self-Organizing Network Market Revenue (billion) Forecast, by Application 2020 & 2033
- Table 17: Argentina Self-Organizing Network Market Revenue (billion) Forecast, by Application 2020 & 2033
- Table 18: Rest of South America Self-Organizing Network Market Revenue (billion) Forecast, by Application 2020 & 2033
- Table 19: Global Self-Organizing Network Market Revenue billion Forecast, by Offering 2020 & 2033
- Table 20: Global Self-Organizing Network Market Revenue billion Forecast, by Architecture 2020 & 2033
- Table 21: Global Self-Organizing Network Market Revenue billion Forecast, by Network Technology 2020 & 2033
- Table 22: Global Self-Organizing Network Market Revenue billion Forecast, by Country 2020 & 2033
- Table 23: United Kingdom Self-Organizing Network Market Revenue (billion) Forecast, by Application 2020 & 2033
- Table 24: Germany Self-Organizing Network Market Revenue (billion) Forecast, by Application 2020 & 2033
- Table 25: France Self-Organizing Network Market Revenue (billion) Forecast, by Application 2020 & 2033
- Table 26: Italy Self-Organizing Network Market Revenue (billion) Forecast, by Application 2020 & 2033
- Table 27: Spain Self-Organizing Network Market Revenue (billion) Forecast, by Application 2020 & 2033
- Table 28: Russia Self-Organizing Network Market Revenue (billion) Forecast, by Application 2020 & 2033
- Table 29: Benelux Self-Organizing Network Market Revenue (billion) Forecast, by Application 2020 & 2033
- Table 30: Nordics Self-Organizing Network Market Revenue (billion) Forecast, by Application 2020 & 2033
- Table 31: Rest of Europe Self-Organizing Network Market Revenue (billion) Forecast, by Application 2020 & 2033
- Table 32: Global Self-Organizing Network Market Revenue billion Forecast, by Offering 2020 & 2033
- Table 33: Global Self-Organizing Network Market Revenue billion Forecast, by Architecture 2020 & 2033
- Table 34: Global Self-Organizing Network Market Revenue billion Forecast, by Network Technology 2020 & 2033
- Table 35: Global Self-Organizing Network Market Revenue billion Forecast, by Country 2020 & 2033
- Table 36: Turkey Self-Organizing Network Market Revenue (billion) Forecast, by Application 2020 & 2033
- Table 37: Israel Self-Organizing Network Market Revenue (billion) Forecast, by Application 2020 & 2033
- Table 38: GCC Self-Organizing Network Market Revenue (billion) Forecast, by Application 2020 & 2033
- Table 39: North Africa Self-Organizing Network Market Revenue (billion) Forecast, by Application 2020 & 2033
- Table 40: South Africa Self-Organizing Network Market Revenue (billion) Forecast, by Application 2020 & 2033
- Table 41: Rest of Middle East & Africa Self-Organizing Network Market Revenue (billion) Forecast, by Application 2020 & 2033
- Table 42: Global Self-Organizing Network Market Revenue billion Forecast, by Offering 2020 & 2033
- Table 43: Global Self-Organizing Network Market Revenue billion Forecast, by Architecture 2020 & 2033
- Table 44: Global Self-Organizing Network Market Revenue billion Forecast, by Network Technology 2020 & 2033
- Table 45: Global Self-Organizing Network Market Revenue billion Forecast, by Country 2020 & 2033
- Table 46: China Self-Organizing Network Market Revenue (billion) Forecast, by Application 2020 & 2033
- Table 47: India Self-Organizing Network Market Revenue (billion) Forecast, by Application 2020 & 2033
- Table 48: Japan Self-Organizing Network Market Revenue (billion) Forecast, by Application 2020 & 2033
- Table 49: South Korea Self-Organizing Network Market Revenue (billion) Forecast, by Application 2020 & 2033
- Table 50: ASEAN Self-Organizing Network Market Revenue (billion) Forecast, by Application 2020 & 2033
- Table 51: Oceania Self-Organizing Network Market Revenue (billion) Forecast, by Application 2020 & 2033
- Table 52: Rest of Asia Pacific Self-Organizing Network Market Revenue (billion) Forecast, by Application 2020 & 2033
Frequently Asked Questions
1. What is the projected Compound Annual Growth Rate (CAGR) of the Self-Organizing Network Market?
The projected CAGR is approximately 11.2%.
2. Which companies are prominent players in the Self-Organizing Network Market?
Key companies in the market include Aarna Networks, Commscope, ASOCS, Verizon Communications Inc, Juniper Networks, Gemtek Technology, Cisco Systems, D-Link Corporation, Cohere Technologies, Airhop Communications, Huawei Technologies, Ericsson.
3. What are the main segments of the Self-Organizing Network Market?
The market segments include Offering , Architecture, Network Technology.
4. Can you provide details about the market size?
The market size is estimated to be USD 6.55 billion as of 2022.
5. What are some drivers contributing to market growth?
High demad for Wireless connectivity; Increasing demand for 4G and 5G Networks.
6. What are the notable trends driving market growth?
Increasing demand for 5G Networks.
7. Are there any restraints impacting market growth?
High Implementation Cost.
8. Can you provide examples of recent developments in the market?
November 2022 - Cisco AppDynamics launched new AppDynamics Cloud capabilities that allow organizations to achieve observability over cloud-native applications correlated to business context across the entire IT estate.
9. What pricing options are available for accessing the report?
Pricing options include single-user, multi-user, and enterprise licenses priced at USD 4750, USD 5250, and USD 8750 respectively.
10. Is the market size provided in terms of value or volume?
The market size is provided in terms of value, measured in billion.
11. Are there any specific market keywords associated with the report?
Yes, the market keyword associated with the report is "Self-Organizing Network Market," which aids in identifying and referencing the specific market segment covered.
12. How do I determine which pricing option suits my needs best?
The pricing options vary based on user requirements and access needs. Individual users may opt for single-user licenses, while businesses requiring broader access may choose multi-user or enterprise licenses for cost-effective access to the report.
13. Are there any additional resources or data provided in the Self-Organizing Network Market report?
While the report offers comprehensive insights, it's advisable to review the specific contents or supplementary materials provided to ascertain if additional resources or data are available.
14. How can I stay updated on further developments or reports in the Self-Organizing Network Market?
To stay informed about further developments, trends, and reports in the Self-Organizing Network Market, consider subscribing to industry newsletters, following relevant companies and organizations, or regularly checking reputable industry news sources and publications.
Methodology
Step 1 - Identification of Relevant Samples Size from Population Database


Step 2 - Approaches for Defining Global Market Size (Value, Volume* & Price*)

Note*: In applicable scenarios
Step 3 - Data Sources
Primary Research
- Web Analytics
- Survey Reports
- Research Institute
- Latest Research Reports
- Opinion Leaders
Secondary Research
- Annual Reports
- White Paper
- Latest Press Release
- Industry Association
- Paid Database
- Investor Presentations

Step 4 - Data Triangulation
Involves using different sources of information in order to increase the validity of a study
These sources are likely to be stakeholders in a program - participants, other researchers, program staff, other community members, and so on.
Then we put all data in single framework & apply various statistical tools to find out the dynamic on the market.
During the analysis stage, feedback from the stakeholder groups would be compared to determine areas of agreement as well as areas of divergence