Key Insights
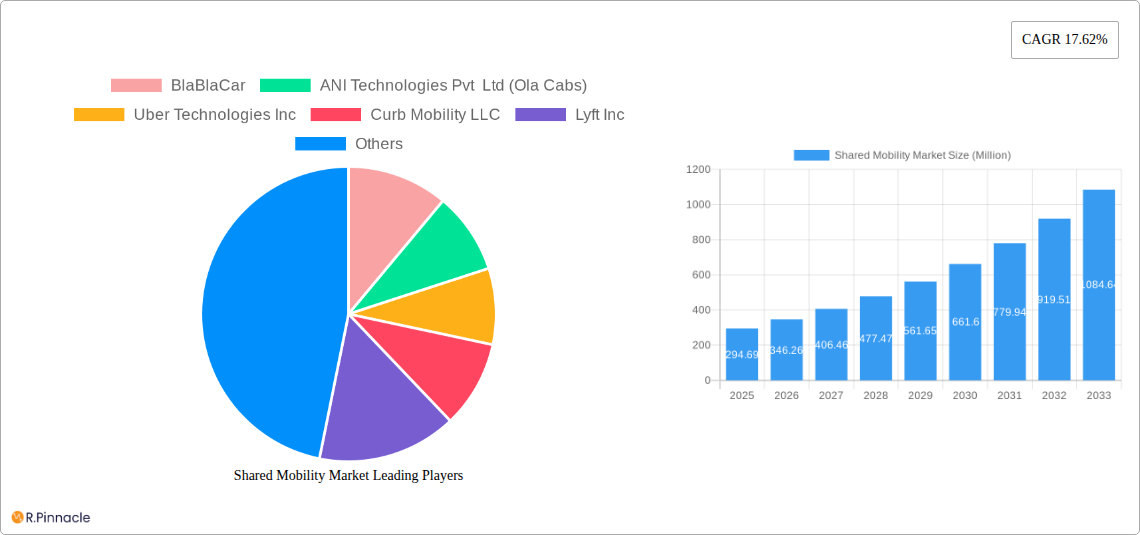
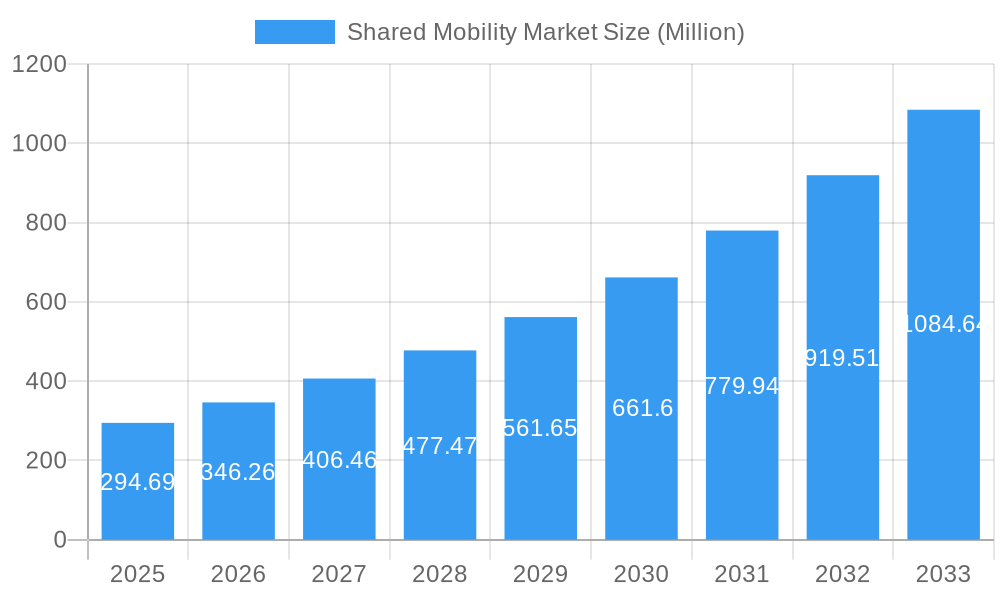
The global shared mobility market, valued at $294.69 million in 2025, is experiencing robust growth, projected to expand significantly by 2033. A Compound Annual Growth Rate (CAGR) of 17.62% underscores the market's dynamism, driven by several key factors. Increasing urbanization and traffic congestion in major cities are compelling individuals to embrace shared mobility solutions as a convenient and cost-effective alternative to private vehicle ownership. The rising adoption of electric vehicles (EVs) within the shared mobility sector further fuels this growth, aligning with global sustainability initiatives and reducing carbon footprints. Technological advancements, such as improved ride-hailing apps, real-time vehicle tracking, and sophisticated route optimization algorithms, enhance user experience and operational efficiency. Furthermore, evolving business models, including peer-to-peer (P2P) sharing and subscription services, are expanding market access and catering to diverse consumer preferences. Government initiatives promoting sustainable transportation and the integration of shared mobility into public transit systems are also contributing to market expansion.
Shared Mobility Market Market Size (In Million)
However, the market faces certain challenges. Regulatory hurdles and varying legal frameworks across different regions can create operational complexities and hinder market penetration. Concerns regarding data privacy and security in ride-hailing apps remain a crucial consideration. Fluctuations in fuel prices, particularly for ICE vehicles, can impact operational costs and profitability. Competition among established players and the emergence of new entrants intensifies the market landscape, demanding strategic adaptability and innovation. Moreover, ensuring the safety and security of both passengers and drivers remains paramount, requiring robust safety protocols and background checks. Addressing these challenges while capitalizing on the market's growth potential will be critical for stakeholders in the coming years. The diverse segments – including ride-hailing, car-sharing, micromobility, and various vehicle types – present multiple opportunities for growth and diversification. The market’s future success will depend on a combination of technological innovation, robust regulatory frameworks, and a commitment to sustainability.
Shared Mobility Market Company Market Share
Shared Mobility Market Report: 2019-2033
This comprehensive report provides an in-depth analysis of the global Shared Mobility Market, offering invaluable insights for industry professionals, investors, and strategic decision-makers. Covering the period from 2019 to 2033, with a focus on 2025, this report dissects market dynamics, trends, and future projections, empowering you to navigate the rapidly evolving landscape of shared transportation. The study encompasses key segments including ride-hailing, car-sharing, micromobility, and rental services, analyzing market size, growth, and competitive landscapes across various regions and business models.
Shared Mobility Market Structure & Innovation Trends
This section analyzes the competitive landscape of the shared mobility market, examining market concentration, innovation drivers, regulatory frameworks, and mergers & acquisitions (M&A) activities.
The market is characterized by a high degree of competition, with key players such as Uber Technologies Inc, Lyft Inc, and Didi Chuxing holding significant market share. However, smaller players and innovative startups are also emerging, contributing to a dynamic market structure. The combined market share of the top 5 players in 2025 is estimated at xx%.
- Market Concentration: High, with a few dominant players and numerous smaller competitors.
- Innovation Drivers: Technological advancements (e.g., autonomous vehicles, electrification), evolving consumer preferences (e.g., convenience, sustainability), and supportive government policies.
- Regulatory Frameworks: Vary widely across regions, influencing market access and operational costs. Stringent regulations in some areas create barriers to entry, while more lenient regulations encourage competition.
- Product Substitutes: Public transportation, private car ownership, and alternative mobility solutions.
- End-User Demographics: Primarily young urban professionals and tourists, although expanding to other demographics.
- M&A Activities: Significant M&A activity observed in recent years, including the December 2023 merger of CarDekho and Revv, valued at approximately xx Million. These activities reflect consolidation trends and efforts to expand market reach. The total value of M&A deals in the shared mobility sector from 2019-2024 is estimated at xx Million.
Shared Mobility Market Dynamics & Trends
This section delves into the driving forces shaping the shared mobility market, analyzing market growth, technological advancements, evolving consumer preferences, and competitive pressures.
The global shared mobility market is experiencing rapid growth, driven by urbanization, increasing traffic congestion, rising fuel costs, and growing environmental concerns. The market is witnessing significant technological disruptions, including the adoption of electric vehicles, autonomous driving technology, and innovative mobile applications. Consumer preferences are shifting towards convenience, affordability, and sustainability, leading to increased demand for shared mobility services. The competitive landscape is intensely competitive, with established players and new entrants vying for market share. The CAGR for the forecast period (2025-2033) is projected to be xx%, with market penetration expected to reach xx% by 2033.
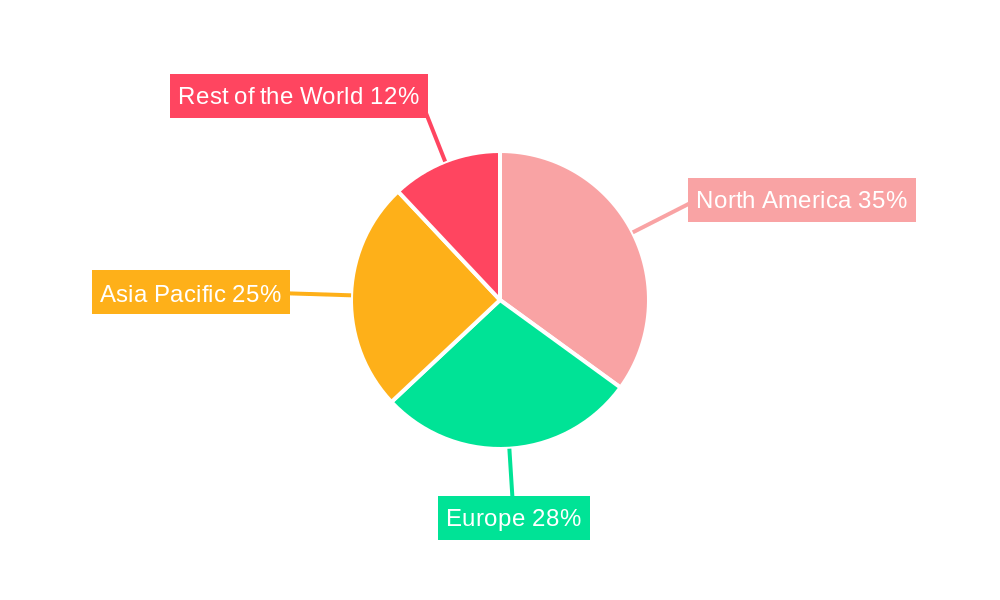
Dominant Regions & Segments in Shared Mobility Market
This section identifies the leading regions, countries, and market segments within the shared mobility sector.
Leading Regions: North America and Asia-Pacific currently dominate the market due to high population density, robust technological infrastructure, and favorable regulatory environments. Europe is also a significant market, with strong growth potential.
- Key Drivers for North America: High disposable incomes, well-developed infrastructure, and early adoption of shared mobility services.
- Key Drivers for Asia-Pacific: Rapid urbanization, increasing smartphone penetration, and a large population base.
- Key Drivers for Europe: Government support for sustainable transportation, well-established public transportation networks, and increasing environmental awareness.
Dominant Segments:
- By Type: Ride-hailing currently holds the largest market share, followed by car sharing and shared micromobility.
- By Vehicle Type: Passenger cars constitute the majority of the market, but the share of electric vehicles is increasing rapidly.
- By Business Model: B2C remains the largest segment, while B2B is experiencing significant growth.
- By Propulsion Type: ICE vehicles still dominate, but electric vehicles are gaining traction due to environmental concerns and government incentives.
Shared Mobility Market Product Innovations
The shared mobility market is characterized by continuous product innovation, driven by technological advancements and evolving customer needs. Recent innovations include the introduction of electric scooters and bikes, the integration of AI and machine learning for improved ride matching and route optimization, and the development of autonomous vehicle technology. These advancements enhance user experience, improve operational efficiency, and contribute to the overall growth of the market.
Report Scope & Segmentation Analysis
This report segments the shared mobility market by type (Ride-Hailing, Car Sharing, Shared Micromobility, Rental and Leasing, Others), vehicle type (Passenger Cars, Light Commercial Vehicles, Buses and Coaches, Two-Wheelers), business model (P2P, B2B, B2C), and propulsion type (ICE, Electric). Each segment's growth projections, market size, and competitive dynamics are analyzed. For example, the ride-hailing segment is expected to maintain its dominant position, with a xx% CAGR during the forecast period, while the electric vehicle segment is poised for exponential growth driven by environmental concerns and government regulations.
Key Drivers of Shared Mobility Market Growth
Several factors contribute to the growth of the shared mobility market, including: technological advancements (e.g., the development of autonomous vehicles and ride-hailing apps), economic factors (e.g., rising fuel prices and urbanization), and supportive government policies (e.g., investments in public transportation infrastructure and incentives for electric vehicles). Furthermore, increasing environmental awareness is driving demand for sustainable transportation options.
Challenges in the Shared Mobility Market Sector
The shared mobility market faces various challenges, including regulatory hurdles (e.g., licensing requirements and safety regulations), supply chain disruptions (e.g., shortages of vehicles and skilled labor), and intense competition. These factors can affect market growth and profitability.
Emerging Opportunities in Shared Mobility Market
Emerging opportunities exist in the expansion into new markets (e.g., developing countries), the integration of new technologies (e.g., blockchain and AI), and the development of innovative services (e.g., subscription-based mobility). These opportunities promise significant growth potential for businesses in the shared mobility sector.
Leading Players in the Shared Mobility Market Market
- BlaBlaCar
- ANI Technologies Pvt Ltd (Ola Cabs)
- Uber Technologies Inc
- Curb Mobility LLC
- Lyft Inc
- Beijing Didi Chuxing Technology Co Ltd
- Cabify
- Zoomcar Holdings
- Revv
- Drive Now (BMW AG)
- Wingz Inc
- Europcar Mobility Group
- Hertz Global Holdings
- Avis Budget Group Inc
- Grab Holdings Inc
Key Developments in Shared Mobility Market Industry
- July 2023: Bolt surpasses 150 Million customers globally.
- July 2023: inDrive launches in South Florida and plans expansion in Nigeria.
- December 2023: CarDekho and Revv merge to create a major player in India's shared car rental market.
Future Outlook for Shared Mobility Market Market
The future of the shared mobility market is promising, with continued growth expected across all segments. Technological innovations, evolving consumer preferences, and supportive government policies will drive market expansion. Strategic partnerships, mergers and acquisitions, and the development of innovative business models will shape the competitive landscape and create new opportunities for growth.
Shared Mobility Market Segmentation
-
1. Type
- 1.1. Ride-Hailing
- 1.2. Car Sharing
- 1.3. Shared Micromobility (E-Bikes, E-Scooters, etc.)
- 1.4. Rental and Leasing
- 1.5. Others (Shuttle Services, Bus Services, etc.)
-
2. Vehicle Type
- 2.1. Passenger Cars
- 2.2. Light Commercial Vehicles (Pickup Vans, etc.)
- 2.3. Buses and Coaches
- 2.4. Two-Wheelers
-
3. Business Model
- 3.1. Peer-to-Peer (P2P)
- 3.2. Business-to-Business (B2B)
- 3.3. Business-to-Consumer (B2C)
-
4. Propulsion Type
- 4.1. Internal Combustion Engine (ICE)
- 4.2. Electric
Shared Mobility Market Segmentation By Geography
-
1. North America
- 1.1. United States
- 1.2. Canada
- 1.3. Rest of North America
-
2. Europe
- 2.1. Germany
- 2.2. United Kingdom
- 2.3. France
- 2.4. Italy
- 2.5. Rest of Europe
-
3. Asia Pacific
- 3.1. China
- 3.2. India
- 3.3. Japan
- 3.4. South Korea
- 3.5. Rest of Asia Pacific
-
4. Rest of the World
- 4.1. South America
- 4.2. Middle East and Africa
Shared Mobility Market Regional Market Share
Geographic Coverage of Shared Mobility Market
Shared Mobility Market REPORT HIGHLIGHTS
| Aspects | Details |
|---|---|
| Study Period | 2020-2034 |
| Base Year | 2025 |
| Estimated Year | 2026 |
| Forecast Period | 2026-2034 |
| Historical Period | 2020-2025 |
| Growth Rate | CAGR of 17.62% from 2020-2034 |
| Segmentation |
|
Table of Contents
- 1. Introduction
- 1.1. Research Scope
- 1.2. Market Segmentation
- 1.3. Research Objective
- 1.4. Definitions and Assumptions
- 2. Executive Summary
- 2.1. Market Snapshot
- 3. Market Dynamics
- 3.1. Market Drivers
- 3.2. Market Restrains
- 3.3. Market Trends
- 3.4. Market Opportunities
- 4. Market Factor Analysis
- 4.1. Porters Five Forces
- 4.1.1. Bargaining Power of Suppliers
- 4.1.2. Bargaining Power of Buyers
- 4.1.3. Threat of New Entrants
- 4.1.4. Threat of Substitutes
- 4.1.5. Competitive Rivalry
- 4.2. PESTEL analysis
- 4.3. BCG Analysis
- 4.3.1. Stars (High Growth, High Market Share)
- 4.3.2. Cash Cows (Low Growth, High Market Share)
- 4.3.3. Question Mark (High Growth, Low Market Share)
- 4.3.4. Dogs (Low Growth, Low Market Share)
- 4.4. Ansoff Matrix Analysis
- 4.5. Supply Chain Analysis
- 4.6. Regulatory Landscape
- 4.7. Current Market Potential and Opportunity Assessment (TAM–SAM–SOM Framework)
- 4.8. PRI Analyst Note
- 4.1. Porters Five Forces
- 5. Market Analysis, Insights and Forecast 2021-2033
- 5.1. Market Analysis, Insights and Forecast - by Type
- 5.1.1. Ride-Hailing
- 5.1.2. Car Sharing
- 5.1.3. Shared Micromobility (E-Bikes, E-Scooters, etc.)
- 5.1.4. Rental and Leasing
- 5.1.5. Others (Shuttle Services, Bus Services, etc.)
- 5.2. Market Analysis, Insights and Forecast - by Vehicle Type
- 5.2.1. Passenger Cars
- 5.2.2. Light Commercial Vehicles (Pickup Vans, etc.)
- 5.2.3. Buses and Coaches
- 5.2.4. Two-Wheelers
- 5.3. Market Analysis, Insights and Forecast - by Business Model
- 5.3.1. Peer-to-Peer (P2P)
- 5.3.2. Business-to-Business (B2B)
- 5.3.3. Business-to-Consumer (B2C)
- 5.4. Market Analysis, Insights and Forecast - by Propulsion Type
- 5.4.1. Internal Combustion Engine (ICE)
- 5.4.2. Electric
- 5.5. Market Analysis, Insights and Forecast - by Region
- 5.5.1. North America
- 5.5.2. Europe
- 5.5.3. Asia Pacific
- 5.5.4. Rest of the World
- 5.1. Market Analysis, Insights and Forecast - by Type
- 6. Global Shared Mobility Market Analysis, Insights and Forecast, 2021-2033
- 6.1. Market Analysis, Insights and Forecast - by Type
- 6.1.1. Ride-Hailing
- 6.1.2. Car Sharing
- 6.1.3. Shared Micromobility (E-Bikes, E-Scooters, etc.)
- 6.1.4. Rental and Leasing
- 6.1.5. Others (Shuttle Services, Bus Services, etc.)
- 6.2. Market Analysis, Insights and Forecast - by Vehicle Type
- 6.2.1. Passenger Cars
- 6.2.2. Light Commercial Vehicles (Pickup Vans, etc.)
- 6.2.3. Buses and Coaches
- 6.2.4. Two-Wheelers
- 6.3. Market Analysis, Insights and Forecast - by Business Model
- 6.3.1. Peer-to-Peer (P2P)
- 6.3.2. Business-to-Business (B2B)
- 6.3.3. Business-to-Consumer (B2C)
- 6.4. Market Analysis, Insights and Forecast - by Propulsion Type
- 6.4.1. Internal Combustion Engine (ICE)
- 6.4.2. Electric
- 6.1. Market Analysis, Insights and Forecast - by Type
- 7. North America Shared Mobility Market Analysis, Insights and Forecast, 2020-2032
- 7.1. Market Analysis, Insights and Forecast - by Type
- 7.1.1. Ride-Hailing
- 7.1.2. Car Sharing
- 7.1.3. Shared Micromobility (E-Bikes, E-Scooters, etc.)
- 7.1.4. Rental and Leasing
- 7.1.5. Others (Shuttle Services, Bus Services, etc.)
- 7.2. Market Analysis, Insights and Forecast - by Vehicle Type
- 7.2.1. Passenger Cars
- 7.2.2. Light Commercial Vehicles (Pickup Vans, etc.)
- 7.2.3. Buses and Coaches
- 7.2.4. Two-Wheelers
- 7.3. Market Analysis, Insights and Forecast - by Business Model
- 7.3.1. Peer-to-Peer (P2P)
- 7.3.2. Business-to-Business (B2B)
- 7.3.3. Business-to-Consumer (B2C)
- 7.4. Market Analysis, Insights and Forecast - by Propulsion Type
- 7.4.1. Internal Combustion Engine (ICE)
- 7.4.2. Electric
- 7.1. Market Analysis, Insights and Forecast - by Type
- 8. Europe Shared Mobility Market Analysis, Insights and Forecast, 2020-2032
- 8.1. Market Analysis, Insights and Forecast - by Type
- 8.1.1. Ride-Hailing
- 8.1.2. Car Sharing
- 8.1.3. Shared Micromobility (E-Bikes, E-Scooters, etc.)
- 8.1.4. Rental and Leasing
- 8.1.5. Others (Shuttle Services, Bus Services, etc.)
- 8.2. Market Analysis, Insights and Forecast - by Vehicle Type
- 8.2.1. Passenger Cars
- 8.2.2. Light Commercial Vehicles (Pickup Vans, etc.)
- 8.2.3. Buses and Coaches
- 8.2.4. Two-Wheelers
- 8.3. Market Analysis, Insights and Forecast - by Business Model
- 8.3.1. Peer-to-Peer (P2P)
- 8.3.2. Business-to-Business (B2B)
- 8.3.3. Business-to-Consumer (B2C)
- 8.4. Market Analysis, Insights and Forecast - by Propulsion Type
- 8.4.1. Internal Combustion Engine (ICE)
- 8.4.2. Electric
- 8.1. Market Analysis, Insights and Forecast - by Type
- 9. Asia Pacific Shared Mobility Market Analysis, Insights and Forecast, 2020-2032
- 9.1. Market Analysis, Insights and Forecast - by Type
- 9.1.1. Ride-Hailing
- 9.1.2. Car Sharing
- 9.1.3. Shared Micromobility (E-Bikes, E-Scooters, etc.)
- 9.1.4. Rental and Leasing
- 9.1.5. Others (Shuttle Services, Bus Services, etc.)
- 9.2. Market Analysis, Insights and Forecast - by Vehicle Type
- 9.2.1. Passenger Cars
- 9.2.2. Light Commercial Vehicles (Pickup Vans, etc.)
- 9.2.3. Buses and Coaches
- 9.2.4. Two-Wheelers
- 9.3. Market Analysis, Insights and Forecast - by Business Model
- 9.3.1. Peer-to-Peer (P2P)
- 9.3.2. Business-to-Business (B2B)
- 9.3.3. Business-to-Consumer (B2C)
- 9.4. Market Analysis, Insights and Forecast - by Propulsion Type
- 9.4.1. Internal Combustion Engine (ICE)
- 9.4.2. Electric
- 9.1. Market Analysis, Insights and Forecast - by Type
- 10. Rest of the World Shared Mobility Market Analysis, Insights and Forecast, 2020-2032
- 10.1. Market Analysis, Insights and Forecast - by Type
- 10.1.1. Ride-Hailing
- 10.1.2. Car Sharing
- 10.1.3. Shared Micromobility (E-Bikes, E-Scooters, etc.)
- 10.1.4. Rental and Leasing
- 10.1.5. Others (Shuttle Services, Bus Services, etc.)
- 10.2. Market Analysis, Insights and Forecast - by Vehicle Type
- 10.2.1. Passenger Cars
- 10.2.2. Light Commercial Vehicles (Pickup Vans, etc.)
- 10.2.3. Buses and Coaches
- 10.2.4. Two-Wheelers
- 10.3. Market Analysis, Insights and Forecast - by Business Model
- 10.3.1. Peer-to-Peer (P2P)
- 10.3.2. Business-to-Business (B2B)
- 10.3.3. Business-to-Consumer (B2C)
- 10.4. Market Analysis, Insights and Forecast - by Propulsion Type
- 10.4.1. Internal Combustion Engine (ICE)
- 10.4.2. Electric
- 10.1. Market Analysis, Insights and Forecast - by Type
- 11. Competitive Analysis
- 11.1. Company Profiles
- 11.1.1 BlaBlaCar
- 11.1.1.1. Company Overview
- 11.1.1.2. Products
- 11.1.1.3. Company Financials
- 11.1.1.4. SWOT Analysis
- 11.1.2 ANI Technologies Pvt Ltd (Ola Cabs)
- 11.1.2.1. Company Overview
- 11.1.2.2. Products
- 11.1.2.3. Company Financials
- 11.1.2.4. SWOT Analysis
- 11.1.3 Uber Technologies Inc
- 11.1.3.1. Company Overview
- 11.1.3.2. Products
- 11.1.3.3. Company Financials
- 11.1.3.4. SWOT Analysis
- 11.1.4 Curb Mobility LLC
- 11.1.4.1. Company Overview
- 11.1.4.2. Products
- 11.1.4.3. Company Financials
- 11.1.4.4. SWOT Analysis
- 11.1.5 Lyft Inc
- 11.1.5.1. Company Overview
- 11.1.5.2. Products
- 11.1.5.3. Company Financials
- 11.1.5.4. SWOT Analysis
- 11.1.6 Beijing Didi Chuxing Technology Co Ltd
- 11.1.6.1. Company Overview
- 11.1.6.2. Products
- 11.1.6.3. Company Financials
- 11.1.6.4. SWOT Analysis
- 11.1.7 Cabify
- 11.1.7.1. Company Overview
- 11.1.7.2. Products
- 11.1.7.3. Company Financials
- 11.1.7.4. SWOT Analysis
- 11.1.8 Zoomcar Holdings
- 11.1.8.1. Company Overview
- 11.1.8.2. Products
- 11.1.8.3. Company Financials
- 11.1.8.4. SWOT Analysis
- 11.1.9 Revv
- 11.1.9.1. Company Overview
- 11.1.9.2. Products
- 11.1.9.3. Company Financials
- 11.1.9.4. SWOT Analysis
- 11.1.10 Drive Now (BMW AG)
- 11.1.10.1. Company Overview
- 11.1.10.2. Products
- 11.1.10.3. Company Financials
- 11.1.10.4. SWOT Analysis
- 11.1.11 Wingz Inc
- 11.1.11.1. Company Overview
- 11.1.11.2. Products
- 11.1.11.3. Company Financials
- 11.1.11.4. SWOT Analysis
- 11.1.12 Europcar Mobility Group
- 11.1.12.1. Company Overview
- 11.1.12.2. Products
- 11.1.12.3. Company Financials
- 11.1.12.4. SWOT Analysis
- 11.1.13 Hertz Global Holdings
- 11.1.13.1. Company Overview
- 11.1.13.2. Products
- 11.1.13.3. Company Financials
- 11.1.13.4. SWOT Analysis
- 11.1.14 Avis Budget Group Inc
- 11.1.14.1. Company Overview
- 11.1.14.2. Products
- 11.1.14.3. Company Financials
- 11.1.14.4. SWOT Analysis
- 11.1.15 Grab Holdings Inc
- 11.1.15.1. Company Overview
- 11.1.15.2. Products
- 11.1.15.3. Company Financials
- 11.1.15.4. SWOT Analysis
- 11.1.1 BlaBlaCar
- 11.2. Market Entropy
- 11.2.1 Company's Key Areas Served
- 11.2.2 Recent Developments
- 11.3. Company Market Share Analysis 2025
- 11.3.1 Top 5 Companies Market Share Analysis
- 11.3.2 Top 3 Companies Market Share Analysis
- 11.4. List of Potential Customers
- 12. Research Methodology
List of Figures
- Figure 1: Global Shared Mobility Market Revenue Breakdown (Million, %) by Region 2025 & 2033
- Figure 2: North America Shared Mobility Market Revenue (Million), by Type 2025 & 2033
- Figure 3: North America Shared Mobility Market Revenue Share (%), by Type 2025 & 2033
- Figure 4: North America Shared Mobility Market Revenue (Million), by Vehicle Type 2025 & 2033
- Figure 5: North America Shared Mobility Market Revenue Share (%), by Vehicle Type 2025 & 2033
- Figure 6: North America Shared Mobility Market Revenue (Million), by Business Model 2025 & 2033
- Figure 7: North America Shared Mobility Market Revenue Share (%), by Business Model 2025 & 2033
- Figure 8: North America Shared Mobility Market Revenue (Million), by Propulsion Type 2025 & 2033
- Figure 9: North America Shared Mobility Market Revenue Share (%), by Propulsion Type 2025 & 2033
- Figure 10: North America Shared Mobility Market Revenue (Million), by Country 2025 & 2033
- Figure 11: North America Shared Mobility Market Revenue Share (%), by Country 2025 & 2033
- Figure 12: Europe Shared Mobility Market Revenue (Million), by Type 2025 & 2033
- Figure 13: Europe Shared Mobility Market Revenue Share (%), by Type 2025 & 2033
- Figure 14: Europe Shared Mobility Market Revenue (Million), by Vehicle Type 2025 & 2033
- Figure 15: Europe Shared Mobility Market Revenue Share (%), by Vehicle Type 2025 & 2033
- Figure 16: Europe Shared Mobility Market Revenue (Million), by Business Model 2025 & 2033
- Figure 17: Europe Shared Mobility Market Revenue Share (%), by Business Model 2025 & 2033
- Figure 18: Europe Shared Mobility Market Revenue (Million), by Propulsion Type 2025 & 2033
- Figure 19: Europe Shared Mobility Market Revenue Share (%), by Propulsion Type 2025 & 2033
- Figure 20: Europe Shared Mobility Market Revenue (Million), by Country 2025 & 2033
- Figure 21: Europe Shared Mobility Market Revenue Share (%), by Country 2025 & 2033
- Figure 22: Asia Pacific Shared Mobility Market Revenue (Million), by Type 2025 & 2033
- Figure 23: Asia Pacific Shared Mobility Market Revenue Share (%), by Type 2025 & 2033
- Figure 24: Asia Pacific Shared Mobility Market Revenue (Million), by Vehicle Type 2025 & 2033
- Figure 25: Asia Pacific Shared Mobility Market Revenue Share (%), by Vehicle Type 2025 & 2033
- Figure 26: Asia Pacific Shared Mobility Market Revenue (Million), by Business Model 2025 & 2033
- Figure 27: Asia Pacific Shared Mobility Market Revenue Share (%), by Business Model 2025 & 2033
- Figure 28: Asia Pacific Shared Mobility Market Revenue (Million), by Propulsion Type 2025 & 2033
- Figure 29: Asia Pacific Shared Mobility Market Revenue Share (%), by Propulsion Type 2025 & 2033
- Figure 30: Asia Pacific Shared Mobility Market Revenue (Million), by Country 2025 & 2033
- Figure 31: Asia Pacific Shared Mobility Market Revenue Share (%), by Country 2025 & 2033
- Figure 32: Rest of the World Shared Mobility Market Revenue (Million), by Type 2025 & 2033
- Figure 33: Rest of the World Shared Mobility Market Revenue Share (%), by Type 2025 & 2033
- Figure 34: Rest of the World Shared Mobility Market Revenue (Million), by Vehicle Type 2025 & 2033
- Figure 35: Rest of the World Shared Mobility Market Revenue Share (%), by Vehicle Type 2025 & 2033
- Figure 36: Rest of the World Shared Mobility Market Revenue (Million), by Business Model 2025 & 2033
- Figure 37: Rest of the World Shared Mobility Market Revenue Share (%), by Business Model 2025 & 2033
- Figure 38: Rest of the World Shared Mobility Market Revenue (Million), by Propulsion Type 2025 & 2033
- Figure 39: Rest of the World Shared Mobility Market Revenue Share (%), by Propulsion Type 2025 & 2033
- Figure 40: Rest of the World Shared Mobility Market Revenue (Million), by Country 2025 & 2033
- Figure 41: Rest of the World Shared Mobility Market Revenue Share (%), by Country 2025 & 2033
List of Tables
- Table 1: Global Shared Mobility Market Revenue Million Forecast, by Type 2020 & 2033
- Table 2: Global Shared Mobility Market Revenue Million Forecast, by Vehicle Type 2020 & 2033
- Table 3: Global Shared Mobility Market Revenue Million Forecast, by Business Model 2020 & 2033
- Table 4: Global Shared Mobility Market Revenue Million Forecast, by Propulsion Type 2020 & 2033
- Table 5: Global Shared Mobility Market Revenue Million Forecast, by Region 2020 & 2033
- Table 6: Global Shared Mobility Market Revenue Million Forecast, by Type 2020 & 2033
- Table 7: Global Shared Mobility Market Revenue Million Forecast, by Vehicle Type 2020 & 2033
- Table 8: Global Shared Mobility Market Revenue Million Forecast, by Business Model 2020 & 2033
- Table 9: Global Shared Mobility Market Revenue Million Forecast, by Propulsion Type 2020 & 2033
- Table 10: Global Shared Mobility Market Revenue Million Forecast, by Country 2020 & 2033
- Table 11: United States Shared Mobility Market Revenue (Million) Forecast, by Application 2020 & 2033
- Table 12: Canada Shared Mobility Market Revenue (Million) Forecast, by Application 2020 & 2033
- Table 13: Rest of North America Shared Mobility Market Revenue (Million) Forecast, by Application 2020 & 2033
- Table 14: Global Shared Mobility Market Revenue Million Forecast, by Type 2020 & 2033
- Table 15: Global Shared Mobility Market Revenue Million Forecast, by Vehicle Type 2020 & 2033
- Table 16: Global Shared Mobility Market Revenue Million Forecast, by Business Model 2020 & 2033
- Table 17: Global Shared Mobility Market Revenue Million Forecast, by Propulsion Type 2020 & 2033
- Table 18: Global Shared Mobility Market Revenue Million Forecast, by Country 2020 & 2033
- Table 19: Germany Shared Mobility Market Revenue (Million) Forecast, by Application 2020 & 2033
- Table 20: United Kingdom Shared Mobility Market Revenue (Million) Forecast, by Application 2020 & 2033
- Table 21: France Shared Mobility Market Revenue (Million) Forecast, by Application 2020 & 2033
- Table 22: Italy Shared Mobility Market Revenue (Million) Forecast, by Application 2020 & 2033
- Table 23: Rest of Europe Shared Mobility Market Revenue (Million) Forecast, by Application 2020 & 2033
- Table 24: Global Shared Mobility Market Revenue Million Forecast, by Type 2020 & 2033
- Table 25: Global Shared Mobility Market Revenue Million Forecast, by Vehicle Type 2020 & 2033
- Table 26: Global Shared Mobility Market Revenue Million Forecast, by Business Model 2020 & 2033
- Table 27: Global Shared Mobility Market Revenue Million Forecast, by Propulsion Type 2020 & 2033
- Table 28: Global Shared Mobility Market Revenue Million Forecast, by Country 2020 & 2033
- Table 29: China Shared Mobility Market Revenue (Million) Forecast, by Application 2020 & 2033
- Table 30: India Shared Mobility Market Revenue (Million) Forecast, by Application 2020 & 2033
- Table 31: Japan Shared Mobility Market Revenue (Million) Forecast, by Application 2020 & 2033
- Table 32: South Korea Shared Mobility Market Revenue (Million) Forecast, by Application 2020 & 2033
- Table 33: Rest of Asia Pacific Shared Mobility Market Revenue (Million) Forecast, by Application 2020 & 2033
- Table 34: Global Shared Mobility Market Revenue Million Forecast, by Type 2020 & 2033
- Table 35: Global Shared Mobility Market Revenue Million Forecast, by Vehicle Type 2020 & 2033
- Table 36: Global Shared Mobility Market Revenue Million Forecast, by Business Model 2020 & 2033
- Table 37: Global Shared Mobility Market Revenue Million Forecast, by Propulsion Type 2020 & 2033
- Table 38: Global Shared Mobility Market Revenue Million Forecast, by Country 2020 & 2033
- Table 39: South America Shared Mobility Market Revenue (Million) Forecast, by Application 2020 & 2033
- Table 40: Middle East and Africa Shared Mobility Market Revenue (Million) Forecast, by Application 2020 & 2033
Frequently Asked Questions
1. What is the projected Compound Annual Growth Rate (CAGR) of the Shared Mobility Market?
The projected CAGR is approximately 17.62%.
2. Which companies are prominent players in the Shared Mobility Market?
Key companies in the market include BlaBlaCar, ANI Technologies Pvt Ltd (Ola Cabs), Uber Technologies Inc, Curb Mobility LLC, Lyft Inc, Beijing Didi Chuxing Technology Co Ltd, Cabify, Zoomcar Holdings, Revv, Drive Now (BMW AG), Wingz Inc, Europcar Mobility Group, Hertz Global Holdings, Avis Budget Group Inc, Grab Holdings Inc.
3. What are the main segments of the Shared Mobility Market?
The market segments include Type, Vehicle Type, Business Model, Propulsion Type.
4. Can you provide details about the market size?
The market size is estimated to be USD 294.69 Million as of 2022.
5. What are some drivers contributing to market growth?
Increasing Preference of Consumers toward Ride-Hailing Services is Expected to Foster the Growth of the Market.
6. What are the notable trends driving market growth?
The Passengers Cars Segment is Expected to Gain Traction Between 2024 and 2029.
7. Are there any restraints impacting market growth?
Strict Government Regulations to Govern the Shared Mobility Industry Hampers the Growth of the Market.
8. Can you provide examples of recent developments in the market?
December 2023: CarDekho announced its merger with Revv, an Indian-based mobility service provider, to venture into India's shared car rental services business by combining the expertise of Car Dekho in technological integration and market understanding of Revv. These two companies aim to disrupt the car rental space in India by facilitating a tech-enabled mobility solution to enhance customers' convenience.
9. What pricing options are available for accessing the report?
Pricing options include single-user, multi-user, and enterprise licenses priced at USD 4750, USD 5250, and USD 8750 respectively.
10. Is the market size provided in terms of value or volume?
The market size is provided in terms of value, measured in Million.
11. Are there any specific market keywords associated with the report?
Yes, the market keyword associated with the report is "Shared Mobility Market," which aids in identifying and referencing the specific market segment covered.
12. How do I determine which pricing option suits my needs best?
The pricing options vary based on user requirements and access needs. Individual users may opt for single-user licenses, while businesses requiring broader access may choose multi-user or enterprise licenses for cost-effective access to the report.
13. Are there any additional resources or data provided in the Shared Mobility Market report?
While the report offers comprehensive insights, it's advisable to review the specific contents or supplementary materials provided to ascertain if additional resources or data are available.
14. How can I stay updated on further developments or reports in the Shared Mobility Market?
To stay informed about further developments, trends, and reports in the Shared Mobility Market, consider subscribing to industry newsletters, following relevant companies and organizations, or regularly checking reputable industry news sources and publications.
Methodology
Step 1 - Identification of Relevant Samples Size from Population Database


Step 2 - Approaches for Defining Global Market Size (Value, Volume* & Price*)

Note*: In applicable scenarios
Step 3 - Data Sources
Primary Research
- Web Analytics
- Survey Reports
- Research Institute
- Latest Research Reports
- Opinion Leaders
Secondary Research
- Annual Reports
- White Paper
- Latest Press Release
- Industry Association
- Paid Database
- Investor Presentations

Step 4 - Data Triangulation
Involves using different sources of information in order to increase the validity of a study
These sources are likely to be stakeholders in a program - participants, other researchers, program staff, other community members, and so on.
Then we put all data in single framework & apply various statistical tools to find out the dynamic on the market.
During the analysis stage, feedback from the stakeholder groups would be compared to determine areas of agreement as well as areas of divergence

