

Key Insights
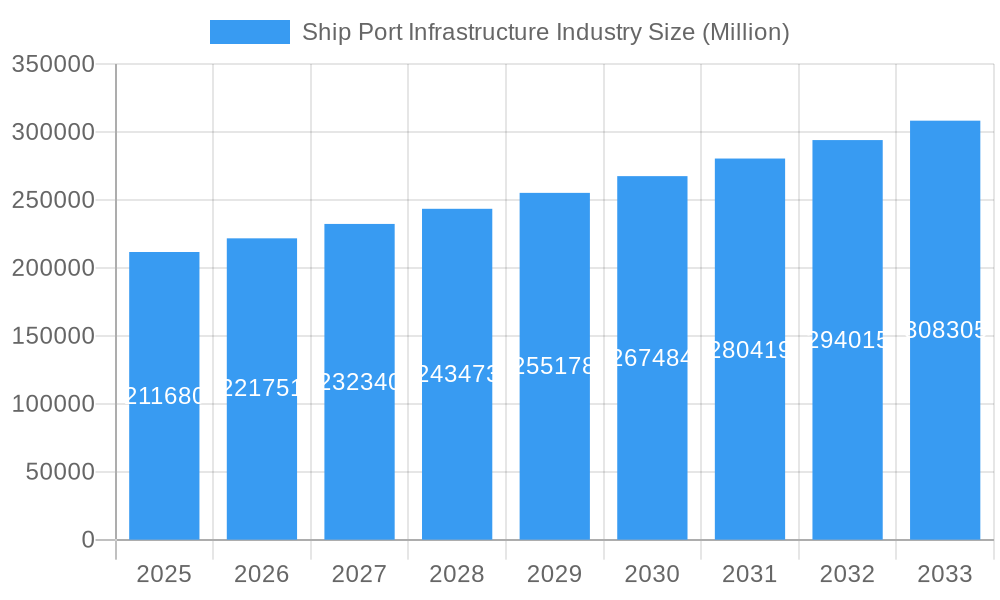
The global Ship Port Infrastructure market is poised for significant expansion, projected to reach $211.68 billion by 2025, with a robust compound annual growth rate (CAGR) of 4.75% during the forecast period of 2025-2033. This substantial market value underscores the critical role of ports in facilitating international trade and economic activity. The primary drivers fueling this growth include the escalating volume of global seaborne trade, necessitated by increasing consumer demand and international commerce, alongside ongoing government initiatives focused on port modernization and expansion. Investments in advanced technologies such as automation, smart port solutions, and digitalization are also pivotal in enhancing operational efficiency and capacity, thereby stimulating market growth. Furthermore, the development of new trade routes and the expansion of existing ones, coupled with the construction of larger and more specialized vessels, necessitate upgraded and expanded port facilities to accommodate these evolving logistical needs.
Ship Port Infrastructure Industry Market Size (In Billion)
The market is segmented into Sea Ports and Inland Ports, with Sea Ports constituting the larger share due to their direct involvement in international shipping. Applications span both Passenger and Cargo operations, with Cargo handling being the dominant segment given the immense volume of goods transported globally. Key trends shaping the industry include a growing emphasis on sustainable port development, incorporating eco-friendly practices and renewable energy sources to minimize environmental impact. The development of multimodal logistics hubs, integrating sea, rail, and road transport, is also a significant trend aimed at optimizing supply chains and reducing transit times. However, the market faces certain restraints, including high capital investment requirements for infrastructure development and upgrades, stringent environmental regulations that can lead to project delays and increased costs, and geopolitical uncertainties that can disrupt trade flows. Despite these challenges, the market's inherent growth trajectory, driven by the indispensable nature of port infrastructure for global commerce, remains strong.
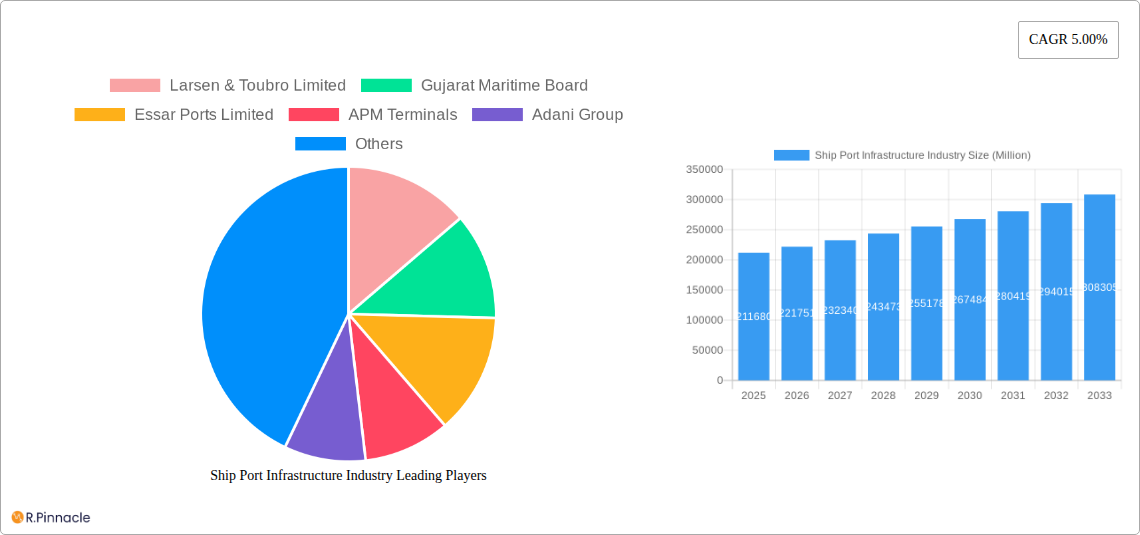
Ship Port Infrastructure Industry Company Market Share
Ship Port Infrastructure Industry Market Analysis: Investment Trends, Growth Drivers, and Regional Dominance (2019-2033)
This comprehensive report provides an in-depth analysis of the global Ship Port Infrastructure industry, offering strategic insights and actionable intelligence for stakeholders. Spanning the historical period of 2019–2024, with a base year of 2025 and a forecast period extending to 2033, this report delves into market structure, dynamics, dominant regions, product innovations, key growth drivers, emerging opportunities, and leading players. Leveraging high-ranking keywords such as "port development," "maritime infrastructure," "logistics solutions," and "sea port expansion," this report is meticulously crafted to boost search visibility and engage industry professionals seeking to understand the billion-dollar Ship Port Infrastructure market.
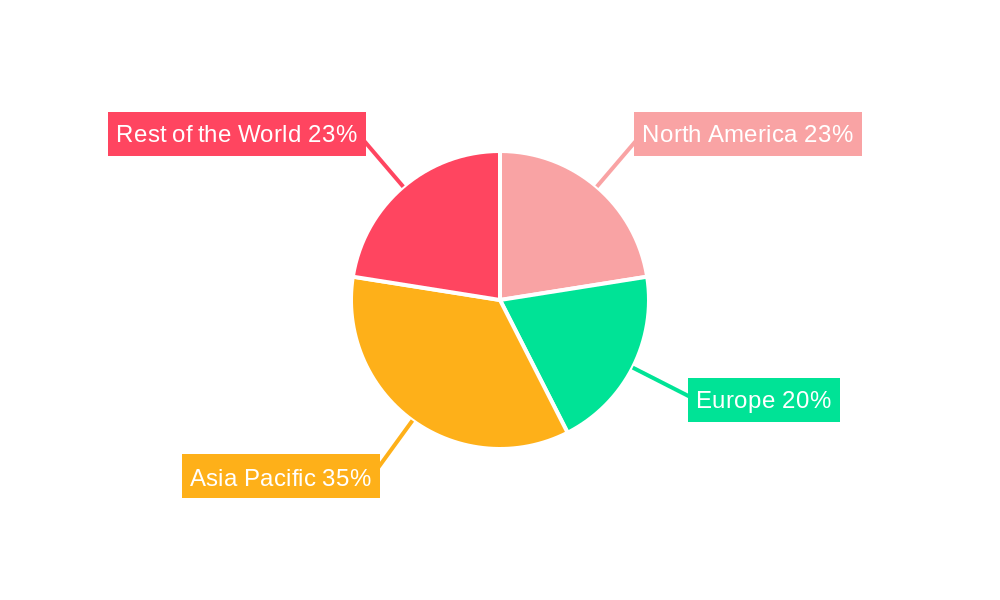
Ship Port Infrastructure Industry Regional Market Share
Ship Port Infrastructure Industry Market Structure & Innovation Trends
The Ship Port Infrastructure industry exhibits a moderate to high level of market concentration, with key players like Adani Group, DP World, and APM Terminals dominating global operations and investments. Innovation within the sector is primarily driven by the increasing demand for enhanced efficiency, sustainability, and digitization in port operations. Advanced technologies such as AI-powered terminal management, autonomous vessel navigation, and smart logistics platforms are rapidly being adopted. Regulatory frameworks, while evolving to support modernization and environmental compliance, can also present complexities for new entrants. Product substitutes are limited, given the specialized nature of port infrastructure, but efficiency gains in hinterland connectivity and intermodal transport can indirectly impact demand. End-user demographics span global trade entities, shipping lines, logistics providers, and governments, all seeking robust and cost-effective port services. Mergers and acquisitions (M&A) are a significant aspect of market consolidation, with substantial deal values often exceeding several billion dollars. For instance, Essar Group's USD 2.4 billion deal highlights the significant capital flow within this sector. Understanding these structural elements is crucial for strategic planning and investment in the growing port infrastructure landscape.
Ship Port Infrastructure Industry Market Dynamics & Trends
The global Ship Port Infrastructure industry is experiencing robust growth, driven by the resurgence of international trade, expanding global supply chains, and the increasing need for efficient cargo handling and logistics solutions. The market is projected to witness a significant Compound Annual Growth Rate (CAGR) over the forecast period. Key growth drivers include the burgeoning e-commerce sector, which necessitates faster and more reliable port operations, and the ongoing globalization of economies, leading to increased maritime traffic. Technological disruptions are at the forefront of market dynamics. The integration of automation, artificial intelligence (AI), and the Internet of Things (IoT) is revolutionizing port management, optimizing container throughput, reducing turnaround times, and enhancing safety. Smart port initiatives are gaining momentum, focusing on digital platforms for real-time tracking, predictive maintenance, and streamlined customs processes. Consumer preferences are increasingly shifting towards ports that offer integrated logistics solutions, providing end-to-end services from vessel arrival to final delivery. This demand for comprehensive services is pushing port operators to expand their offerings beyond traditional cargo handling to include warehousing, distribution, and value-added services. Competitive dynamics are characterized by intense competition among established global players and emerging regional operators, vying for market share through strategic investments, capacity expansions, and technological advancements. Port privatization and public-private partnerships (PPPs) are also playing a crucial role in shaping the competitive landscape, attracting private capital and expertise to develop and upgrade port facilities. Market penetration is steadily increasing across developing economies as they invest heavily in modernizing their maritime infrastructure to support economic growth and facilitate international trade. The ongoing digital transformation and the push for greener port operations are also significant trends influencing investment decisions and operational strategies within the Ship Port Infrastructure industry.
Dominant Regions & Segments in Ship Port Infrastructure Industry
The Ship Port Infrastructure industry's dominance is clearly observed in regions with significant trade volumes and strategic geographical locations. Asia-Pacific, particularly China, India, and Southeast Asian nations, stands out as the leading region. This dominance is fueled by robust economic growth, extensive manufacturing bases, and substantial investments in port development and expansion projects, often running into billions of dollars.
- Economic Policies and Infrastructure Investment: Governments in these regions have implemented favorable economic policies and launched ambitious infrastructure development plans. These include the creation of special economic zones (SEZs), tax incentives, and substantial capital allocation for building new ports and upgrading existing ones. For instance, India's Sagarmala program aims to enhance port-led development, significantly boosting the sector.
- Trade Volume and Connectivity: The sheer volume of international trade flowing through Asia-Pacific ports, driven by global manufacturing and consumer demand, necessitates advanced and efficient port infrastructure. These ports serve as critical hubs for global supply chains, connecting producers to consumers worldwide.
- Technological Adoption: Leading Asian ports are at the forefront of adopting advanced technologies, including automation, AI, and digital platforms, to improve efficiency, reduce costs, and enhance competitiveness.
Within the segmentation, Sea Ports are the most dominant segment.
- Global Trade Facilitation: Sea ports are the primary gateways for international trade, handling the vast majority of global cargo. Their strategic importance in connecting continents and facilitating the movement of raw materials and finished goods makes them indispensable to the global economy.
- Capacity and Scale: The scale of operations in sea ports, involving massive container ships and vast cargo volumes, requires extensive and sophisticated infrastructure, including deep-water berths, advanced cargo handling equipment, and extensive storage facilities.
- Investment Magnet: The economic impact and trade facilitation offered by sea ports attract significant global investment, both from private enterprises and public entities, often in multi-billion dollar projects.
The Cargo application segment also holds significant dominance.
- Economic Engine: The movement of cargo forms the backbone of global commerce. Efficient cargo handling is directly linked to economic productivity and growth, driving demand for specialized port infrastructure designed for diverse cargo types, from containers to bulk commodities.
- Logistics Integration: The increasing complexity of supply chains necessitates integrated logistics solutions, with cargo ports serving as crucial nodes. Investments are focused on optimizing cargo flow, reducing transit times, and offering value-added services within the port environment.
- Technological Advancement in Handling: Innovations in automated container terminals, specialized equipment for bulk and liquid cargo, and advanced warehousing solutions are continuously enhancing the efficiency and capacity of cargo handling at ports.
Ship Port Infrastructure Industry Product Innovations
Product innovations in the Ship Port Infrastructure industry are largely focused on enhancing efficiency, sustainability, and digitalization. Automated guided vehicles (AGVs) and robotic cranes are revolutionizing container handling, significantly reducing labor costs and improving throughput. Digital platforms and AI-driven analytics are enabling predictive maintenance, optimized terminal operations, and real-time cargo tracking. Furthermore, there is a growing emphasis on eco-friendly solutions, including shoreside power supply for vessels and advanced waste management systems, aligning with global sustainability goals. These innovations offer competitive advantages by reducing operational costs, improving turnaround times, and enhancing overall port performance, making them attractive to global shipping and logistics companies.
Report Scope & Segmentation Analysis
This report provides a granular analysis of the Ship Port Infrastructure industry, covering a wide range of segments critical for understanding market dynamics and investment opportunities.
The Sea Port segment, projected to hold the largest market share, is characterized by extensive infrastructure for handling international maritime trade. Growth in this segment is driven by increasing global trade volumes and strategic expansions by major port operators.
The Inland Port segment, while smaller, is crucial for facilitating intermodal connectivity and last-mile delivery. Its growth is linked to the development of inland waterways and efficient integration with broader logistics networks.
Other Types of ports, including specialized ports like oil terminals or ferry terminals, represent niche but vital segments of the market. Their growth is influenced by specific industry demands and regional economic activities.
In terms of application, the Passenger segment, encompassing ferry terminals and cruise ship ports, is driven by tourism and regional transportation needs. Growth here is closely tied to the travel industry's recovery and expansion.
The Cargo segment, the largest by volume and value, is the primary focus of infrastructure development, driven by global trade, e-commerce, and industrial output. Its growth is propelled by investments in container handling, bulk cargo, and specialized logistics solutions.
Key Drivers of Ship Port Infrastructure Industry Growth
The Ship Port Infrastructure industry is propelled by several potent drivers. Economically, the sustained growth of global trade and the increasing reliance on international supply chains are paramount. Governments worldwide are recognizing the strategic importance of efficient maritime gateways, leading to increased public and private investment in port modernization and expansion. Technological advancements, such as automation, AI-driven logistics, and smart port technologies, are critical for enhancing operational efficiency, reducing costs, and improving turnaround times, making ports more competitive. Regulatory support, including streamlined customs procedures and favorable investment policies, also plays a significant role in facilitating growth. The burgeoning e-commerce sector further fuels demand for faster and more reliable cargo handling, indirectly driving the need for advanced port infrastructure.
Challenges in the Ship Port Infrastructure Industry Sector
Despite its growth trajectory, the Ship Port Infrastructure industry faces several significant challenges. High capital expenditure requirements for developing and upgrading port facilities can be a substantial barrier to entry and expansion, often requiring billions of dollars in investment. Navigating complex and often evolving regulatory frameworks across different jurisdictions can lead to delays and increased compliance costs. Environmental concerns and the need for sustainable port operations necessitate significant investments in green technologies and practices, adding to operational expenses. Supply chain disruptions, as witnessed in recent years, can impact cargo volumes and port efficiency. Furthermore, geopolitical instability and trade disputes can create uncertainty and affect global shipping routes, thereby influencing port traffic and investment decisions. Competition from other modes of transport and the need for continuous technological adaptation to remain competitive also present ongoing challenges.
Emerging Opportunities in Ship Port Infrastructure Industry
The Ship Port Infrastructure industry is ripe with emerging opportunities. The increasing focus on decarbonization and sustainability presents significant opportunities for developing and implementing green port technologies, such as renewable energy integration, electric port equipment, and advanced waste management systems. The growth of offshore wind energy farms is creating demand for specialized port facilities to support their construction, operation, and maintenance. Digital transformation and the implementation of smart port solutions offer avenues for optimizing operations, enhancing security, and providing value-added digital services to stakeholders, creating new revenue streams. Furthermore, the expansion of emerging economies and their integration into global trade networks represent substantial untapped markets for port development and modernization. The rise of specialized cargo, such as electric vehicle batteries and pharmaceuticals, also demands tailored infrastructure solutions, opening up niche opportunities.
Leading Players in the Ship Port Infrastructure Industry Market
- Larsen & Toubro Limited
- Gujarat Maritime Board
- Essar Ports Limited
- APM Terminals
- Adani Group
- Starlog Enterprise
- Man Infraconstruction Limited
- DP World
Key Developments in Ship Port Infrastructure Industry Industry
- August 2022: Adani Ports Group signed a memorandum of understanding (MoU) with Adani Ports and special economic zone (SEZ) Ltd for strategic joint investments in end-to-end logistics infrastructure and solutions, which include rail, maritime services, port operations, digital services, an industrial zone, and the establishment of maritime academies in Tanzania.
- August 2022: APM Terminals, a subsidiary of Maersk, emerged as the successful bidder in the judicial auction for the acquisition of the isolated Estaleiro Atlantico Sul production unit located in the Port of Suape, Pernambuco, Brazil. The court in Ipojuca, Pernambuco, has officially confirmed APM Terminals as the winner, according to the terminal operator's announcement. This acquisition signifies APM Terminals' strategic expansion in the region and underscores its commitment to further developing its operations in the Port of Suape.
- August 2022: Essar group signed a USD 2.4 billion deal to sell certain ports and power infrastructure to ArcelorMittal Nippon Steel in one of the largest post-pandemic merger and acquisition deals in India.
Future Outlook for Ship Port Infrastructure Industry Market
The future outlook for the Ship Port Infrastructure market is exceptionally promising, poised for continued expansion driven by robust global trade and increasing investments in logistics. The ongoing digital transformation, with the widespread adoption of AI, IoT, and automation, will significantly enhance operational efficiencies and create new service offerings. A strong emphasis on sustainability will drive the development of green ports, aligning with global environmental mandates and attracting environmentally conscious stakeholders. Emerging economies are expected to play an increasingly vital role, investing heavily in upgrading their maritime infrastructure to facilitate trade and economic growth. Strategic collaborations, mergers, and acquisitions will continue to shape the market landscape, leading to consolidation and enhanced capabilities among leading players. The industry is well-positioned to capitalize on evolving trade patterns and technological advancements, ensuring its critical role in the global economy for years to come.
Ship Port Infrastructure Industry Segmentation
-
1. Type
- 1.1. Sea Port
- 1.2. Inland Port
- 1.3. Other Types
-
2. Application
- 2.1. Passenger
- 2.2. Cargo
Ship Port Infrastructure Industry Segmentation By Geography
-
1. North America
- 1.1. United States
- 1.2. Canada
- 1.3. Rest of North America
-
2. Europe
- 2.1. Germany
- 2.2. United Kingdom
- 2.3. France
- 2.4. Rest of Europe
-
3. Asia Pacific
- 3.1. India
- 3.2. China
- 3.3. Japan
- 3.4. South Korea
- 3.5. Rest of Asia Pacific
-
4. Rest of the World
- 4.1. Brazil
- 4.2. Mexico
- 4.3. United Arab Emirates
- 4.4. Other Countries
Ship Port Infrastructure Industry Regional Market Share
Geographic Coverage of Ship Port Infrastructure Industry
Ship Port Infrastructure Industry REPORT HIGHLIGHTS
| Aspects | Details |
|---|---|
| Study Period | 2020-2034 |
| Base Year | 2025 |
| Estimated Year | 2026 |
| Forecast Period | 2026-2034 |
| Historical Period | 2020-2025 |
| Growth Rate | CAGR of 6.1% from 2020-2034 |
| Segmentation |
|
Table of Contents
- 1. Introduction
- 1.1. Research Scope
- 1.2. Market Segmentation
- 1.3. Research Objective
- 1.4. Definitions and Assumptions
- 2. Executive Summary
- 2.1. Market Snapshot
- 3. Market Dynamics
- 3.1. Market Drivers
- 3.2. Market Restrains
- 3.3. Market Trends
- 3.4. Market Opportunities
- 4. Market Factor Analysis
- 4.1. Porters Five Forces
- 4.1.1. Bargaining Power of Suppliers
- 4.1.2. Bargaining Power of Buyers
- 4.1.3. Threat of New Entrants
- 4.1.4. Threat of Substitutes
- 4.1.5. Competitive Rivalry
- 4.2. PESTEL analysis
- 4.3. BCG Analysis
- 4.3.1. Stars (High Growth, High Market Share)
- 4.3.2. Cash Cows (Low Growth, High Market Share)
- 4.3.3. Question Mark (High Growth, Low Market Share)
- 4.3.4. Dogs (Low Growth, Low Market Share)
- 4.4. Ansoff Matrix Analysis
- 4.5. Supply Chain Analysis
- 4.6. Regulatory Landscape
- 4.7. Current Market Potential and Opportunity Assessment (TAM–SAM–SOM Framework)
- 4.8. PRI Analyst Note
- 4.1. Porters Five Forces
- 5. Market Analysis, Insights and Forecast 2021-2033
- 5.1. Market Analysis, Insights and Forecast - by Type
- 5.1.1. Sea Port
- 5.1.2. Inland Port
- 5.1.3. Other Types
- 5.2. Market Analysis, Insights and Forecast - by Application
- 5.2.1. Passenger
- 5.2.2. Cargo
- 5.3. Market Analysis, Insights and Forecast - by Region
- 5.3.1. North America
- 5.3.2. Europe
- 5.3.3. Asia Pacific
- 5.3.4. Rest of the World
- 5.1. Market Analysis, Insights and Forecast - by Type
- 6. Global Ship Port Infrastructure Industry Analysis, Insights and Forecast, 2021-2033
- 6.1. Market Analysis, Insights and Forecast - by Type
- 6.1.1. Sea Port
- 6.1.2. Inland Port
- 6.1.3. Other Types
- 6.2. Market Analysis, Insights and Forecast - by Application
- 6.2.1. Passenger
- 6.2.2. Cargo
- 6.1. Market Analysis, Insights and Forecast - by Type
- 7. North America Ship Port Infrastructure Industry Analysis, Insights and Forecast, 2020-2032
- 7.1. Market Analysis, Insights and Forecast - by Type
- 7.1.1. Sea Port
- 7.1.2. Inland Port
- 7.1.3. Other Types
- 7.2. Market Analysis, Insights and Forecast - by Application
- 7.2.1. Passenger
- 7.2.2. Cargo
- 7.1. Market Analysis, Insights and Forecast - by Type
- 8. Europe Ship Port Infrastructure Industry Analysis, Insights and Forecast, 2020-2032
- 8.1. Market Analysis, Insights and Forecast - by Type
- 8.1.1. Sea Port
- 8.1.2. Inland Port
- 8.1.3. Other Types
- 8.2. Market Analysis, Insights and Forecast - by Application
- 8.2.1. Passenger
- 8.2.2. Cargo
- 8.1. Market Analysis, Insights and Forecast - by Type
- 9. Asia Pacific Ship Port Infrastructure Industry Analysis, Insights and Forecast, 2020-2032
- 9.1. Market Analysis, Insights and Forecast - by Type
- 9.1.1. Sea Port
- 9.1.2. Inland Port
- 9.1.3. Other Types
- 9.2. Market Analysis, Insights and Forecast - by Application
- 9.2.1. Passenger
- 9.2.2. Cargo
- 9.1. Market Analysis, Insights and Forecast - by Type
- 10. Rest of the World Ship Port Infrastructure Industry Analysis, Insights and Forecast, 2020-2032
- 10.1. Market Analysis, Insights and Forecast - by Type
- 10.1.1. Sea Port
- 10.1.2. Inland Port
- 10.1.3. Other Types
- 10.2. Market Analysis, Insights and Forecast - by Application
- 10.2.1. Passenger
- 10.2.2. Cargo
- 10.1. Market Analysis, Insights and Forecast - by Type
- 11. Competitive Analysis
- 11.1. Company Profiles
- 11.1.1 Larsen & Toubro Limited
- 11.1.1.1. Company Overview
- 11.1.1.2. Products
- 11.1.1.3. Company Financials
- 11.1.1.4. SWOT Analysis
- 11.1.2 Gujarat Maritime Board
- 11.1.2.1. Company Overview
- 11.1.2.2. Products
- 11.1.2.3. Company Financials
- 11.1.2.4. SWOT Analysis
- 11.1.3 Essar Ports Limited
- 11.1.3.1. Company Overview
- 11.1.3.2. Products
- 11.1.3.3. Company Financials
- 11.1.3.4. SWOT Analysis
- 11.1.4 APM Terminals
- 11.1.4.1. Company Overview
- 11.1.4.2. Products
- 11.1.4.3. Company Financials
- 11.1.4.4. SWOT Analysis
- 11.1.5 Adani Group
- 11.1.5.1. Company Overview
- 11.1.5.2. Products
- 11.1.5.3. Company Financials
- 11.1.5.4. SWOT Analysis
- 11.1.6 Starlog Entrprise
- 11.1.6.1. Company Overview
- 11.1.6.2. Products
- 11.1.6.3. Company Financials
- 11.1.6.4. SWOT Analysis
- 11.1.7 Man Infraconstruction Limited
- 11.1.7.1. Company Overview
- 11.1.7.2. Products
- 11.1.7.3. Company Financials
- 11.1.7.4. SWOT Analysis
- 11.1.8 DP World
- 11.1.8.1. Company Overview
- 11.1.8.2. Products
- 11.1.8.3. Company Financials
- 11.1.8.4. SWOT Analysis
- 11.1.1 Larsen & Toubro Limited
- 11.2. Market Entropy
- 11.2.1 Company's Key Areas Served
- 11.2.2 Recent Developments
- 11.3. Company Market Share Analysis 2025
- 11.3.1 Top 5 Companies Market Share Analysis
- 11.3.2 Top 3 Companies Market Share Analysis
- 11.4. List of Potential Customers
- 12. Research Methodology
List of Figures
- Figure 1: Global Ship Port Infrastructure Industry Revenue Breakdown (billion, %) by Region 2025 & 2033
- Figure 2: North America Ship Port Infrastructure Industry Revenue (billion), by Type 2025 & 2033
- Figure 3: North America Ship Port Infrastructure Industry Revenue Share (%), by Type 2025 & 2033
- Figure 4: North America Ship Port Infrastructure Industry Revenue (billion), by Application 2025 & 2033
- Figure 5: North America Ship Port Infrastructure Industry Revenue Share (%), by Application 2025 & 2033
- Figure 6: North America Ship Port Infrastructure Industry Revenue (billion), by Country 2025 & 2033
- Figure 7: North America Ship Port Infrastructure Industry Revenue Share (%), by Country 2025 & 2033
- Figure 8: Europe Ship Port Infrastructure Industry Revenue (billion), by Type 2025 & 2033
- Figure 9: Europe Ship Port Infrastructure Industry Revenue Share (%), by Type 2025 & 2033
- Figure 10: Europe Ship Port Infrastructure Industry Revenue (billion), by Application 2025 & 2033
- Figure 11: Europe Ship Port Infrastructure Industry Revenue Share (%), by Application 2025 & 2033
- Figure 12: Europe Ship Port Infrastructure Industry Revenue (billion), by Country 2025 & 2033
- Figure 13: Europe Ship Port Infrastructure Industry Revenue Share (%), by Country 2025 & 2033
- Figure 14: Asia Pacific Ship Port Infrastructure Industry Revenue (billion), by Type 2025 & 2033
- Figure 15: Asia Pacific Ship Port Infrastructure Industry Revenue Share (%), by Type 2025 & 2033
- Figure 16: Asia Pacific Ship Port Infrastructure Industry Revenue (billion), by Application 2025 & 2033
- Figure 17: Asia Pacific Ship Port Infrastructure Industry Revenue Share (%), by Application 2025 & 2033
- Figure 18: Asia Pacific Ship Port Infrastructure Industry Revenue (billion), by Country 2025 & 2033
- Figure 19: Asia Pacific Ship Port Infrastructure Industry Revenue Share (%), by Country 2025 & 2033
- Figure 20: Rest of the World Ship Port Infrastructure Industry Revenue (billion), by Type 2025 & 2033
- Figure 21: Rest of the World Ship Port Infrastructure Industry Revenue Share (%), by Type 2025 & 2033
- Figure 22: Rest of the World Ship Port Infrastructure Industry Revenue (billion), by Application 2025 & 2033
- Figure 23: Rest of the World Ship Port Infrastructure Industry Revenue Share (%), by Application 2025 & 2033
- Figure 24: Rest of the World Ship Port Infrastructure Industry Revenue (billion), by Country 2025 & 2033
- Figure 25: Rest of the World Ship Port Infrastructure Industry Revenue Share (%), by Country 2025 & 2033
List of Tables
- Table 1: Global Ship Port Infrastructure Industry Revenue billion Forecast, by Type 2020 & 2033
- Table 2: Global Ship Port Infrastructure Industry Revenue billion Forecast, by Application 2020 & 2033
- Table 3: Global Ship Port Infrastructure Industry Revenue billion Forecast, by Region 2020 & 2033
- Table 4: Global Ship Port Infrastructure Industry Revenue billion Forecast, by Type 2020 & 2033
- Table 5: Global Ship Port Infrastructure Industry Revenue billion Forecast, by Application 2020 & 2033
- Table 6: Global Ship Port Infrastructure Industry Revenue billion Forecast, by Country 2020 & 2033
- Table 7: United States Ship Port Infrastructure Industry Revenue (billion) Forecast, by Application 2020 & 2033
- Table 8: Canada Ship Port Infrastructure Industry Revenue (billion) Forecast, by Application 2020 & 2033
- Table 9: Rest of North America Ship Port Infrastructure Industry Revenue (billion) Forecast, by Application 2020 & 2033
- Table 10: Global Ship Port Infrastructure Industry Revenue billion Forecast, by Type 2020 & 2033
- Table 11: Global Ship Port Infrastructure Industry Revenue billion Forecast, by Application 2020 & 2033
- Table 12: Global Ship Port Infrastructure Industry Revenue billion Forecast, by Country 2020 & 2033
- Table 13: Germany Ship Port Infrastructure Industry Revenue (billion) Forecast, by Application 2020 & 2033
- Table 14: United Kingdom Ship Port Infrastructure Industry Revenue (billion) Forecast, by Application 2020 & 2033
- Table 15: France Ship Port Infrastructure Industry Revenue (billion) Forecast, by Application 2020 & 2033
- Table 16: Rest of Europe Ship Port Infrastructure Industry Revenue (billion) Forecast, by Application 2020 & 2033
- Table 17: Global Ship Port Infrastructure Industry Revenue billion Forecast, by Type 2020 & 2033
- Table 18: Global Ship Port Infrastructure Industry Revenue billion Forecast, by Application 2020 & 2033
- Table 19: Global Ship Port Infrastructure Industry Revenue billion Forecast, by Country 2020 & 2033
- Table 20: India Ship Port Infrastructure Industry Revenue (billion) Forecast, by Application 2020 & 2033
- Table 21: China Ship Port Infrastructure Industry Revenue (billion) Forecast, by Application 2020 & 2033
- Table 22: Japan Ship Port Infrastructure Industry Revenue (billion) Forecast, by Application 2020 & 2033
- Table 23: South Korea Ship Port Infrastructure Industry Revenue (billion) Forecast, by Application 2020 & 2033
- Table 24: Rest of Asia Pacific Ship Port Infrastructure Industry Revenue (billion) Forecast, by Application 2020 & 2033
- Table 25: Global Ship Port Infrastructure Industry Revenue billion Forecast, by Type 2020 & 2033
- Table 26: Global Ship Port Infrastructure Industry Revenue billion Forecast, by Application 2020 & 2033
- Table 27: Global Ship Port Infrastructure Industry Revenue billion Forecast, by Country 2020 & 2033
- Table 28: Brazil Ship Port Infrastructure Industry Revenue (billion) Forecast, by Application 2020 & 2033
- Table 29: Mexico Ship Port Infrastructure Industry Revenue (billion) Forecast, by Application 2020 & 2033
- Table 30: United Arab Emirates Ship Port Infrastructure Industry Revenue (billion) Forecast, by Application 2020 & 2033
- Table 31: Other Countries Ship Port Infrastructure Industry Revenue (billion) Forecast, by Application 2020 & 2033
Frequently Asked Questions
1. What is the projected Compound Annual Growth Rate (CAGR) of the Ship Port Infrastructure Industry?
The projected CAGR is approximately 6.1%.
2. Which companies are prominent players in the Ship Port Infrastructure Industry?
Key companies in the market include Larsen & Toubro Limited, Gujarat Maritime Board, Essar Ports Limited, APM Terminals, Adani Group, Starlog Entrprise, Man Infraconstruction Limited, DP World.
3. What are the main segments of the Ship Port Infrastructure Industry?
The market segments include Type, Application.
4. Can you provide details about the market size?
The market size is estimated to be USD 187.4 billion as of 2022.
5. What are some drivers contributing to market growth?
Government Initiatives for Development of Ports are Driving Growth.
6. What are the notable trends driving market growth?
Government Initiatives for Development of Ports are Driving Growth.
7. Are there any restraints impacting market growth?
High Capital Investment may hamper the target market growth.
8. Can you provide examples of recent developments in the market?
August 2022: Adani Ports Group signed a memorandum of understanding (MoU) with Adani Ports and special economic zone (SEZ) Ltd for strategic joint investments in end-to-end logistics infrastructure and solutions, which include rail, maritime services, port operations, digital services, an industrial zone, and the establishment of maritime academies in Tanzania.
9. What pricing options are available for accessing the report?
Pricing options include single-user, multi-user, and enterprise licenses priced at USD 4750, USD 5250, and USD 8750 respectively.
10. Is the market size provided in terms of value or volume?
The market size is provided in terms of value, measured in billion.
11. Are there any specific market keywords associated with the report?
Yes, the market keyword associated with the report is "Ship Port Infrastructure Industry," which aids in identifying and referencing the specific market segment covered.
12. How do I determine which pricing option suits my needs best?
The pricing options vary based on user requirements and access needs. Individual users may opt for single-user licenses, while businesses requiring broader access may choose multi-user or enterprise licenses for cost-effective access to the report.
13. Are there any additional resources or data provided in the Ship Port Infrastructure Industry report?
While the report offers comprehensive insights, it's advisable to review the specific contents or supplementary materials provided to ascertain if additional resources or data are available.
14. How can I stay updated on further developments or reports in the Ship Port Infrastructure Industry?
To stay informed about further developments, trends, and reports in the Ship Port Infrastructure Industry, consider subscribing to industry newsletters, following relevant companies and organizations, or regularly checking reputable industry news sources and publications.
Methodology
Step 1 - Identification of Relevant Samples Size from Population Database


Step 2 - Approaches for Defining Global Market Size (Value, Volume* & Price*)

Note*: In applicable scenarios
Step 3 - Data Sources
Primary Research
- Web Analytics
- Survey Reports
- Research Institute
- Latest Research Reports
- Opinion Leaders
Secondary Research
- Annual Reports
- White Paper
- Latest Press Release
- Industry Association
- Paid Database
- Investor Presentations

Step 4 - Data Triangulation
Involves using different sources of information in order to increase the validity of a study
These sources are likely to be stakeholders in a program - participants, other researchers, program staff, other community members, and so on.
Then we put all data in single framework & apply various statistical tools to find out the dynamic on the market.
During the analysis stage, feedback from the stakeholder groups would be compared to determine areas of agreement as well as areas of divergence