

Key Insights
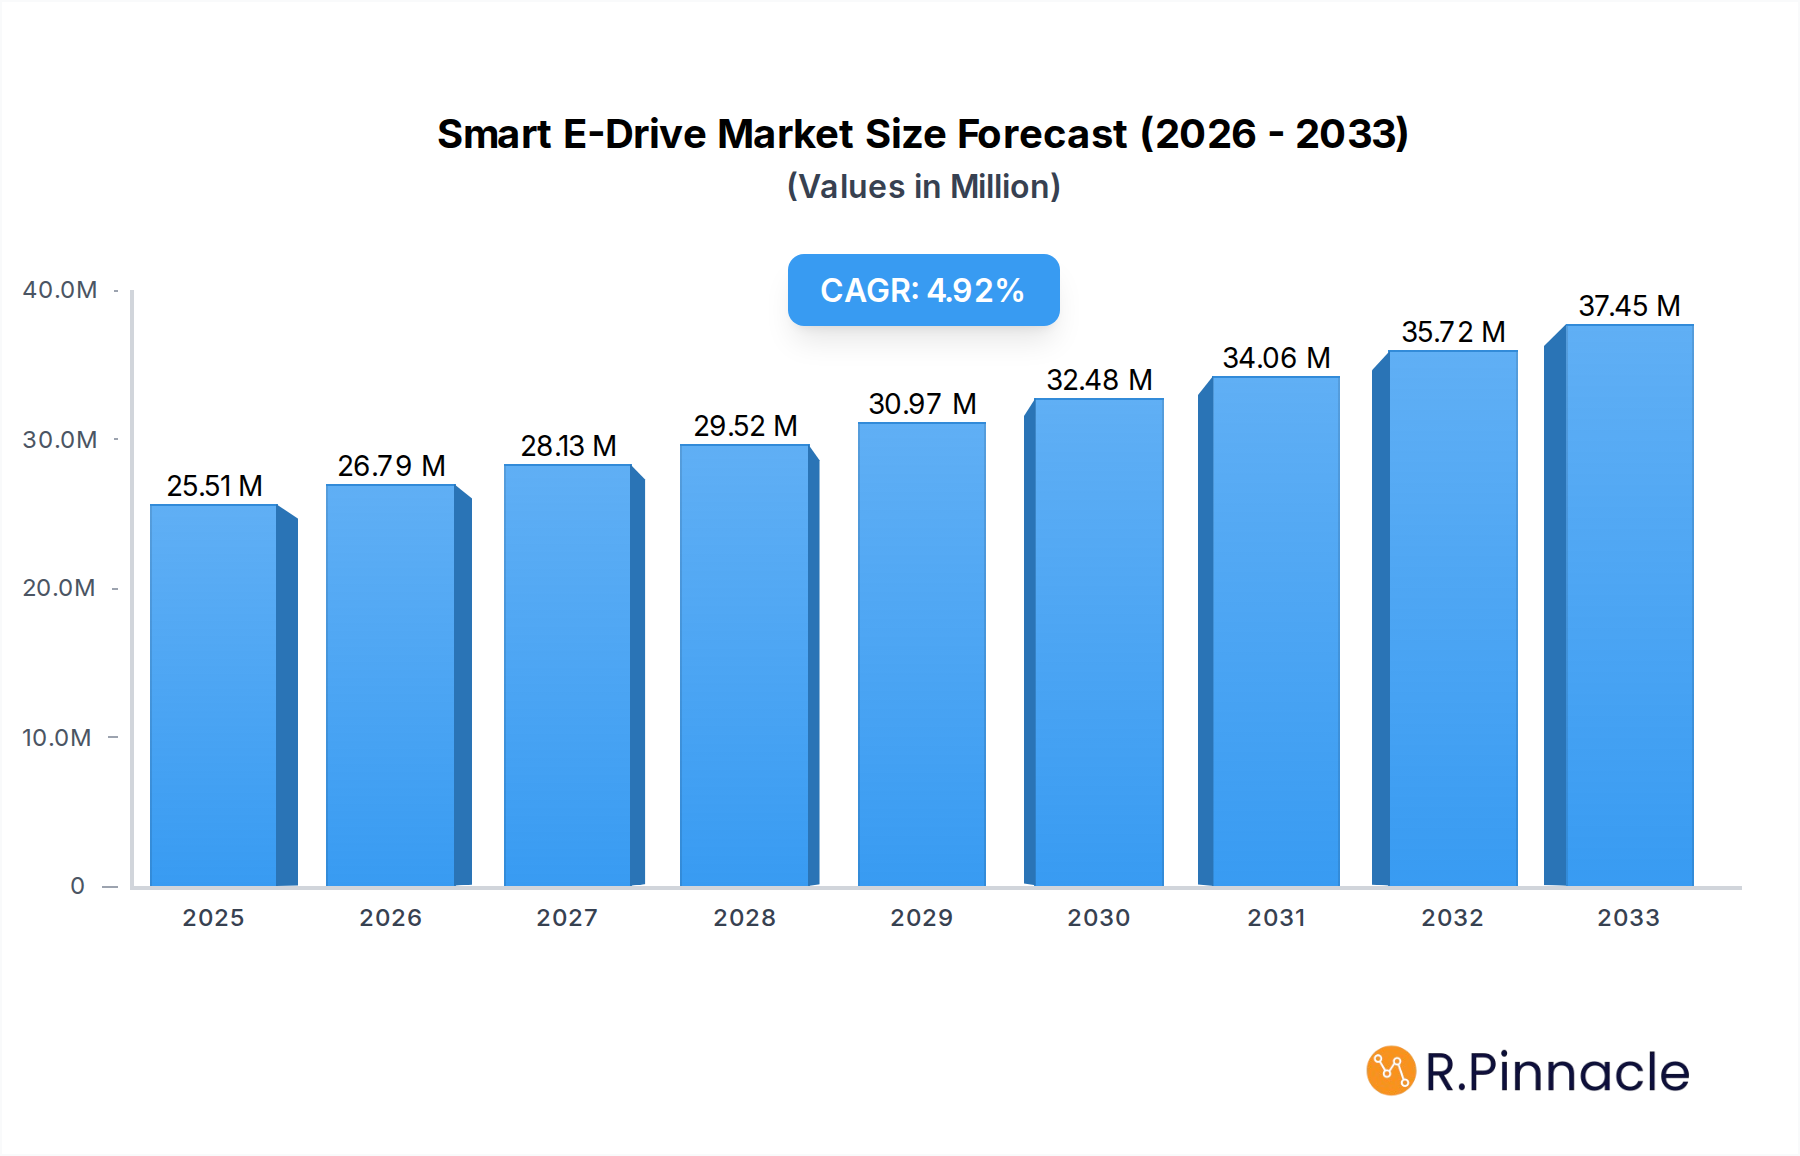
The global Smart E-Drive Market is poised for substantial growth, projected to reach a market size of USD 25.51 Billion by 2025, expanding at a Compound Annual Growth Rate (CAGR) of 5.10% through 2033. This robust expansion is fueled by an increasing demand for energy-efficient industrial automation solutions and the growing adoption of electric and hybrid powertrains across various sectors. Key drivers include stringent government regulations promoting energy conservation, advancements in motor control technology, and the need for precise motion control in manufacturing processes. The market is witnessing a significant surge in the adoption of AC drives, which dominate the product segment due to their versatility and efficiency in a wide range of applications.

Smart E-Drive Market Market Size (In Million)
The market's trajectory is further bolstered by the critical role smart e-drives play in optimizing operational efficiency and reducing energy consumption in energy-intensive industries such as Oil and Gas, Water and Wastewater, and Power Generation. Despite this positive outlook, certain restraints, such as the initial high cost of advanced e-drive systems and the need for specialized technical expertise for installation and maintenance, may temper rapid adoption in some segments. However, ongoing technological innovations in areas like predictive maintenance and enhanced connectivity are expected to mitigate these challenges, paving the way for broader market penetration. The Asia Pacific region, led by China and India, is anticipated to emerge as a dominant force due to rapid industrialization and increasing investments in smart manufacturing initiatives.
Smart E-Drive Market Company Market Share
Gain unparalleled insights into the global Smart E-Drive market with this in-depth report. Covering the period from 2019 to 2033, with a base year of 2025, this analysis provides a granular understanding of market dynamics, technological advancements, and strategic opportunities. Explore the competitive landscape, dominant regions, and critical growth drivers shaping the future of smart electric drives. This report is essential for industry professionals, investors, and strategists seeking to navigate and capitalize on the evolving smart e-drive ecosystem.
Smart E-Drive Market Market Structure & Innovation Trends
The Smart E-Drive market is characterized by a moderate to high level of concentration, with key players like Siemens AG, ABB Ltd, and Mitsubishi Electric Corporation holding significant market share. Innovation is primarily driven by the relentless pursuit of energy efficiency, enhanced control precision, and integration of IoT capabilities for predictive maintenance and remote monitoring. Regulatory frameworks, particularly those focused on energy conservation and emissions reduction, act as a strong catalyst for adoption. Product substitutes, such as traditional mechanical drives, are steadily being replaced by smart e-drives due to superior performance and operational benefits. End-user demographics are increasingly sophisticated, demanding tailored solutions for specific industrial applications. Mergers and acquisitions (M&A) activity, while moderate, indicates strategic consolidation and a focus on acquiring complementary technologies and market access. For instance, recent M&A deals have focused on integrating advanced software solutions and AI-driven control algorithms into existing e-drive platforms, with deal values often in the tens to hundreds of millions of dollars.
Smart E-Drive Market Market Dynamics & Trends
The global Smart E-Drive market is experiencing robust growth, propelled by an escalating demand for energy-efficient automation solutions across diverse industries. The compound annual growth rate (CAGR) is projected to be approximately 7.5% during the forecast period of 2025–2033. Technological disruptions are central to this expansion, with advancements in power electronics, motor control algorithms, and the integration of artificial intelligence (AI) and the Internet of Things (IoT) enabling smarter, more adaptable, and predictive drive systems. Consumer preferences are shifting towards solutions that offer not only improved performance and reliability but also reduced operational costs through energy savings and minimized downtime. The competitive dynamics are intensifying, with established players innovating rapidly and new entrants focusing on niche applications and disruptive technologies. Market penetration for smart e-drives is steadily increasing, driven by increasing industrial automation initiatives and a growing awareness of the economic and environmental benefits they offer. The widespread adoption of Industry 4.0 principles is a significant market penetration driver, encouraging the integration of smart e-drives into connected manufacturing environments. This trend is further amplified by the need for precise motion control in sectors like robotics and automated guided vehicles (AGVs), leading to a higher market penetration rate in these segments.
Dominant Regions & Segments in Smart E-Drive Market
Dominant Region: Asia-Pacific is emerging as the dominant region in the Smart E-Drive market, driven by rapid industrialization, significant investments in manufacturing infrastructure, and a strong push towards automation in countries like China, Japan, and South Korea. Favorable government policies promoting energy efficiency and advanced manufacturing further bolster this dominance.
Dominant Segment by Product: AC Drives currently hold the largest market share within the Smart E-Drive market. Their versatility, efficiency, and wide range of applications across various voltage and power ratings make them the go-to solution for most industrial automation needs. The demand for AC drives is fueled by their ability to precisely control motor speed and torque, leading to substantial energy savings in applications ranging from HVAC systems to industrial machinery.
Dominant Segment by Voltage: Low-Voltage Drives (=372.8KW or >= 1KW) represent the most significant segment in terms of volume and market value. This is attributed to their extensive use in a broad spectrum of industrial applications where precise speed and torque control are critical, and where higher voltage drives are not necessitated.
Dominant Segment by Power Rating: While a wide spectrum of power ratings exists, the 500 KW power rating segment is particularly crucial for heavy-duty industrial applications. This segment caters to critical infrastructure and large-scale manufacturing processes, where robust and reliable drive solutions are paramount.
Dominant Segment by End-user Industry: The Discrete Industries segment, encompassing sectors like automotive manufacturing, electronics assembly, and machinery production, exhibits the highest demand for smart e-drives. This is due to the inherent need for high precision, speed control, and automation in these production environments. Following closely are the Water and Wastewater and HVAC sectors, which are increasingly adopting smart e-drives for energy optimization and efficient system operation.
- Key Drivers for Discrete Industries: High automation requirements, precision motion control needs, and the imperative for increased production efficiency.
- Key Drivers for Water and Wastewater: Energy savings through variable speed control of pumps and fans, reduced operational costs, and compliance with environmental regulations.
- Key Drivers for HVAC: Energy efficiency mandates, demand for optimized building management systems, and enhanced comfort control.
Smart E-Drive Market Product Innovations
Product innovation in the Smart E-Drive market is intensely focused on enhancing energy efficiency, improving control accuracy, and enabling seamless integration into smart factory ecosystems. Key developments include the integration of advanced AI algorithms for predictive maintenance, enabling manufacturers to anticipate and address potential issues before they lead to costly downtime. Furthermore, the miniaturization of components and the development of drives with enhanced connectivity options for IoT platforms are crucial competitive advantages. These innovations are driven by the market's demand for highly reliable, energy-conscious, and data-driven automation solutions that can adapt to dynamic production environments.
Smart E-Drive Market Report & Segmentation Analysis
This report meticulously segments the Smart E-Drive market across several key dimensions.
- Product Segmentation: The market is analyzed based on AC Drives, DC Drives, and Servo Drives, with each segment offering distinct performance characteristics and application suitability. AC drives are prevalent in general industrial automation, DC drives cater to specific applications requiring robust torque, and servo drives offer high precision for dynamic motion control tasks.
- Voltage Segmentation: The analysis includes Low-Voltage Drives (=372.8KW or >= 1KW), which constitute the largest share due to their widespread applicability in diverse industrial settings.
- Power Rating Segmentation: While the report considers various power ratings, the 500 KW segment is highlighted for its significance in heavy-duty industrial applications.
- End-user Industry Segmentation: The report provides in-depth analysis for Oil and Gas, Water and Wastewater, Chemical and Petrochemical, Food and Beverage, Power Generation, HVAC, Pulp and Paper, Discrete Industries, and Other End-user Industries. Each sector presents unique growth trajectories and adoption patterns driven by specific operational demands and regulatory landscapes.
Key Drivers of Smart E-Drive Market Growth
The growth of the Smart E-Drive market is primarily propelled by several interconnected factors. The increasing global emphasis on energy efficiency and sustainability mandates the adoption of technologies that reduce energy consumption, with smart e-drives offering significant savings through precise motor control. The rapid advancements in automation and the widespread implementation of Industry 4.0 principles are creating a strong demand for intelligent and connected drive systems. Furthermore, government initiatives and incentives promoting industrial modernization and energy conservation directly fuel market expansion. Finally, the rising adoption of electric vehicles and the electrification of industrial machinery also contribute significantly to the overall market growth.
Challenges in the Smart E-Drive Market Sector
Despite its robust growth, the Smart E-Drive market faces several challenges. The initial capital investment for advanced smart e-drive systems can be a barrier for small and medium-sized enterprises (SMEs). The need for skilled labor to install, maintain, and operate these sophisticated systems presents a talent gap challenge. Moreover, the complexity of integration with existing legacy systems and the evolving cybersecurity threats in connected environments require careful consideration and robust solutions. Supply chain disruptions, as witnessed in recent years, can also impact the availability and cost of critical components, posing a restraint to market expansion.
Emerging Opportunities in Smart E-Drive Market
The Smart E-Drive market is ripe with emerging opportunities. The growing demand for smart grid technologies and renewable energy integration creates a substantial market for e-drives in power generation and transmission applications. The burgeoning electric mobility sector, including electric vehicles and autonomous transportation systems, presents a significant growth avenue. Furthermore, the increasing adoption of robotics and automation in emerging economies, coupled with the development of advanced AI-powered control systems for enhanced predictive maintenance and operational optimization, are key opportunities for market players.
Leading Players in the Smart E-Drive Market Market
- ABB Ltd
- SEW-EURODRIVE GmbH & Co KG
- Danfoss
- Nidec Corporation
- Mitsubishi Electric Corporation
- Siemens AG
- Schneider Electric SE
- TMEIC Corporation
- Rockwell Automation Inc
- Yaskawa Electric Corporation
Key Developments in Smart E-Drive Market Industry
- May 2023: Yaskawa Europe, the Japanese technology group Yaskawa Electric's European subsidiary, officially relocated to Hattersheim, near Frankfurt/Main. Yaskawa invested approximately EUR 23 million (USD 24.57 million) in the new building at its new Hattersheim industrial park location. The construction took about two years, as planned. This expansion signifies Yaskawa's commitment to its European market presence and its investment in state-of-the-art facilities to support product development and customer service.
- February 2023: Nidec-Shimpo Corporation expanded its current product lineup of drive modules for automated guided vehicles ("AGVs") and autonomous mobile robots ("AMRs") to include direct-current (DC) and 24 V modules. The newly introduced 24 V drive modules, which complement the existing DC 48 V product line, can be used with the same voltage (DC 24 V) as many peripheral devices. Compact and low-noise reducers, which are a Nidec-Shimpo specialty, are used in the drive sections of these new modules, with two allowable load capacities of 250kgf and 650kgf. This development highlights Nidec-Shimpo's focus on innovative solutions for the rapidly growing AGV and AMR market, enhancing their product portfolio with versatile voltage options.
Future Outlook for Smart E-Drive Market Market
The future outlook for the Smart E-Drive market is exceptionally promising, characterized by sustained high growth and significant innovation. The increasing integration of advanced digital technologies, including AI, machine learning, and the IoT, will lead to the development of even more intelligent and autonomous drive systems capable of self-optimization and predictive diagnostics. The growing global emphasis on decarbonization and the transition to a circular economy will further accelerate the adoption of energy-efficient smart e-drives across all industrial sectors. Strategic partnerships and collaborations are expected to intensify as companies seek to leverage each other's expertise in areas such as software development, data analytics, and specialized application knowledge, driving market expansion and fostering a more interconnected industrial landscape.
Smart E-Drive Market Segmentation
-
1. Product
- 1.1. AC Drives
- 1.2. DC Drives
- 1.3. Servo Drives
-
2. Voltage
-
2.1. Low-Voltage Drive (<372.8KW or <1KV)
- 2.1.1. Embedded
- 2.1.2. Standalone
- 2.2. Medium-Voltage Drive (>=372.8KW or >= 1KW)
-
2.1. Low-Voltage Drive (<372.8KW or <1KV)
-
3. Power Rating Statistics
- 3.1. <250 KW
- 3.2. 251 - 500 KW
- 3.3. >500 KW
-
4. End-user Industry
- 4.1. Oil and Gas
- 4.2. Water and Wastewater
- 4.3. Chemical and Petrochemical
- 4.4. Food and Beverage
- 4.5. Power Generation
- 4.6. HVAC
- 4.7. Pulp and Paper
- 4.8. Discrete Industries
- 4.9. Other End-user Industries
Smart E-Drive Market Segmentation By Geography
-
1. North America
- 1.1. United States
- 1.2. Canada
-
2. Europe
- 2.1. Germany
- 2.2. Italy
- 2.3. United Kingdom
- 2.4. France
- 2.5. Rest of Europe
-
3. Asia Pacific
- 3.1. China
- 3.2. Japan
- 3.3. India
- 3.4. South Korea
- 3.5. Rest of Asia Pacific
-
4. Latin America
- 4.1. Brazil
- 4.2. Mexico
- 4.3. Rest of Latin America
-
5. Middle East and Africa
- 5.1. United Arab Emirates
- 5.2. Saudi Arabia
- 5.3. Turkey
- 5.4. Rest of Middle East and Africa
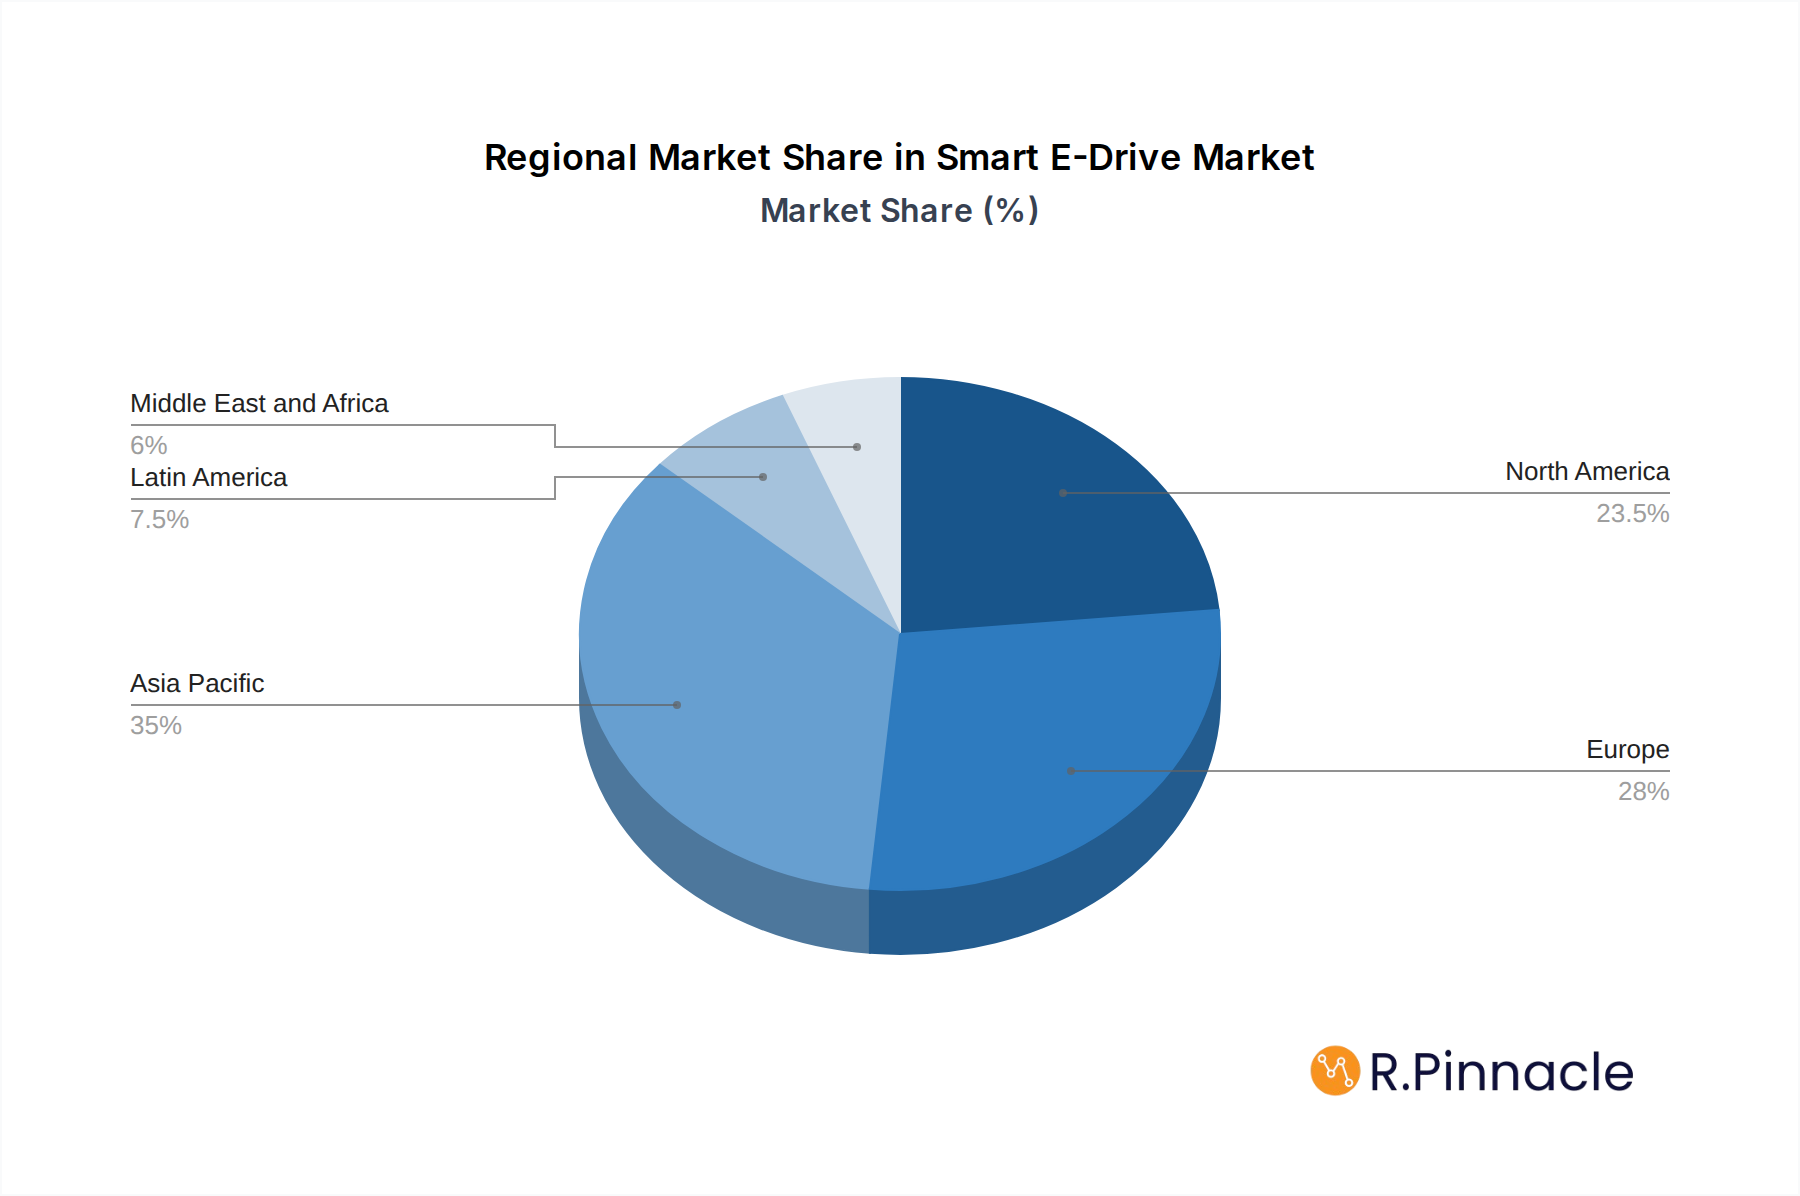
Smart E-Drive Market Regional Market Share
Geographic Coverage of Smart E-Drive Market
Smart E-Drive Market REPORT HIGHLIGHTS
| Aspects | Details |
|---|---|
| Study Period | 2020-2034 |
| Base Year | 2025 |
| Estimated Year | 2026 |
| Forecast Period | 2026-2034 |
| Historical Period | 2020-2025 |
| Growth Rate | CAGR of 32.8% from 2020-2034 |
| Segmentation |
|
Table of Contents
- 1. Introduction
- 1.1. Research Scope
- 1.2. Market Segmentation
- 1.3. Research Objective
- 1.4. Definitions and Assumptions
- 2. Executive Summary
- 2.1. Market Snapshot
- 3. Market Dynamics
- 3.1. Market Drivers
- 3.2. Market Restrains
- 3.3. Market Trends
- 3.4. Market Opportunities
- 4. Market Factor Analysis
- 4.1. Porters Five Forces
- 4.1.1. Bargaining Power of Suppliers
- 4.1.2. Bargaining Power of Buyers
- 4.1.3. Threat of New Entrants
- 4.1.4. Threat of Substitutes
- 4.1.5. Competitive Rivalry
- 4.2. PESTEL analysis
- 4.3. BCG Analysis
- 4.3.1. Stars (High Growth, High Market Share)
- 4.3.2. Cash Cows (Low Growth, High Market Share)
- 4.3.3. Question Mark (High Growth, Low Market Share)
- 4.3.4. Dogs (Low Growth, Low Market Share)
- 4.4. Ansoff Matrix Analysis
- 4.5. Supply Chain Analysis
- 4.6. Regulatory Landscape
- 4.7. Current Market Potential and Opportunity Assessment (TAM–SAM–SOM Framework)
- 4.8. PRI Analyst Note
- 4.1. Porters Five Forces
- 5. Market Analysis, Insights and Forecast 2021-2033
- 5.1. Market Analysis, Insights and Forecast - by Product
- 5.1.1. AC Drives
- 5.1.2. DC Drives
- 5.1.3. Servo Drives
- 5.2. Market Analysis, Insights and Forecast - by Voltage
- 5.2.1. Low-Voltage Drive (<372.8KW or <1KV)
- 5.2.1.1. Embedded
- 5.2.1.2. Standalone
- 5.2.2. Medium-Voltage Drive (>=372.8KW or >= 1KW)
- 5.2.1. Low-Voltage Drive (<372.8KW or <1KV)
- 5.3. Market Analysis, Insights and Forecast - by Power Rating Statistics
- 5.3.1. <250 KW
- 5.3.2. 251 - 500 KW
- 5.3.3. >500 KW
- 5.4. Market Analysis, Insights and Forecast - by End-user Industry
- 5.4.1. Oil and Gas
- 5.4.2. Water and Wastewater
- 5.4.3. Chemical and Petrochemical
- 5.4.4. Food and Beverage
- 5.4.5. Power Generation
- 5.4.6. HVAC
- 5.4.7. Pulp and Paper
- 5.4.8. Discrete Industries
- 5.4.9. Other End-user Industries
- 5.5. Market Analysis, Insights and Forecast - by Region
- 5.5.1. North America
- 5.5.2. Europe
- 5.5.3. Asia Pacific
- 5.5.4. Latin America
- 5.5.5. Middle East and Africa
- 5.1. Market Analysis, Insights and Forecast - by Product
- 6. Global Smart E-Drive Market Analysis, Insights and Forecast, 2021-2033
- 6.1. Market Analysis, Insights and Forecast - by Product
- 6.1.1. AC Drives
- 6.1.2. DC Drives
- 6.1.3. Servo Drives
- 6.2. Market Analysis, Insights and Forecast - by Voltage
- 6.2.1. Low-Voltage Drive (<372.8KW or <1KV)
- 6.2.1.1. Embedded
- 6.2.1.2. Standalone
- 6.2.2. Medium-Voltage Drive (>=372.8KW or >= 1KW)
- 6.2.1. Low-Voltage Drive (<372.8KW or <1KV)
- 6.3. Market Analysis, Insights and Forecast - by Power Rating Statistics
- 6.3.1. <250 KW
- 6.3.2. 251 - 500 KW
- 6.3.3. >500 KW
- 6.4. Market Analysis, Insights and Forecast - by End-user Industry
- 6.4.1. Oil and Gas
- 6.4.2. Water and Wastewater
- 6.4.3. Chemical and Petrochemical
- 6.4.4. Food and Beverage
- 6.4.5. Power Generation
- 6.4.6. HVAC
- 6.4.7. Pulp and Paper
- 6.4.8. Discrete Industries
- 6.4.9. Other End-user Industries
- 6.1. Market Analysis, Insights and Forecast - by Product
- 7. North America Smart E-Drive Market Analysis, Insights and Forecast, 2020-2032
- 7.1. Market Analysis, Insights and Forecast - by Product
- 7.1.1. AC Drives
- 7.1.2. DC Drives
- 7.1.3. Servo Drives
- 7.2. Market Analysis, Insights and Forecast - by Voltage
- 7.2.1. Low-Voltage Drive (<372.8KW or <1KV)
- 7.2.1.1. Embedded
- 7.2.1.2. Standalone
- 7.2.2. Medium-Voltage Drive (>=372.8KW or >= 1KW)
- 7.2.1. Low-Voltage Drive (<372.8KW or <1KV)
- 7.3. Market Analysis, Insights and Forecast - by Power Rating Statistics
- 7.3.1. <250 KW
- 7.3.2. 251 - 500 KW
- 7.3.3. >500 KW
- 7.4. Market Analysis, Insights and Forecast - by End-user Industry
- 7.4.1. Oil and Gas
- 7.4.2. Water and Wastewater
- 7.4.3. Chemical and Petrochemical
- 7.4.4. Food and Beverage
- 7.4.5. Power Generation
- 7.4.6. HVAC
- 7.4.7. Pulp and Paper
- 7.4.8. Discrete Industries
- 7.4.9. Other End-user Industries
- 7.1. Market Analysis, Insights and Forecast - by Product
- 8. Europe Smart E-Drive Market Analysis, Insights and Forecast, 2020-2032
- 8.1. Market Analysis, Insights and Forecast - by Product
- 8.1.1. AC Drives
- 8.1.2. DC Drives
- 8.1.3. Servo Drives
- 8.2. Market Analysis, Insights and Forecast - by Voltage
- 8.2.1. Low-Voltage Drive (<372.8KW or <1KV)
- 8.2.1.1. Embedded
- 8.2.1.2. Standalone
- 8.2.2. Medium-Voltage Drive (>=372.8KW or >= 1KW)
- 8.2.1. Low-Voltage Drive (<372.8KW or <1KV)
- 8.3. Market Analysis, Insights and Forecast - by Power Rating Statistics
- 8.3.1. <250 KW
- 8.3.2. 251 - 500 KW
- 8.3.3. >500 KW
- 8.4. Market Analysis, Insights and Forecast - by End-user Industry
- 8.4.1. Oil and Gas
- 8.4.2. Water and Wastewater
- 8.4.3. Chemical and Petrochemical
- 8.4.4. Food and Beverage
- 8.4.5. Power Generation
- 8.4.6. HVAC
- 8.4.7. Pulp and Paper
- 8.4.8. Discrete Industries
- 8.4.9. Other End-user Industries
- 8.1. Market Analysis, Insights and Forecast - by Product
- 9. Asia Pacific Smart E-Drive Market Analysis, Insights and Forecast, 2020-2032
- 9.1. Market Analysis, Insights and Forecast - by Product
- 9.1.1. AC Drives
- 9.1.2. DC Drives
- 9.1.3. Servo Drives
- 9.2. Market Analysis, Insights and Forecast - by Voltage
- 9.2.1. Low-Voltage Drive (<372.8KW or <1KV)
- 9.2.1.1. Embedded
- 9.2.1.2. Standalone
- 9.2.2. Medium-Voltage Drive (>=372.8KW or >= 1KW)
- 9.2.1. Low-Voltage Drive (<372.8KW or <1KV)
- 9.3. Market Analysis, Insights and Forecast - by Power Rating Statistics
- 9.3.1. <250 KW
- 9.3.2. 251 - 500 KW
- 9.3.3. >500 KW
- 9.4. Market Analysis, Insights and Forecast - by End-user Industry
- 9.4.1. Oil and Gas
- 9.4.2. Water and Wastewater
- 9.4.3. Chemical and Petrochemical
- 9.4.4. Food and Beverage
- 9.4.5. Power Generation
- 9.4.6. HVAC
- 9.4.7. Pulp and Paper
- 9.4.8. Discrete Industries
- 9.4.9. Other End-user Industries
- 9.1. Market Analysis, Insights and Forecast - by Product
- 10. Latin America Smart E-Drive Market Analysis, Insights and Forecast, 2020-2032
- 10.1. Market Analysis, Insights and Forecast - by Product
- 10.1.1. AC Drives
- 10.1.2. DC Drives
- 10.1.3. Servo Drives
- 10.2. Market Analysis, Insights and Forecast - by Voltage
- 10.2.1. Low-Voltage Drive (<372.8KW or <1KV)
- 10.2.1.1. Embedded
- 10.2.1.2. Standalone
- 10.2.2. Medium-Voltage Drive (>=372.8KW or >= 1KW)
- 10.2.1. Low-Voltage Drive (<372.8KW or <1KV)
- 10.3. Market Analysis, Insights and Forecast - by Power Rating Statistics
- 10.3.1. <250 KW
- 10.3.2. 251 - 500 KW
- 10.3.3. >500 KW
- 10.4. Market Analysis, Insights and Forecast - by End-user Industry
- 10.4.1. Oil and Gas
- 10.4.2. Water and Wastewater
- 10.4.3. Chemical and Petrochemical
- 10.4.4. Food and Beverage
- 10.4.5. Power Generation
- 10.4.6. HVAC
- 10.4.7. Pulp and Paper
- 10.4.8. Discrete Industries
- 10.4.9. Other End-user Industries
- 10.1. Market Analysis, Insights and Forecast - by Product
- 11. Middle East and Africa Smart E-Drive Market Analysis, Insights and Forecast, 2020-2032
- 11.1. Market Analysis, Insights and Forecast - by Product
- 11.1.1. AC Drives
- 11.1.2. DC Drives
- 11.1.3. Servo Drives
- 11.2. Market Analysis, Insights and Forecast - by Voltage
- 11.2.1. Low-Voltage Drive (<372.8KW or <1KV)
- 11.2.1.1. Embedded
- 11.2.1.2. Standalone
- 11.2.2. Medium-Voltage Drive (>=372.8KW or >= 1KW)
- 11.2.1. Low-Voltage Drive (<372.8KW or <1KV)
- 11.3. Market Analysis, Insights and Forecast - by Power Rating Statistics
- 11.3.1. <250 KW
- 11.3.2. 251 - 500 KW
- 11.3.3. >500 KW
- 11.4. Market Analysis, Insights and Forecast - by End-user Industry
- 11.4.1. Oil and Gas
- 11.4.2. Water and Wastewater
- 11.4.3. Chemical and Petrochemical
- 11.4.4. Food and Beverage
- 11.4.5. Power Generation
- 11.4.6. HVAC
- 11.4.7. Pulp and Paper
- 11.4.8. Discrete Industries
- 11.4.9. Other End-user Industries
- 11.1. Market Analysis, Insights and Forecast - by Product
- 12. Competitive Analysis
- 12.1. Company Profiles
- 12.1.1 ABB Ltd
- 12.1.1.1. Company Overview
- 12.1.1.2. Products
- 12.1.1.3. Company Financials
- 12.1.1.4. SWOT Analysis
- 12.1.2 SEW-EURODRIVE GmbH & Co KG
- 12.1.2.1. Company Overview
- 12.1.2.2. Products
- 12.1.2.3. Company Financials
- 12.1.2.4. SWOT Analysis
- 12.1.3 Danfoss
- 12.1.3.1. Company Overview
- 12.1.3.2. Products
- 12.1.3.3. Company Financials
- 12.1.3.4. SWOT Analysis
- 12.1.4 Nidec Corporation
- 12.1.4.1. Company Overview
- 12.1.4.2. Products
- 12.1.4.3. Company Financials
- 12.1.4.4. SWOT Analysis
- 12.1.5 Mitsubishi Electric Corporation
- 12.1.5.1. Company Overview
- 12.1.5.2. Products
- 12.1.5.3. Company Financials
- 12.1.5.4. SWOT Analysis
- 12.1.6 Siemens AG
- 12.1.6.1. Company Overview
- 12.1.6.2. Products
- 12.1.6.3. Company Financials
- 12.1.6.4. SWOT Analysis
- 12.1.7 Schneider Electric SE
- 12.1.7.1. Company Overview
- 12.1.7.2. Products
- 12.1.7.3. Company Financials
- 12.1.7.4. SWOT Analysis
- 12.1.8 TMEIC Corporation
- 12.1.8.1. Company Overview
- 12.1.8.2. Products
- 12.1.8.3. Company Financials
- 12.1.8.4. SWOT Analysis
- 12.1.9 Rockwell Automation Inc
- 12.1.9.1. Company Overview
- 12.1.9.2. Products
- 12.1.9.3. Company Financials
- 12.1.9.4. SWOT Analysis
- 12.1.10 Yaskawa Electric Corporation
- 12.1.10.1. Company Overview
- 12.1.10.2. Products
- 12.1.10.3. Company Financials
- 12.1.10.4. SWOT Analysis
- 12.1.1 ABB Ltd
- 12.2. Market Entropy
- 12.2.1 Company's Key Areas Served
- 12.2.2 Recent Developments
- 12.3. Company Market Share Analysis 2025
- 12.3.1 Top 5 Companies Market Share Analysis
- 12.3.2 Top 3 Companies Market Share Analysis
- 12.4. List of Potential Customers
- 13. Research Methodology
List of Figures
- Figure 1: Global Smart E-Drive Market Revenue Breakdown (billion, %) by Region 2025 & 2033
- Figure 2: Global Smart E-Drive Market Volume Breakdown (K Unit, %) by Region 2025 & 2033
- Figure 3: North America Smart E-Drive Market Revenue (billion), by Product 2025 & 2033
- Figure 4: North America Smart E-Drive Market Volume (K Unit), by Product 2025 & 2033
- Figure 5: North America Smart E-Drive Market Revenue Share (%), by Product 2025 & 2033
- Figure 6: North America Smart E-Drive Market Volume Share (%), by Product 2025 & 2033
- Figure 7: North America Smart E-Drive Market Revenue (billion), by Voltage 2025 & 2033
- Figure 8: North America Smart E-Drive Market Volume (K Unit), by Voltage 2025 & 2033
- Figure 9: North America Smart E-Drive Market Revenue Share (%), by Voltage 2025 & 2033
- Figure 10: North America Smart E-Drive Market Volume Share (%), by Voltage 2025 & 2033
- Figure 11: North America Smart E-Drive Market Revenue (billion), by Power Rating Statistics 2025 & 2033
- Figure 12: North America Smart E-Drive Market Volume (K Unit), by Power Rating Statistics 2025 & 2033
- Figure 13: North America Smart E-Drive Market Revenue Share (%), by Power Rating Statistics 2025 & 2033
- Figure 14: North America Smart E-Drive Market Volume Share (%), by Power Rating Statistics 2025 & 2033
- Figure 15: North America Smart E-Drive Market Revenue (billion), by End-user Industry 2025 & 2033
- Figure 16: North America Smart E-Drive Market Volume (K Unit), by End-user Industry 2025 & 2033
- Figure 17: North America Smart E-Drive Market Revenue Share (%), by End-user Industry 2025 & 2033
- Figure 18: North America Smart E-Drive Market Volume Share (%), by End-user Industry 2025 & 2033
- Figure 19: North America Smart E-Drive Market Revenue (billion), by Country 2025 & 2033
- Figure 20: North America Smart E-Drive Market Volume (K Unit), by Country 2025 & 2033
- Figure 21: North America Smart E-Drive Market Revenue Share (%), by Country 2025 & 2033
- Figure 22: North America Smart E-Drive Market Volume Share (%), by Country 2025 & 2033
- Figure 23: Europe Smart E-Drive Market Revenue (billion), by Product 2025 & 2033
- Figure 24: Europe Smart E-Drive Market Volume (K Unit), by Product 2025 & 2033
- Figure 25: Europe Smart E-Drive Market Revenue Share (%), by Product 2025 & 2033
- Figure 26: Europe Smart E-Drive Market Volume Share (%), by Product 2025 & 2033
- Figure 27: Europe Smart E-Drive Market Revenue (billion), by Voltage 2025 & 2033
- Figure 28: Europe Smart E-Drive Market Volume (K Unit), by Voltage 2025 & 2033
- Figure 29: Europe Smart E-Drive Market Revenue Share (%), by Voltage 2025 & 2033
- Figure 30: Europe Smart E-Drive Market Volume Share (%), by Voltage 2025 & 2033
- Figure 31: Europe Smart E-Drive Market Revenue (billion), by Power Rating Statistics 2025 & 2033
- Figure 32: Europe Smart E-Drive Market Volume (K Unit), by Power Rating Statistics 2025 & 2033
- Figure 33: Europe Smart E-Drive Market Revenue Share (%), by Power Rating Statistics 2025 & 2033
- Figure 34: Europe Smart E-Drive Market Volume Share (%), by Power Rating Statistics 2025 & 2033
- Figure 35: Europe Smart E-Drive Market Revenue (billion), by End-user Industry 2025 & 2033
- Figure 36: Europe Smart E-Drive Market Volume (K Unit), by End-user Industry 2025 & 2033
- Figure 37: Europe Smart E-Drive Market Revenue Share (%), by End-user Industry 2025 & 2033
- Figure 38: Europe Smart E-Drive Market Volume Share (%), by End-user Industry 2025 & 2033
- Figure 39: Europe Smart E-Drive Market Revenue (billion), by Country 2025 & 2033
- Figure 40: Europe Smart E-Drive Market Volume (K Unit), by Country 2025 & 2033
- Figure 41: Europe Smart E-Drive Market Revenue Share (%), by Country 2025 & 2033
- Figure 42: Europe Smart E-Drive Market Volume Share (%), by Country 2025 & 2033
- Figure 43: Asia Pacific Smart E-Drive Market Revenue (billion), by Product 2025 & 2033
- Figure 44: Asia Pacific Smart E-Drive Market Volume (K Unit), by Product 2025 & 2033
- Figure 45: Asia Pacific Smart E-Drive Market Revenue Share (%), by Product 2025 & 2033
- Figure 46: Asia Pacific Smart E-Drive Market Volume Share (%), by Product 2025 & 2033
- Figure 47: Asia Pacific Smart E-Drive Market Revenue (billion), by Voltage 2025 & 2033
- Figure 48: Asia Pacific Smart E-Drive Market Volume (K Unit), by Voltage 2025 & 2033
- Figure 49: Asia Pacific Smart E-Drive Market Revenue Share (%), by Voltage 2025 & 2033
- Figure 50: Asia Pacific Smart E-Drive Market Volume Share (%), by Voltage 2025 & 2033
- Figure 51: Asia Pacific Smart E-Drive Market Revenue (billion), by Power Rating Statistics 2025 & 2033
- Figure 52: Asia Pacific Smart E-Drive Market Volume (K Unit), by Power Rating Statistics 2025 & 2033
- Figure 53: Asia Pacific Smart E-Drive Market Revenue Share (%), by Power Rating Statistics 2025 & 2033
- Figure 54: Asia Pacific Smart E-Drive Market Volume Share (%), by Power Rating Statistics 2025 & 2033
- Figure 55: Asia Pacific Smart E-Drive Market Revenue (billion), by End-user Industry 2025 & 2033
- Figure 56: Asia Pacific Smart E-Drive Market Volume (K Unit), by End-user Industry 2025 & 2033
- Figure 57: Asia Pacific Smart E-Drive Market Revenue Share (%), by End-user Industry 2025 & 2033
- Figure 58: Asia Pacific Smart E-Drive Market Volume Share (%), by End-user Industry 2025 & 2033
- Figure 59: Asia Pacific Smart E-Drive Market Revenue (billion), by Country 2025 & 2033
- Figure 60: Asia Pacific Smart E-Drive Market Volume (K Unit), by Country 2025 & 2033
- Figure 61: Asia Pacific Smart E-Drive Market Revenue Share (%), by Country 2025 & 2033
- Figure 62: Asia Pacific Smart E-Drive Market Volume Share (%), by Country 2025 & 2033
- Figure 63: Latin America Smart E-Drive Market Revenue (billion), by Product 2025 & 2033
- Figure 64: Latin America Smart E-Drive Market Volume (K Unit), by Product 2025 & 2033
- Figure 65: Latin America Smart E-Drive Market Revenue Share (%), by Product 2025 & 2033
- Figure 66: Latin America Smart E-Drive Market Volume Share (%), by Product 2025 & 2033
- Figure 67: Latin America Smart E-Drive Market Revenue (billion), by Voltage 2025 & 2033
- Figure 68: Latin America Smart E-Drive Market Volume (K Unit), by Voltage 2025 & 2033
- Figure 69: Latin America Smart E-Drive Market Revenue Share (%), by Voltage 2025 & 2033
- Figure 70: Latin America Smart E-Drive Market Volume Share (%), by Voltage 2025 & 2033
- Figure 71: Latin America Smart E-Drive Market Revenue (billion), by Power Rating Statistics 2025 & 2033
- Figure 72: Latin America Smart E-Drive Market Volume (K Unit), by Power Rating Statistics 2025 & 2033
- Figure 73: Latin America Smart E-Drive Market Revenue Share (%), by Power Rating Statistics 2025 & 2033
- Figure 74: Latin America Smart E-Drive Market Volume Share (%), by Power Rating Statistics 2025 & 2033
- Figure 75: Latin America Smart E-Drive Market Revenue (billion), by End-user Industry 2025 & 2033
- Figure 76: Latin America Smart E-Drive Market Volume (K Unit), by End-user Industry 2025 & 2033
- Figure 77: Latin America Smart E-Drive Market Revenue Share (%), by End-user Industry 2025 & 2033
- Figure 78: Latin America Smart E-Drive Market Volume Share (%), by End-user Industry 2025 & 2033
- Figure 79: Latin America Smart E-Drive Market Revenue (billion), by Country 2025 & 2033
- Figure 80: Latin America Smart E-Drive Market Volume (K Unit), by Country 2025 & 2033
- Figure 81: Latin America Smart E-Drive Market Revenue Share (%), by Country 2025 & 2033
- Figure 82: Latin America Smart E-Drive Market Volume Share (%), by Country 2025 & 2033
- Figure 83: Middle East and Africa Smart E-Drive Market Revenue (billion), by Product 2025 & 2033
- Figure 84: Middle East and Africa Smart E-Drive Market Volume (K Unit), by Product 2025 & 2033
- Figure 85: Middle East and Africa Smart E-Drive Market Revenue Share (%), by Product 2025 & 2033
- Figure 86: Middle East and Africa Smart E-Drive Market Volume Share (%), by Product 2025 & 2033
- Figure 87: Middle East and Africa Smart E-Drive Market Revenue (billion), by Voltage 2025 & 2033
- Figure 88: Middle East and Africa Smart E-Drive Market Volume (K Unit), by Voltage 2025 & 2033
- Figure 89: Middle East and Africa Smart E-Drive Market Revenue Share (%), by Voltage 2025 & 2033
- Figure 90: Middle East and Africa Smart E-Drive Market Volume Share (%), by Voltage 2025 & 2033
- Figure 91: Middle East and Africa Smart E-Drive Market Revenue (billion), by Power Rating Statistics 2025 & 2033
- Figure 92: Middle East and Africa Smart E-Drive Market Volume (K Unit), by Power Rating Statistics 2025 & 2033
- Figure 93: Middle East and Africa Smart E-Drive Market Revenue Share (%), by Power Rating Statistics 2025 & 2033
- Figure 94: Middle East and Africa Smart E-Drive Market Volume Share (%), by Power Rating Statistics 2025 & 2033
- Figure 95: Middle East and Africa Smart E-Drive Market Revenue (billion), by End-user Industry 2025 & 2033
- Figure 96: Middle East and Africa Smart E-Drive Market Volume (K Unit), by End-user Industry 2025 & 2033
- Figure 97: Middle East and Africa Smart E-Drive Market Revenue Share (%), by End-user Industry 2025 & 2033
- Figure 98: Middle East and Africa Smart E-Drive Market Volume Share (%), by End-user Industry 2025 & 2033
- Figure 99: Middle East and Africa Smart E-Drive Market Revenue (billion), by Country 2025 & 2033
- Figure 100: Middle East and Africa Smart E-Drive Market Volume (K Unit), by Country 2025 & 2033
- Figure 101: Middle East and Africa Smart E-Drive Market Revenue Share (%), by Country 2025 & 2033
- Figure 102: Middle East and Africa Smart E-Drive Market Volume Share (%), by Country 2025 & 2033
List of Tables
- Table 1: Global Smart E-Drive Market Revenue billion Forecast, by Product 2020 & 2033
- Table 2: Global Smart E-Drive Market Volume K Unit Forecast, by Product 2020 & 2033
- Table 3: Global Smart E-Drive Market Revenue billion Forecast, by Voltage 2020 & 2033
- Table 4: Global Smart E-Drive Market Volume K Unit Forecast, by Voltage 2020 & 2033
- Table 5: Global Smart E-Drive Market Revenue billion Forecast, by Power Rating Statistics 2020 & 2033
- Table 6: Global Smart E-Drive Market Volume K Unit Forecast, by Power Rating Statistics 2020 & 2033
- Table 7: Global Smart E-Drive Market Revenue billion Forecast, by End-user Industry 2020 & 2033
- Table 8: Global Smart E-Drive Market Volume K Unit Forecast, by End-user Industry 2020 & 2033
- Table 9: Global Smart E-Drive Market Revenue billion Forecast, by Region 2020 & 2033
- Table 10: Global Smart E-Drive Market Volume K Unit Forecast, by Region 2020 & 2033
- Table 11: Global Smart E-Drive Market Revenue billion Forecast, by Product 2020 & 2033
- Table 12: Global Smart E-Drive Market Volume K Unit Forecast, by Product 2020 & 2033
- Table 13: Global Smart E-Drive Market Revenue billion Forecast, by Voltage 2020 & 2033
- Table 14: Global Smart E-Drive Market Volume K Unit Forecast, by Voltage 2020 & 2033
- Table 15: Global Smart E-Drive Market Revenue billion Forecast, by Power Rating Statistics 2020 & 2033
- Table 16: Global Smart E-Drive Market Volume K Unit Forecast, by Power Rating Statistics 2020 & 2033
- Table 17: Global Smart E-Drive Market Revenue billion Forecast, by End-user Industry 2020 & 2033
- Table 18: Global Smart E-Drive Market Volume K Unit Forecast, by End-user Industry 2020 & 2033
- Table 19: Global Smart E-Drive Market Revenue billion Forecast, by Country 2020 & 2033
- Table 20: Global Smart E-Drive Market Volume K Unit Forecast, by Country 2020 & 2033
- Table 21: United States Smart E-Drive Market Revenue (billion) Forecast, by Application 2020 & 2033
- Table 22: United States Smart E-Drive Market Volume (K Unit) Forecast, by Application 2020 & 2033
- Table 23: Canada Smart E-Drive Market Revenue (billion) Forecast, by Application 2020 & 2033
- Table 24: Canada Smart E-Drive Market Volume (K Unit) Forecast, by Application 2020 & 2033
- Table 25: Global Smart E-Drive Market Revenue billion Forecast, by Product 2020 & 2033
- Table 26: Global Smart E-Drive Market Volume K Unit Forecast, by Product 2020 & 2033
- Table 27: Global Smart E-Drive Market Revenue billion Forecast, by Voltage 2020 & 2033
- Table 28: Global Smart E-Drive Market Volume K Unit Forecast, by Voltage 2020 & 2033
- Table 29: Global Smart E-Drive Market Revenue billion Forecast, by Power Rating Statistics 2020 & 2033
- Table 30: Global Smart E-Drive Market Volume K Unit Forecast, by Power Rating Statistics 2020 & 2033
- Table 31: Global Smart E-Drive Market Revenue billion Forecast, by End-user Industry 2020 & 2033
- Table 32: Global Smart E-Drive Market Volume K Unit Forecast, by End-user Industry 2020 & 2033
- Table 33: Global Smart E-Drive Market Revenue billion Forecast, by Country 2020 & 2033
- Table 34: Global Smart E-Drive Market Volume K Unit Forecast, by Country 2020 & 2033
- Table 35: Germany Smart E-Drive Market Revenue (billion) Forecast, by Application 2020 & 2033
- Table 36: Germany Smart E-Drive Market Volume (K Unit) Forecast, by Application 2020 & 2033
- Table 37: Italy Smart E-Drive Market Revenue (billion) Forecast, by Application 2020 & 2033
- Table 38: Italy Smart E-Drive Market Volume (K Unit) Forecast, by Application 2020 & 2033
- Table 39: United Kingdom Smart E-Drive Market Revenue (billion) Forecast, by Application 2020 & 2033
- Table 40: United Kingdom Smart E-Drive Market Volume (K Unit) Forecast, by Application 2020 & 2033
- Table 41: France Smart E-Drive Market Revenue (billion) Forecast, by Application 2020 & 2033
- Table 42: France Smart E-Drive Market Volume (K Unit) Forecast, by Application 2020 & 2033
- Table 43: Rest of Europe Smart E-Drive Market Revenue (billion) Forecast, by Application 2020 & 2033
- Table 44: Rest of Europe Smart E-Drive Market Volume (K Unit) Forecast, by Application 2020 & 2033
- Table 45: Global Smart E-Drive Market Revenue billion Forecast, by Product 2020 & 2033
- Table 46: Global Smart E-Drive Market Volume K Unit Forecast, by Product 2020 & 2033
- Table 47: Global Smart E-Drive Market Revenue billion Forecast, by Voltage 2020 & 2033
- Table 48: Global Smart E-Drive Market Volume K Unit Forecast, by Voltage 2020 & 2033
- Table 49: Global Smart E-Drive Market Revenue billion Forecast, by Power Rating Statistics 2020 & 2033
- Table 50: Global Smart E-Drive Market Volume K Unit Forecast, by Power Rating Statistics 2020 & 2033
- Table 51: Global Smart E-Drive Market Revenue billion Forecast, by End-user Industry 2020 & 2033
- Table 52: Global Smart E-Drive Market Volume K Unit Forecast, by End-user Industry 2020 & 2033
- Table 53: Global Smart E-Drive Market Revenue billion Forecast, by Country 2020 & 2033
- Table 54: Global Smart E-Drive Market Volume K Unit Forecast, by Country 2020 & 2033
- Table 55: China Smart E-Drive Market Revenue (billion) Forecast, by Application 2020 & 2033
- Table 56: China Smart E-Drive Market Volume (K Unit) Forecast, by Application 2020 & 2033
- Table 57: Japan Smart E-Drive Market Revenue (billion) Forecast, by Application 2020 & 2033
- Table 58: Japan Smart E-Drive Market Volume (K Unit) Forecast, by Application 2020 & 2033
- Table 59: India Smart E-Drive Market Revenue (billion) Forecast, by Application 2020 & 2033
- Table 60: India Smart E-Drive Market Volume (K Unit) Forecast, by Application 2020 & 2033
- Table 61: South Korea Smart E-Drive Market Revenue (billion) Forecast, by Application 2020 & 2033
- Table 62: South Korea Smart E-Drive Market Volume (K Unit) Forecast, by Application 2020 & 2033
- Table 63: Rest of Asia Pacific Smart E-Drive Market Revenue (billion) Forecast, by Application 2020 & 2033
- Table 64: Rest of Asia Pacific Smart E-Drive Market Volume (K Unit) Forecast, by Application 2020 & 2033
- Table 65: Global Smart E-Drive Market Revenue billion Forecast, by Product 2020 & 2033
- Table 66: Global Smart E-Drive Market Volume K Unit Forecast, by Product 2020 & 2033
- Table 67: Global Smart E-Drive Market Revenue billion Forecast, by Voltage 2020 & 2033
- Table 68: Global Smart E-Drive Market Volume K Unit Forecast, by Voltage 2020 & 2033
- Table 69: Global Smart E-Drive Market Revenue billion Forecast, by Power Rating Statistics 2020 & 2033
- Table 70: Global Smart E-Drive Market Volume K Unit Forecast, by Power Rating Statistics 2020 & 2033
- Table 71: Global Smart E-Drive Market Revenue billion Forecast, by End-user Industry 2020 & 2033
- Table 72: Global Smart E-Drive Market Volume K Unit Forecast, by End-user Industry 2020 & 2033
- Table 73: Global Smart E-Drive Market Revenue billion Forecast, by Country 2020 & 2033
- Table 74: Global Smart E-Drive Market Volume K Unit Forecast, by Country 2020 & 2033
- Table 75: Brazil Smart E-Drive Market Revenue (billion) Forecast, by Application 2020 & 2033
- Table 76: Brazil Smart E-Drive Market Volume (K Unit) Forecast, by Application 2020 & 2033
- Table 77: Mexico Smart E-Drive Market Revenue (billion) Forecast, by Application 2020 & 2033
- Table 78: Mexico Smart E-Drive Market Volume (K Unit) Forecast, by Application 2020 & 2033
- Table 79: Rest of Latin America Smart E-Drive Market Revenue (billion) Forecast, by Application 2020 & 2033
- Table 80: Rest of Latin America Smart E-Drive Market Volume (K Unit) Forecast, by Application 2020 & 2033
- Table 81: Global Smart E-Drive Market Revenue billion Forecast, by Product 2020 & 2033
- Table 82: Global Smart E-Drive Market Volume K Unit Forecast, by Product 2020 & 2033
- Table 83: Global Smart E-Drive Market Revenue billion Forecast, by Voltage 2020 & 2033
- Table 84: Global Smart E-Drive Market Volume K Unit Forecast, by Voltage 2020 & 2033
- Table 85: Global Smart E-Drive Market Revenue billion Forecast, by Power Rating Statistics 2020 & 2033
- Table 86: Global Smart E-Drive Market Volume K Unit Forecast, by Power Rating Statistics 2020 & 2033
- Table 87: Global Smart E-Drive Market Revenue billion Forecast, by End-user Industry 2020 & 2033
- Table 88: Global Smart E-Drive Market Volume K Unit Forecast, by End-user Industry 2020 & 2033
- Table 89: Global Smart E-Drive Market Revenue billion Forecast, by Country 2020 & 2033
- Table 90: Global Smart E-Drive Market Volume K Unit Forecast, by Country 2020 & 2033
- Table 91: United Arab Emirates Smart E-Drive Market Revenue (billion) Forecast, by Application 2020 & 2033
- Table 92: United Arab Emirates Smart E-Drive Market Volume (K Unit) Forecast, by Application 2020 & 2033
- Table 93: Saudi Arabia Smart E-Drive Market Revenue (billion) Forecast, by Application 2020 & 2033
- Table 94: Saudi Arabia Smart E-Drive Market Volume (K Unit) Forecast, by Application 2020 & 2033
- Table 95: Turkey Smart E-Drive Market Revenue (billion) Forecast, by Application 2020 & 2033
- Table 96: Turkey Smart E-Drive Market Volume (K Unit) Forecast, by Application 2020 & 2033
- Table 97: Rest of Middle East and Africa Smart E-Drive Market Revenue (billion) Forecast, by Application 2020 & 2033
- Table 98: Rest of Middle East and Africa Smart E-Drive Market Volume (K Unit) Forecast, by Application 2020 & 2033
Frequently Asked Questions
1. What is the projected Compound Annual Growth Rate (CAGR) of the Smart E-Drive Market?
The projected CAGR is approximately 32.8%.
2. Which companies are prominent players in the Smart E-Drive Market?
Key companies in the market include ABB Ltd, SEW-EURODRIVE GmbH & Co KG, Danfoss, Nidec Corporation, Mitsubishi Electric Corporation, Siemens AG, Schneider Electric SE, TMEIC Corporation, Rockwell Automation Inc, Yaskawa Electric Corporation.
3. What are the main segments of the Smart E-Drive Market?
The market segments include Product, Voltage, Power Rating Statistics, End-user Industry.
4. Can you provide details about the market size?
The market size is estimated to be USD 2.1 billion as of 2022.
5. What are some drivers contributing to market growth?
Rapid Industrialization and Increased use of Electric Drives Across Major Vertical Industries; Growing Demand for Energy Efficiency.
6. What are the notable trends driving market growth?
Power Generation to be the Major End-user Industry.
7. Are there any restraints impacting market growth?
Technical Concerns of the Equipment; High Cost of the Equipment.
8. Can you provide examples of recent developments in the market?
May 2023: Yaskawa Europe, the Japanese technology group Yaskawa Electric's European subsidiary, officially relocated to Hattersheim, near Frankfurt/Main. Yaskawa invested approximately EUR 23 million (USD 24.57 million) in the new building at its new Hattersheim industrial park location. The construction took about two years, as planned.
9. What pricing options are available for accessing the report?
Pricing options include single-user, multi-user, and enterprise licenses priced at USD 4750, USD 5250, and USD 8750 respectively.
10. Is the market size provided in terms of value or volume?
The market size is provided in terms of value, measured in billion and volume, measured in K Unit.
11. Are there any specific market keywords associated with the report?
Yes, the market keyword associated with the report is "Smart E-Drive Market," which aids in identifying and referencing the specific market segment covered.
12. How do I determine which pricing option suits my needs best?
The pricing options vary based on user requirements and access needs. Individual users may opt for single-user licenses, while businesses requiring broader access may choose multi-user or enterprise licenses for cost-effective access to the report.
13. Are there any additional resources or data provided in the Smart E-Drive Market report?
While the report offers comprehensive insights, it's advisable to review the specific contents or supplementary materials provided to ascertain if additional resources or data are available.
14. How can I stay updated on further developments or reports in the Smart E-Drive Market?
To stay informed about further developments, trends, and reports in the Smart E-Drive Market, consider subscribing to industry newsletters, following relevant companies and organizations, or regularly checking reputable industry news sources and publications.
Methodology
Step 1 - Identification of Relevant Samples Size from Population Database


Step 2 - Approaches for Defining Global Market Size (Value, Volume* & Price*)

Note*: In applicable scenarios
Step 3 - Data Sources
Primary Research
- Web Analytics
- Survey Reports
- Research Institute
- Latest Research Reports
- Opinion Leaders
Secondary Research
- Annual Reports
- White Paper
- Latest Press Release
- Industry Association
- Paid Database
- Investor Presentations

Step 4 - Data Triangulation
Involves using different sources of information in order to increase the validity of a study
These sources are likely to be stakeholders in a program - participants, other researchers, program staff, other community members, and so on.
Then we put all data in single framework & apply various statistical tools to find out the dynamic on the market.
During the analysis stage, feedback from the stakeholder groups would be compared to determine areas of agreement as well as areas of divergence