

Key Insights
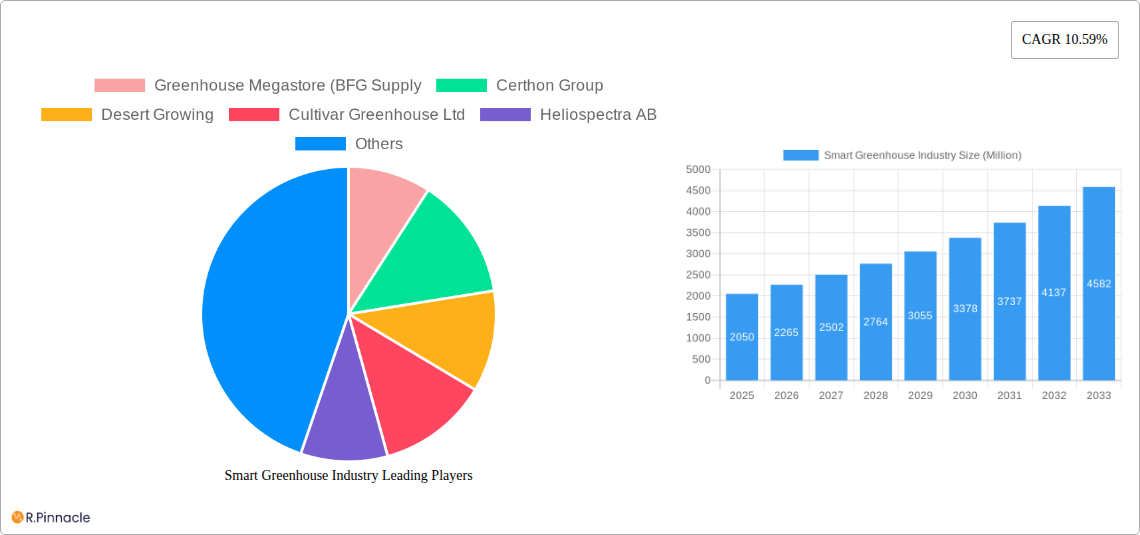
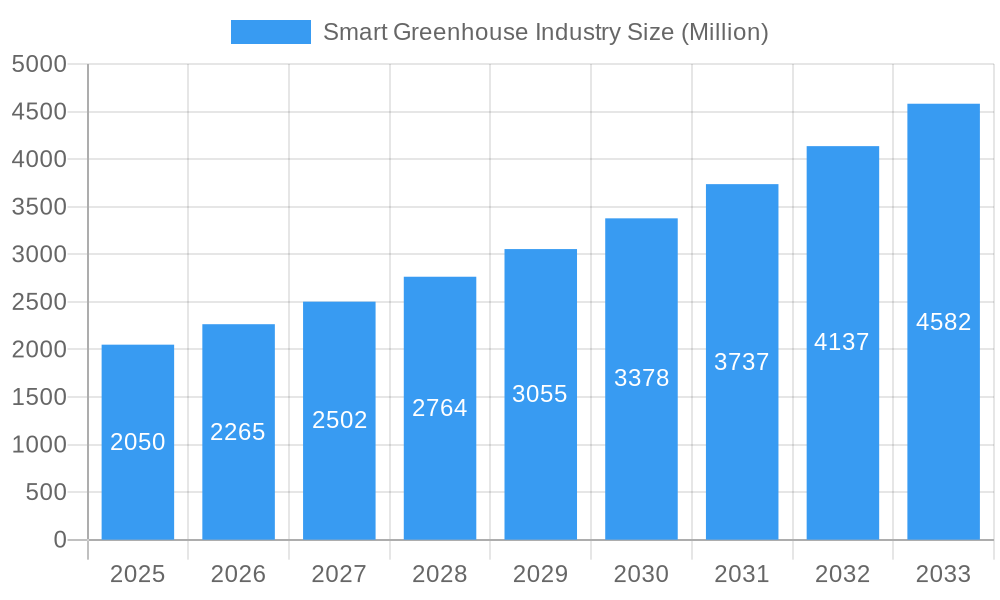
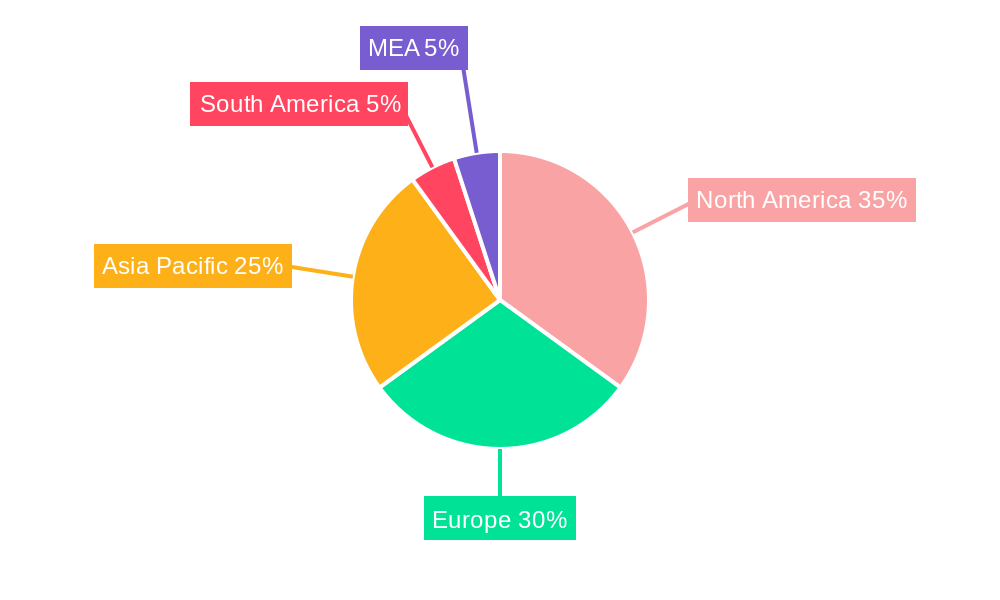
The global smart greenhouse market is experiencing robust growth, projected to reach \$2.05 billion in 2025 and maintain a Compound Annual Growth Rate (CAGR) of 10.59% from 2025 to 2033. This expansion is fueled by several key factors. Increasing global population and the subsequent rise in demand for fresh produce are driving the adoption of smart greenhouse technologies that enhance crop yields and efficiency. Furthermore, the escalating concerns regarding food security and the desire for sustainable agricultural practices are bolstering investment in advanced greenhouse systems. Technological advancements, including the integration of IoT sensors, AI-powered analytics, and automated climate control, are further optimizing resource utilization and maximizing productivity within these controlled environments. The market's segmentation reveals strong growth across various technologies, including LED grow lights, HVAC systems, and sophisticated irrigation technologies, all aimed at optimizing resource management and crop quality. North America and Europe currently hold significant market shares due to early adoption and established infrastructure, but the Asia-Pacific region is anticipated to witness significant growth in the coming years due to rising disposable incomes and increasing demand for high-quality produce.
Smart Greenhouse Industry Market Size (In Billion)
Competition within the smart greenhouse market is intense, with established players like Certhon Group and Luiten Greenhouses vying for market share alongside innovative technology providers like Heliospectra and Argus Control Systems. The market is also seeing a rise in smaller, specialized companies focusing on specific technologies or niche applications. While the high initial investment costs associated with smart greenhouse implementation could be a constraint, the long-term returns in terms of increased yields, reduced resource consumption, and improved product quality are proving compelling. Future growth is expected to be influenced by government initiatives promoting sustainable agriculture, technological innovation focused on precision agriculture and vertical farming, and increasing consumer awareness regarding the benefits of sustainably produced food. The market is poised for continued expansion, driven by both established and emerging technologies, and is expected to become increasingly sophisticated and integrated over the coming years.
Smart Greenhouse Industry Company Market Share
This comprehensive report provides an in-depth analysis of the global Smart Greenhouse Industry, offering invaluable insights for industry professionals, investors, and strategic decision-makers. With a study period spanning 2019-2033, a base year of 2025, and a forecast period of 2025-2033, this report leverages extensive market research to deliver actionable intelligence on market size (projected at $xx Million by 2033), growth drivers, challenges, and future opportunities.
Smart Greenhouse Industry Market Structure & Innovation Trends
This section analyzes the competitive landscape of the smart greenhouse industry, encompassing market concentration, innovation drivers, regulatory frameworks, and M&A activities. The market is characterized by a mix of large multinational corporations and specialized SMEs. Market concentration is moderate, with the top 5 players holding an estimated xx% market share in 2025. Innovation is primarily driven by advancements in automation, data analytics, and sustainable technologies. Stringent environmental regulations and increasing consumer demand for sustainably produced food are significant drivers. Product substitutes, such as traditional open-field farming, are facing increasing pressure due to the advantages offered by smart greenhouses in terms of yield and efficiency. End-user demographics are diverse, encompassing large-scale commercial growers, small-scale farmers, and research institutions. M&A activities have been moderate in recent years, with deal values averaging around $xx Million per transaction. Key examples include:
- Completed Mergers & Acquisitions: (Specific examples with deal values are needed, if available. Use xx if not.)
- Strategic Partnerships: Details about significant strategic partnerships, their value and effects.
Smart Greenhouse Industry Market Dynamics & Trends
The smart greenhouse industry is experiencing robust growth, driven by several key factors. The Compound Annual Growth Rate (CAGR) is projected at xx% from 2025 to 2033. Market penetration is increasing steadily, particularly in regions with favorable climate conditions and advanced agricultural practices. Technological disruptions, such as the adoption of AI-powered control systems and precision irrigation technologies, are significantly impacting market dynamics. Consumer preferences are shifting towards sustainably produced and locally sourced food, boosting demand for smart greenhouse products. Competitive dynamics are characterized by intense rivalry among established players and emerging startups, leading to continuous innovation and price competition. Several key technological trends, such as IoT integration and automation, are expected to reshape the market landscape in the coming years.
Dominant Regions & Segments in Smart Greenhouse Industry
The global smart greenhouse market is geographically diverse, with significant variations in growth rates and market share across different regions. While precise dominance needs further data, we predict North America and Europe will remain leading regions due to well-established agricultural infrastructure and high consumer demand for fresh produce.
Leading Segments by Type:
- Hydroponic: High growth potential due to increased efficiency and water conservation.
- Non-hydroponic: Continues to hold a significant market share, particularly in regions with abundant land resources.
Leading Segments by Technology:
- LED Grow Lights: Strong growth due to energy efficiency and customizable spectrum options.
- Control Systems: High demand for sophisticated automation and data analytics capabilities.
Key Drivers of Regional Dominance:
- Economic Policies: Government support for sustainable agriculture and technological innovation.
- Infrastructure: Availability of advanced infrastructure, including reliable power grids and internet connectivity.
Smart Greenhouse Industry Product Innovations
Recent product innovations focus on enhancing automation, data analytics, and resource efficiency. New control systems incorporating AI and machine learning offer precise environmental control and optimized resource management. Advanced sensor technologies enable real-time monitoring of plant health and environmental parameters, leading to higher yields and reduced waste. These innovations are tailored to meet the evolving needs of commercial growers and researchers, offering a competitive advantage in terms of yield, quality, and sustainability.
Report Scope & Segmentation Analysis
This report segments the smart greenhouse market by type (Hydroponic and Non-hydroponic) and technology (LED Grow Lights, HVAC, Material Handling, Control Systems, Sensors and Cameras, Valves and Pumps, Irrigation Systems). Each segment's growth projections, market sizes, and competitive dynamics are analyzed in detail.
- Hydroponic: Market size xx Million in 2025, projected to reach xx Million by 2033. Growth driven by water conservation and increased yields.
- Non-hydroponic: Market size xx Million in 2025, projected to reach xx Million by 2033. Growth driven by traditional farming practices and large land availability.
- LED Grow Lights: Market size xx Million in 2025, projected to reach xx Million by 2033. Growth driven by efficiency and customization.
- HVAC: Market size xx Million in 2025, projected to reach xx Million by 2033. Growth driven by climate control needs.
- Material Handling: Market size xx Million in 2025, projected to reach xx Million by 2033. Growth driven by automation.
- Control Systems: Market size xx Million in 2025, projected to reach xx Million by 2033. Growth driven by precision and data analytics.
- Sensors and Cameras: Market size xx Million in 2025, projected to reach xx Million by 2033. Growth driven by real-time monitoring.
- Valves and Pumps: Market size xx Million in 2025, projected to reach xx Million by 2033. Growth driven by efficient irrigation.
- Irrigation Systems: Market size xx Million in 2025, projected to reach xx Million by 2033. Growth driven by precise water management.
Key Drivers of Smart Greenhouse Industry Growth
The smart greenhouse industry is experiencing rapid growth driven by several factors:
- Technological Advancements: Innovations in automation, sensors, and data analytics are enhancing efficiency and yield.
- Economic Incentives: Government subsidies and tax breaks are encouraging adoption of sustainable agriculture practices.
- Climate Change: The need for climate-resilient agriculture is driving the adoption of smart greenhouses.
Challenges in the Smart Greenhouse Industry Sector
Despite the significant growth potential, the smart greenhouse industry faces several challenges:
- High Initial Investment Costs: The upfront costs of setting up a smart greenhouse can be substantial, limiting adoption by small-scale farmers.
- Supply Chain Disruptions: Global supply chain issues can impact the availability and cost of components.
- Energy Consumption: The energy consumption of smart greenhouses can be high, depending on the technologies used.
Emerging Opportunities in Smart Greenhouse Industry
Emerging opportunities in the smart greenhouse industry include:
- Vertical Farming: The integration of smart greenhouse technology into vertical farms is expanding the industry's potential.
- Data-Driven Agriculture: The use of AI and machine learning to optimize resource management and improve yields.
- New Market Expansion: Expanding into emerging economies with growing demand for fresh produce.
Leading Players in the Smart Greenhouse Industry Market
- Greenhouse Megastore
- Certhon Group
- Desert Growing
- Cultivar Greenhouse Ltd
- Heliospectra AB
- Sensaphone
- Luiten Greenhouses
- Argus Control Systems Ltd
- Prospiant Inc
- Kubo Greenhouse Projects BV
- Agra Tech Inc
- Netafim Irrigation Inc
Key Developments in Smart Greenhouse Industry
- October 2023: Netafim partnered with Vermillion Growers to construct Manitoba, Canada’s extensive vegetable greenhouse, showcasing the growth of Controlled Environment Agriculture (CEA).
- January 2024: The Iranian government launched a large-scale smart greenhouse in Zanjan province, demonstrating government investment in advanced agricultural technologies.
Future Outlook for Smart Greenhouse Industry Market
The smart greenhouse industry is poised for continued strong growth, driven by technological innovation, increasing demand for sustainable food production, and supportive government policies. Strategic opportunities exist for companies that can develop innovative technologies, expand into new markets, and build strong partnerships within the agricultural value chain. The market's future growth is significantly influenced by technological improvements in areas like AI and precision agriculture, alongside evolving consumer preferences towards sustainably sourced food products.
Smart Greenhouse Industry Segmentation
-
1. Type
- 1.1. Hydroponic
- 1.2. Non-hydroponic
-
2. Technology
- 2.1. LED Grow Light
- 2.2. HVAC
- 2.3. Material Handling
- 2.4. Control Systems
- 2.5. Sensors and Cameras
- 2.6. Valves and Pumps
- 2.7. Irrigation Systems
Smart Greenhouse Industry Segmentation By Geography
-
1. North America
- 1.1. United States
- 1.2. Canada
-
2. Europe
- 2.1. Germany
- 2.2. United Kingdom
- 2.3. France
- 2.4. Rest of Europe
-
3. Asia Pacific
- 3.1. India
- 3.2. China
- 3.3. Japan
- 3.4. Rest of Asia Pacific
- 4. Latin America
- 5. Middle East
Smart Greenhouse Industry Regional Market Share
Geographic Coverage of Smart Greenhouse Industry
Smart Greenhouse Industry REPORT HIGHLIGHTS
| Aspects | Details |
|---|---|
| Study Period | 2020-2034 |
| Base Year | 2025 |
| Estimated Year | 2026 |
| Forecast Period | 2026-2034 |
| Historical Period | 2020-2025 |
| Growth Rate | CAGR of 10.59% from 2020-2034 |
| Segmentation |
|
Table of Contents
- 1. Introduction
- 1.1. Research Scope
- 1.2. Market Segmentation
- 1.3. Research Objective
- 1.4. Definitions and Assumptions
- 2. Executive Summary
- 2.1. Market Snapshot
- 3. Market Dynamics
- 3.1. Market Drivers
- 3.2. Market Restrains
- 3.3. Market Trends
- 3.4. Market Opportunities
- 4. Market Factor Analysis
- 4.1. Porters Five Forces
- 4.1.1. Bargaining Power of Suppliers
- 4.1.2. Bargaining Power of Buyers
- 4.1.3. Threat of New Entrants
- 4.1.4. Threat of Substitutes
- 4.1.5. Competitive Rivalry
- 4.2. PESTEL analysis
- 4.3. BCG Analysis
- 4.3.1. Stars (High Growth, High Market Share)
- 4.3.2. Cash Cows (Low Growth, High Market Share)
- 4.3.3. Question Mark (High Growth, Low Market Share)
- 4.3.4. Dogs (Low Growth, Low Market Share)
- 4.4. Ansoff Matrix Analysis
- 4.5. Supply Chain Analysis
- 4.6. Regulatory Landscape
- 4.7. Current Market Potential and Opportunity Assessment (TAM–SAM–SOM Framework)
- 4.8. PRI Analyst Note
- 4.1. Porters Five Forces
- 5. Market Analysis, Insights and Forecast 2021-2033
- 5.1. Market Analysis, Insights and Forecast - by Type
- 5.1.1. Hydroponic
- 5.1.2. Non-hydroponic
- 5.2. Market Analysis, Insights and Forecast - by Technology
- 5.2.1. LED Grow Light
- 5.2.2. HVAC
- 5.2.3. Material Handling
- 5.2.4. Control Systems
- 5.2.5. Sensors and Cameras
- 5.2.6. Valves and Pumps
- 5.2.7. Irrigation Systems
- 5.3. Market Analysis, Insights and Forecast - by Region
- 5.3.1. North America
- 5.3.2. Europe
- 5.3.3. Asia Pacific
- 5.3.4. Latin America
- 5.3.5. Middle East
- 5.1. Market Analysis, Insights and Forecast - by Type
- 6. Global Smart Greenhouse Industry Analysis, Insights and Forecast, 2021-2033
- 6.1. Market Analysis, Insights and Forecast - by Type
- 6.1.1. Hydroponic
- 6.1.2. Non-hydroponic
- 6.2. Market Analysis, Insights and Forecast - by Technology
- 6.2.1. LED Grow Light
- 6.2.2. HVAC
- 6.2.3. Material Handling
- 6.2.4. Control Systems
- 6.2.5. Sensors and Cameras
- 6.2.6. Valves and Pumps
- 6.2.7. Irrigation Systems
- 6.1. Market Analysis, Insights and Forecast - by Type
- 7. North America Smart Greenhouse Industry Analysis, Insights and Forecast, 2020-2032
- 7.1. Market Analysis, Insights and Forecast - by Type
- 7.1.1. Hydroponic
- 7.1.2. Non-hydroponic
- 7.2. Market Analysis, Insights and Forecast - by Technology
- 7.2.1. LED Grow Light
- 7.2.2. HVAC
- 7.2.3. Material Handling
- 7.2.4. Control Systems
- 7.2.5. Sensors and Cameras
- 7.2.6. Valves and Pumps
- 7.2.7. Irrigation Systems
- 7.1. Market Analysis, Insights and Forecast - by Type
- 8. Europe Smart Greenhouse Industry Analysis, Insights and Forecast, 2020-2032
- 8.1. Market Analysis, Insights and Forecast - by Type
- 8.1.1. Hydroponic
- 8.1.2. Non-hydroponic
- 8.2. Market Analysis, Insights and Forecast - by Technology
- 8.2.1. LED Grow Light
- 8.2.2. HVAC
- 8.2.3. Material Handling
- 8.2.4. Control Systems
- 8.2.5. Sensors and Cameras
- 8.2.6. Valves and Pumps
- 8.2.7. Irrigation Systems
- 8.1. Market Analysis, Insights and Forecast - by Type
- 9. Asia Pacific Smart Greenhouse Industry Analysis, Insights and Forecast, 2020-2032
- 9.1. Market Analysis, Insights and Forecast - by Type
- 9.1.1. Hydroponic
- 9.1.2. Non-hydroponic
- 9.2. Market Analysis, Insights and Forecast - by Technology
- 9.2.1. LED Grow Light
- 9.2.2. HVAC
- 9.2.3. Material Handling
- 9.2.4. Control Systems
- 9.2.5. Sensors and Cameras
- 9.2.6. Valves and Pumps
- 9.2.7. Irrigation Systems
- 9.1. Market Analysis, Insights and Forecast - by Type
- 10. Latin America Smart Greenhouse Industry Analysis, Insights and Forecast, 2020-2032
- 10.1. Market Analysis, Insights and Forecast - by Type
- 10.1.1. Hydroponic
- 10.1.2. Non-hydroponic
- 10.2. Market Analysis, Insights and Forecast - by Technology
- 10.2.1. LED Grow Light
- 10.2.2. HVAC
- 10.2.3. Material Handling
- 10.2.4. Control Systems
- 10.2.5. Sensors and Cameras
- 10.2.6. Valves and Pumps
- 10.2.7. Irrigation Systems
- 10.1. Market Analysis, Insights and Forecast - by Type
- 11. Middle East Smart Greenhouse Industry Analysis, Insights and Forecast, 2020-2032
- 11.1. Market Analysis, Insights and Forecast - by Type
- 11.1.1. Hydroponic
- 11.1.2. Non-hydroponic
- 11.2. Market Analysis, Insights and Forecast - by Technology
- 11.2.1. LED Grow Light
- 11.2.2. HVAC
- 11.2.3. Material Handling
- 11.2.4. Control Systems
- 11.2.5. Sensors and Cameras
- 11.2.6. Valves and Pumps
- 11.2.7. Irrigation Systems
- 11.1. Market Analysis, Insights and Forecast - by Type
- 12. Competitive Analysis
- 12.1. Company Profiles
- 12.1.1 Greenhouse Megastore (BFG Supply
- 12.1.1.1. Company Overview
- 12.1.1.2. Products
- 12.1.1.3. Company Financials
- 12.1.1.4. SWOT Analysis
- 12.1.2 Certhon Group
- 12.1.2.1. Company Overview
- 12.1.2.2. Products
- 12.1.2.3. Company Financials
- 12.1.2.4. SWOT Analysis
- 12.1.3 Desert Growing
- 12.1.3.1. Company Overview
- 12.1.3.2. Products
- 12.1.3.3. Company Financials
- 12.1.3.4. SWOT Analysis
- 12.1.4 Cultivar Greenhouse Ltd
- 12.1.4.1. Company Overview
- 12.1.4.2. Products
- 12.1.4.3. Company Financials
- 12.1.4.4. SWOT Analysis
- 12.1.5 Heliospectra AB
- 12.1.5.1. Company Overview
- 12.1.5.2. Products
- 12.1.5.3. Company Financials
- 12.1.5.4. SWOT Analysis
- 12.1.6 Sensaphone
- 12.1.6.1. Company Overview
- 12.1.6.2. Products
- 12.1.6.3. Company Financials
- 12.1.6.4. SWOT Analysis
- 12.1.7 Luiten Greenhouses
- 12.1.7.1. Company Overview
- 12.1.7.2. Products
- 12.1.7.3. Company Financials
- 12.1.7.4. SWOT Analysis
- 12.1.8 Argus Control Systems Ltd
- 12.1.8.1. Company Overview
- 12.1.8.2. Products
- 12.1.8.3. Company Financials
- 12.1.8.4. SWOT Analysis
- 12.1.9 Prospiant Inc
- 12.1.9.1. Company Overview
- 12.1.9.2. Products
- 12.1.9.3. Company Financials
- 12.1.9.4. SWOT Analysis
- 12.1.10 Kubo Greenhouse Projects BV
- 12.1.10.1. Company Overview
- 12.1.10.2. Products
- 12.1.10.3. Company Financials
- 12.1.10.4. SWOT Analysis
- 12.1.11 Agra Tech Inc
- 12.1.11.1. Company Overview
- 12.1.11.2. Products
- 12.1.11.3. Company Financials
- 12.1.11.4. SWOT Analysis
- 12.1.12 Netafim Irrigation Inc
- 12.1.12.1. Company Overview
- 12.1.12.2. Products
- 12.1.12.3. Company Financials
- 12.1.12.4. SWOT Analysis
- 12.1.1 Greenhouse Megastore (BFG Supply
- 12.2. Market Entropy
- 12.2.1 Company's Key Areas Served
- 12.2.2 Recent Developments
- 12.3. Company Market Share Analysis 2025
- 12.3.1 Top 5 Companies Market Share Analysis
- 12.3.2 Top 3 Companies Market Share Analysis
- 12.4. List of Potential Customers
- 13. Research Methodology
List of Figures
- Figure 1: Global Smart Greenhouse Industry Revenue Breakdown (Million, %) by Region 2025 & 2033
- Figure 2: North America Smart Greenhouse Industry Revenue (Million), by Type 2025 & 2033
- Figure 3: North America Smart Greenhouse Industry Revenue Share (%), by Type 2025 & 2033
- Figure 4: North America Smart Greenhouse Industry Revenue (Million), by Technology 2025 & 2033
- Figure 5: North America Smart Greenhouse Industry Revenue Share (%), by Technology 2025 & 2033
- Figure 6: North America Smart Greenhouse Industry Revenue (Million), by Country 2025 & 2033
- Figure 7: North America Smart Greenhouse Industry Revenue Share (%), by Country 2025 & 2033
- Figure 8: Europe Smart Greenhouse Industry Revenue (Million), by Type 2025 & 2033
- Figure 9: Europe Smart Greenhouse Industry Revenue Share (%), by Type 2025 & 2033
- Figure 10: Europe Smart Greenhouse Industry Revenue (Million), by Technology 2025 & 2033
- Figure 11: Europe Smart Greenhouse Industry Revenue Share (%), by Technology 2025 & 2033
- Figure 12: Europe Smart Greenhouse Industry Revenue (Million), by Country 2025 & 2033
- Figure 13: Europe Smart Greenhouse Industry Revenue Share (%), by Country 2025 & 2033
- Figure 14: Asia Pacific Smart Greenhouse Industry Revenue (Million), by Type 2025 & 2033
- Figure 15: Asia Pacific Smart Greenhouse Industry Revenue Share (%), by Type 2025 & 2033
- Figure 16: Asia Pacific Smart Greenhouse Industry Revenue (Million), by Technology 2025 & 2033
- Figure 17: Asia Pacific Smart Greenhouse Industry Revenue Share (%), by Technology 2025 & 2033
- Figure 18: Asia Pacific Smart Greenhouse Industry Revenue (Million), by Country 2025 & 2033
- Figure 19: Asia Pacific Smart Greenhouse Industry Revenue Share (%), by Country 2025 & 2033
- Figure 20: Latin America Smart Greenhouse Industry Revenue (Million), by Type 2025 & 2033
- Figure 21: Latin America Smart Greenhouse Industry Revenue Share (%), by Type 2025 & 2033
- Figure 22: Latin America Smart Greenhouse Industry Revenue (Million), by Technology 2025 & 2033
- Figure 23: Latin America Smart Greenhouse Industry Revenue Share (%), by Technology 2025 & 2033
- Figure 24: Latin America Smart Greenhouse Industry Revenue (Million), by Country 2025 & 2033
- Figure 25: Latin America Smart Greenhouse Industry Revenue Share (%), by Country 2025 & 2033
- Figure 26: Middle East Smart Greenhouse Industry Revenue (Million), by Type 2025 & 2033
- Figure 27: Middle East Smart Greenhouse Industry Revenue Share (%), by Type 2025 & 2033
- Figure 28: Middle East Smart Greenhouse Industry Revenue (Million), by Technology 2025 & 2033
- Figure 29: Middle East Smart Greenhouse Industry Revenue Share (%), by Technology 2025 & 2033
- Figure 30: Middle East Smart Greenhouse Industry Revenue (Million), by Country 2025 & 2033
- Figure 31: Middle East Smart Greenhouse Industry Revenue Share (%), by Country 2025 & 2033
List of Tables
- Table 1: Global Smart Greenhouse Industry Revenue Million Forecast, by Type 2020 & 2033
- Table 2: Global Smart Greenhouse Industry Revenue Million Forecast, by Technology 2020 & 2033
- Table 3: Global Smart Greenhouse Industry Revenue Million Forecast, by Region 2020 & 2033
- Table 4: Global Smart Greenhouse Industry Revenue Million Forecast, by Type 2020 & 2033
- Table 5: Global Smart Greenhouse Industry Revenue Million Forecast, by Technology 2020 & 2033
- Table 6: Global Smart Greenhouse Industry Revenue Million Forecast, by Country 2020 & 2033
- Table 7: United States Smart Greenhouse Industry Revenue (Million) Forecast, by Application 2020 & 2033
- Table 8: Canada Smart Greenhouse Industry Revenue (Million) Forecast, by Application 2020 & 2033
- Table 9: Global Smart Greenhouse Industry Revenue Million Forecast, by Type 2020 & 2033
- Table 10: Global Smart Greenhouse Industry Revenue Million Forecast, by Technology 2020 & 2033
- Table 11: Global Smart Greenhouse Industry Revenue Million Forecast, by Country 2020 & 2033
- Table 12: Germany Smart Greenhouse Industry Revenue (Million) Forecast, by Application 2020 & 2033
- Table 13: United Kingdom Smart Greenhouse Industry Revenue (Million) Forecast, by Application 2020 & 2033
- Table 14: France Smart Greenhouse Industry Revenue (Million) Forecast, by Application 2020 & 2033
- Table 15: Rest of Europe Smart Greenhouse Industry Revenue (Million) Forecast, by Application 2020 & 2033
- Table 16: Global Smart Greenhouse Industry Revenue Million Forecast, by Type 2020 & 2033
- Table 17: Global Smart Greenhouse Industry Revenue Million Forecast, by Technology 2020 & 2033
- Table 18: Global Smart Greenhouse Industry Revenue Million Forecast, by Country 2020 & 2033
- Table 19: India Smart Greenhouse Industry Revenue (Million) Forecast, by Application 2020 & 2033
- Table 20: China Smart Greenhouse Industry Revenue (Million) Forecast, by Application 2020 & 2033
- Table 21: Japan Smart Greenhouse Industry Revenue (Million) Forecast, by Application 2020 & 2033
- Table 22: Rest of Asia Pacific Smart Greenhouse Industry Revenue (Million) Forecast, by Application 2020 & 2033
- Table 23: Global Smart Greenhouse Industry Revenue Million Forecast, by Type 2020 & 2033
- Table 24: Global Smart Greenhouse Industry Revenue Million Forecast, by Technology 2020 & 2033
- Table 25: Global Smart Greenhouse Industry Revenue Million Forecast, by Country 2020 & 2033
- Table 26: Global Smart Greenhouse Industry Revenue Million Forecast, by Type 2020 & 2033
- Table 27: Global Smart Greenhouse Industry Revenue Million Forecast, by Technology 2020 & 2033
- Table 28: Global Smart Greenhouse Industry Revenue Million Forecast, by Country 2020 & 2033
Frequently Asked Questions
1. What is the projected Compound Annual Growth Rate (CAGR) of the Smart Greenhouse Industry?
The projected CAGR is approximately 10.59%.
2. Which companies are prominent players in the Smart Greenhouse Industry?
Key companies in the market include Greenhouse Megastore (BFG Supply, Certhon Group, Desert Growing, Cultivar Greenhouse Ltd, Heliospectra AB, Sensaphone, Luiten Greenhouses, Argus Control Systems Ltd, Prospiant Inc, Kubo Greenhouse Projects BV, Agra Tech Inc, Netafim Irrigation Inc.
3. What are the main segments of the Smart Greenhouse Industry?
The market segments include Type, Technology.
4. Can you provide details about the market size?
The market size is estimated to be USD 2.05 Million as of 2022.
5. What are some drivers contributing to market growth?
Increasing Adoption of IoT and AI by Farmers and Agriculturists; Growing Demand for Food due to Continuously Increasing Global Population.
6. What are the notable trends driving market growth?
HVAC Segment to Hold Significant Market Share.
7. Are there any restraints impacting market growth?
High Costs and Operational Concerns; Concerns related to Geoprivacy and Confidential Data.
8. Can you provide examples of recent developments in the market?
January 2024: The Iranian government launched an innovative glass smart greenhouse in Zanjan province, which is one of the largest in the country. The glass greenhouse spans over 30 ha and includes 7 ha of tunnels. The glass greenhouse primarily grows bell peppers, but there are plans to expand into cherry tomatoes and strawberries soon.
9. What pricing options are available for accessing the report?
Pricing options include single-user, multi-user, and enterprise licenses priced at USD 4750, USD 5250, and USD 8750 respectively.
10. Is the market size provided in terms of value or volume?
The market size is provided in terms of value, measured in Million.
11. Are there any specific market keywords associated with the report?
Yes, the market keyword associated with the report is "Smart Greenhouse Industry," which aids in identifying and referencing the specific market segment covered.
12. How do I determine which pricing option suits my needs best?
The pricing options vary based on user requirements and access needs. Individual users may opt for single-user licenses, while businesses requiring broader access may choose multi-user or enterprise licenses for cost-effective access to the report.
13. Are there any additional resources or data provided in the Smart Greenhouse Industry report?
While the report offers comprehensive insights, it's advisable to review the specific contents or supplementary materials provided to ascertain if additional resources or data are available.
14. How can I stay updated on further developments or reports in the Smart Greenhouse Industry?
To stay informed about further developments, trends, and reports in the Smart Greenhouse Industry, consider subscribing to industry newsletters, following relevant companies and organizations, or regularly checking reputable industry news sources and publications.
Methodology
Step 1 - Identification of Relevant Samples Size from Population Database


Step 2 - Approaches for Defining Global Market Size (Value, Volume* & Price*)

Note*: In applicable scenarios
Step 3 - Data Sources
Primary Research
- Web Analytics
- Survey Reports
- Research Institute
- Latest Research Reports
- Opinion Leaders
Secondary Research
- Annual Reports
- White Paper
- Latest Press Release
- Industry Association
- Paid Database
- Investor Presentations

Step 4 - Data Triangulation
Involves using different sources of information in order to increase the validity of a study
These sources are likely to be stakeholders in a program - participants, other researchers, program staff, other community members, and so on.
Then we put all data in single framework & apply various statistical tools to find out the dynamic on the market.
During the analysis stage, feedback from the stakeholder groups would be compared to determine areas of agreement as well as areas of divergence