Key Insights
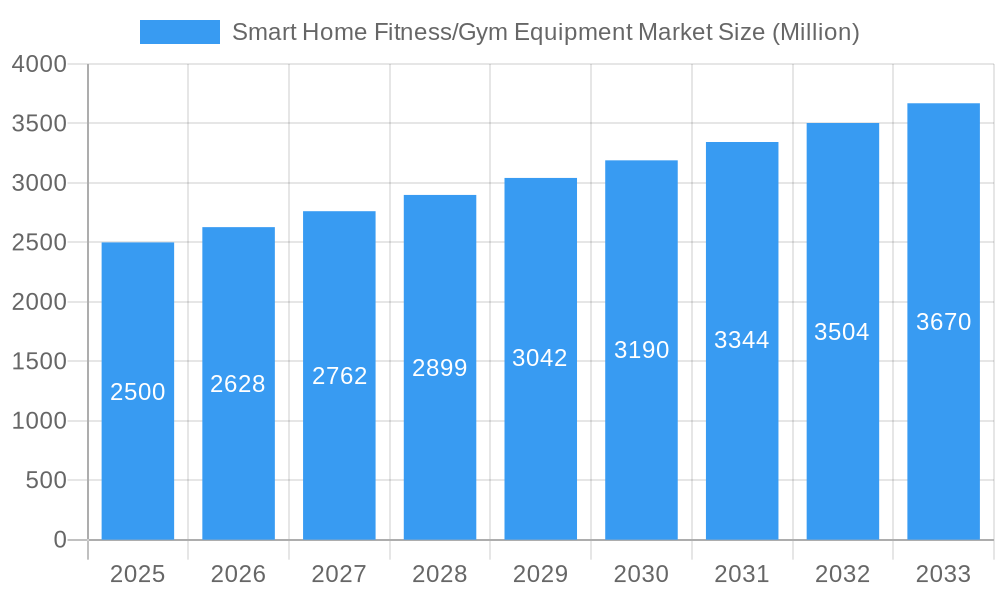
The global smart home fitness/gym equipment market, valued at $2.5 billion in 2025, is projected to experience robust growth, driven by several key factors. The rising prevalence of sedentary lifestyles, increasing health consciousness, and the convenience of at-home workouts are fueling market expansion. Technological advancements, such as the integration of AI, virtual reality, and gamification into fitness equipment, enhance user engagement and motivation, thereby boosting market appeal. Furthermore, the increasing affordability of smart fitness equipment and the expanding availability through diverse distribution channels, including online marketplaces and specialized fitness retailers, are contributing to market growth. The market is segmented by product type (cardiovascular and strength training equipment) and distribution channel (supermarkets/hypermarkets, specialized stores, online, and others). Leading companies like Peloton, Nautilus, and Technogym are driving innovation and market competition, further shaping the industry landscape. The Asia-Pacific region, particularly India and China, is expected to witness significant growth due to increasing disposable incomes and a growing awareness of health and fitness. While potential restraints include high initial investment costs and concerns about data privacy, the overall market trajectory indicates substantial growth potential throughout the forecast period (2025-2033).
Smart Home Fitness/Gym Equipment Market Market Size (In Billion)
The market's 5.13% CAGR suggests a steady expansion over the coming years. North America and Europe currently hold significant market shares, but the Asia-Pacific region is poised for rapid expansion. The increasing popularity of subscription-based fitness programs integrated with smart equipment further enhances market dynamics. Competition is intensifying with established players and emerging companies vying for market share. This necessitates companies to focus on product innovation, strategic partnerships, and effective marketing strategies to maintain a competitive edge. Continued investment in research and development will play a critical role in driving future growth and improving the user experience, creating a sustainable and ever-evolving market.
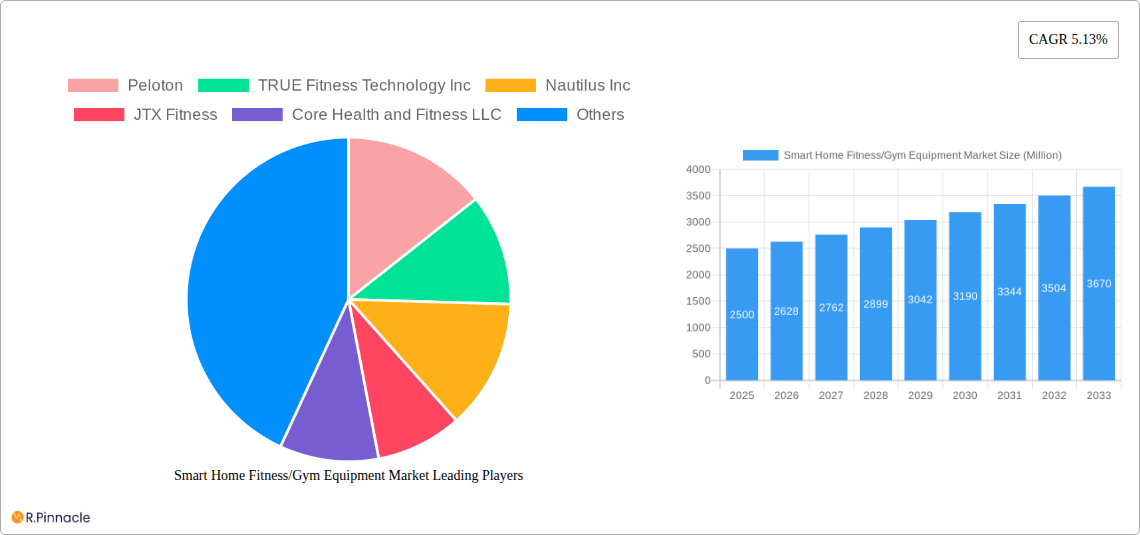
Smart Home Fitness/Gym Equipment Market Company Market Share
Smart Home Fitness/Gym Equipment Market Report: 2019-2033
This comprehensive report provides an in-depth analysis of the Smart Home Fitness/Gym Equipment market, offering valuable insights for industry professionals, investors, and strategic decision-makers. Covering the period from 2019 to 2033, with a base year of 2025, this report unveils the market's structure, dynamics, and future potential. The report uses Million for all values.
Smart Home Fitness/Gym Equipment Market Structure & Innovation Trends
This section analyzes the competitive landscape, innovation drivers, and regulatory influences shaping the smart home fitness equipment market. The market is characterized by a mix of established players and emerging startups, resulting in a moderately consolidated structure. Key players such as Peloton, Technogym, and ICON Health & Fitness hold significant market share, while smaller companies focus on niche segments or innovative product offerings.
- Market Concentration: The market exhibits moderate concentration, with the top 5 players holding an estimated xx% market share in 2025.
- Innovation Drivers: Technological advancements in areas like AI, virtual reality (VR), and interactive fitness apps are driving innovation. The demand for personalized fitness experiences and convenient home workouts fuels further development.
- Regulatory Frameworks: Safety and data privacy regulations play a crucial role, impacting product design and data handling practices. Compliance costs can vary depending on the region.
- Product Substitutes: Traditional gym memberships and outdoor fitness activities remain key substitutes, particularly for price-sensitive consumers.
- End-User Demographics: The target market is expanding, encompassing a wider range of age groups and fitness levels, driven by increased health consciousness and the convenience of home workouts.
- M&A Activities: Significant M&A activity has been observed, particularly in the connected fitness space. For instance, ICON Health & Fitness's acquisition of Sweat in February 2023 for USD 300 Million highlights the strategic importance of expanding into digital fitness platforms. The total value of M&A deals in the period 2019-2024 is estimated at xx Million.
Smart Home Fitness/Gym Equipment Market Dynamics & Trends
The smart home fitness equipment market is experiencing robust growth, driven by several factors. The market's Compound Annual Growth Rate (CAGR) during the forecast period (2025-2033) is projected at xx%. Market penetration is steadily increasing, particularly among younger demographics and tech-savvy consumers.
Technological disruptions, particularly the integration of smart features and digital fitness platforms, are transforming the consumer experience. The increasing preference for personalized and convenient fitness solutions contributes to market expansion. Competitive dynamics are intense, with companies vying for market share through product innovation, strategic partnerships, and aggressive marketing campaigns. The rising adoption of subscription-based fitness models also influences market dynamics.
Dominant Regions & Segments in Smart Home Fitness/Gym Equipment Market
The North American region currently holds the largest market share in the smart home fitness equipment sector, driven by high disposable incomes, technological advancement, and increasing health awareness. However, significant growth potential exists in Asia-Pacific, fueled by rising urbanization and increasing adoption of digital fitness solutions.
By Product Type:
- Cardiovascular Training Equipment: This segment dominates, driven by the popularity of treadmills, stationary bikes, and ellipticals. The market size for cardiovascular training equipment in 2025 is estimated at xx Million.
- Strength Training Equipment: This segment shows strong growth potential, fueled by the increasing demand for home gyms and personalized strength training solutions. The market size for strength training equipment in 2025 is estimated at xx Million.
By Distribution Channel:
- Online: This channel is rapidly expanding, driven by the convenience and reach of e-commerce platforms. The online segment is projected to have the highest CAGR during the forecast period.
- Specialized Stores: These stores offer specialized expertise and a curated selection of products, catering to a more discerning customer base.
- Supermarkets/Hypermarkets: This channel is gaining traction as major retailers expand their offerings of fitness equipment.
- Other Distribution Channels: This includes direct sales, distributors and other channels.
Key Drivers: Economic factors (disposable income, consumer spending), technological advancements (smart features, digital integration), and supportive government initiatives (health and wellness programs) contribute to regional dominance.
Smart Home Fitness/Gym Equipment Market Product Innovations
Recent innovations center on enhanced connectivity, AI-powered personal training features, and integration with diverse fitness platforms. Products are increasingly incorporating gamification and social features to enhance user engagement and motivation. This focus on personalized fitness and convenient home workouts is driving market growth and creating significant competitive advantages.
Report Scope & Segmentation Analysis
This report segments the smart home fitness equipment market by product type (cardiovascular and strength training equipment) and distribution channel (supermarkets/hypermarkets, specialized stores, online, and other channels). Each segment's growth projections, market sizes, and competitive dynamics are analyzed in detail within the report, considering the period from 2019 to 2033.
For example, the online distribution channel is expected to exhibit the highest growth, driven by increasing e-commerce penetration and convenience for consumers. The cardiovascular training equipment segment is anticipated to continue its dominance due to high demand for this type of equipment.
Key Drivers of Smart Home Fitness/Gym Equipment Market Growth
Several factors drive the market's growth:
- Technological advancements: Smart features, interactive apps, and AI-powered personal training are enhancing user experience and driving demand.
- Health and wellness trends: Growing awareness of health and fitness is pushing consumers toward home workout solutions.
- Convenience and affordability: Home fitness equipment provides a convenient and often more affordable alternative to traditional gym memberships.
Challenges in the Smart Home Fitness/Gym Equipment Market Sector
Challenges include:
- High initial investment costs: The price of advanced smart home fitness equipment can be prohibitive for some consumers.
- Maintenance and repairs: The complexity of some equipment can result in higher maintenance and repair costs.
- Competition: The market is highly competitive, with established and emerging players vying for market share.
Emerging Opportunities in Smart Home Fitness/Gym Equipment Market
Opportunities exist in:
- Expansion into developing markets: Untapped potential exists in emerging economies with growing middle classes.
- Integration with other smart home devices: Seamless integration with other smart home ecosystems enhances user experience.
- Development of specialized fitness programs: Targeted fitness programs catering to specific demographics or fitness goals.
Leading Players in the Smart Home Fitness/Gym Equipment Market Market
- Peloton
- TRUE Fitness Technology Inc
- Nautilus Inc
- JTX Fitness
- Core Health and Fitness LLC
- Precor Inc
- Tonal System Inc
- Technogym
- ICON Health & Fitness Inc
- Life Fitness Inc
Key Developments in Smart Home Fitness/Gym Equipment Market Industry
- October 2023: Lululemon partnered with Peloton for a five-year content, apparel, and community initiative, discontinuing its mirror service. This highlights the increasing importance of strategic partnerships in the connected fitness space.
- February 2023: iFIT (ICON Health & Fitness) acquired Sweat for USD 300 Million, expanding its portfolio into women's health and digital fitness. This illustrates the trend of consolidation and expansion into complementary segments.
Future Outlook for Smart Home Fitness/Gym Equipment Market Market
The smart home fitness equipment market is poised for sustained growth, driven by technological innovation, evolving consumer preferences, and increasing health awareness. Strategic partnerships, expansion into new markets, and the development of innovative fitness solutions will shape the future of this dynamic sector. The market is expected to reach xx Million by 2033.
Smart Home Fitness/Gym Equipment Market Segmentation
-
1. Product Type
- 1.1. Cardiovascular Training Equipment
- 1.2. Strength Training Equipment
-
2. Distribution Channel
- 2.1. Supermarkets/Hypermarkets
- 2.2. Specialized Stores
- 2.3. Online
- 2.4. Other Distribution Channels
Smart Home Fitness/Gym Equipment Market Segmentation By Geography
-
1. Asia Pacific
- 1.1. India
- 1.2. China
- 1.3. Japan
- 1.4. Australia
- 1.5. Rest of Asia Pacific
-
2. North America
- 2.1. United States
- 2.2. Mexico
- 2.3. Rest of North America
-
3. Europe
- 3.1. Germany
- 3.2. United Kingdom
- 3.3. France
- 3.4. Russia
- 3.5. Rest of Europe
-
4. South America
- 4.1. Brazil
- 4.2. Argentina
- 4.3. Rest of South America
-
5. Middle East and Africa
- 5.1. United Arab Emirates
- 5.2. South Africa
- 5.3. Rest of Middle East and Africa
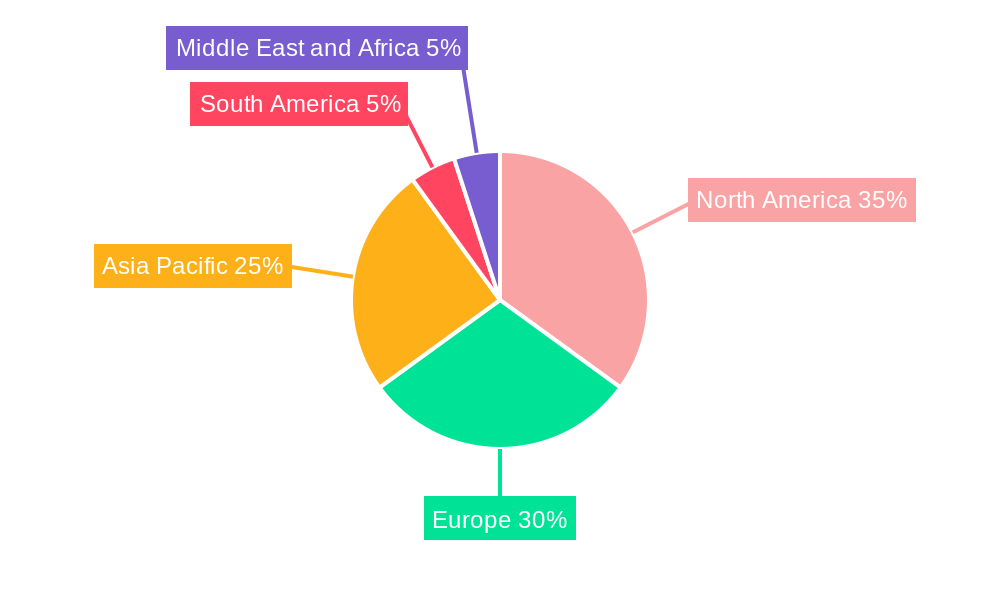
Smart Home Fitness/Gym Equipment Market Regional Market Share
Geographic Coverage of Smart Home Fitness/Gym Equipment Market
Smart Home Fitness/Gym Equipment Market REPORT HIGHLIGHTS
| Aspects | Details |
|---|---|
| Study Period | 2020-2034 |
| Base Year | 2025 |
| Estimated Year | 2026 |
| Forecast Period | 2026-2034 |
| Historical Period | 2020-2025 |
| Growth Rate | CAGR of 5.13% from 2020-2034 |
| Segmentation |
|
Table of Contents
- 1. Introduction
- 1.1. Research Scope
- 1.2. Market Segmentation
- 1.3. Research Objective
- 1.4. Definitions and Assumptions
- 2. Executive Summary
- 2.1. Market Snapshot
- 3. Market Dynamics
- 3.1. Market Drivers
- 3.2. Market Restrains
- 3.3. Market Trends
- 3.4. Market Opportunities
- 4. Market Factor Analysis
- 4.1. Porters Five Forces
- 4.1.1. Bargaining Power of Suppliers
- 4.1.2. Bargaining Power of Buyers
- 4.1.3. Threat of New Entrants
- 4.1.4. Threat of Substitutes
- 4.1.5. Competitive Rivalry
- 4.2. PESTEL analysis
- 4.3. BCG Analysis
- 4.3.1. Stars (High Growth, High Market Share)
- 4.3.2. Cash Cows (Low Growth, High Market Share)
- 4.3.3. Question Mark (High Growth, Low Market Share)
- 4.3.4. Dogs (Low Growth, Low Market Share)
- 4.4. Ansoff Matrix Analysis
- 4.5. Supply Chain Analysis
- 4.6. Regulatory Landscape
- 4.7. Current Market Potential and Opportunity Assessment (TAM–SAM–SOM Framework)
- 4.8. PRI Analyst Note
- 4.1. Porters Five Forces
- 5. Market Analysis, Insights and Forecast 2021-2033
- 5.1. Market Analysis, Insights and Forecast - by Product Type
- 5.1.1. Cardiovascular Training Equipment
- 5.1.2. Strength Training Equipment
- 5.2. Market Analysis, Insights and Forecast - by Distribution Channel
- 5.2.1. Supermarkets/Hypermarkets
- 5.2.2. Specialized Stores
- 5.2.3. Online
- 5.2.4. Other Distribution Channels
- 5.3. Market Analysis, Insights and Forecast - by Region
- 5.3.1. Asia Pacific
- 5.3.2. North America
- 5.3.3. Europe
- 5.3.4. South America
- 5.3.5. Middle East and Africa
- 5.1. Market Analysis, Insights and Forecast - by Product Type
- 6. Global Smart Home Fitness/Gym Equipment Market Analysis, Insights and Forecast, 2021-2033
- 6.1. Market Analysis, Insights and Forecast - by Product Type
- 6.1.1. Cardiovascular Training Equipment
- 6.1.2. Strength Training Equipment
- 6.2. Market Analysis, Insights and Forecast - by Distribution Channel
- 6.2.1. Supermarkets/Hypermarkets
- 6.2.2. Specialized Stores
- 6.2.3. Online
- 6.2.4. Other Distribution Channels
- 6.1. Market Analysis, Insights and Forecast - by Product Type
- 7. Asia Pacific Smart Home Fitness/Gym Equipment Market Analysis, Insights and Forecast, 2020-2032
- 7.1. Market Analysis, Insights and Forecast - by Product Type
- 7.1.1. Cardiovascular Training Equipment
- 7.1.2. Strength Training Equipment
- 7.2. Market Analysis, Insights and Forecast - by Distribution Channel
- 7.2.1. Supermarkets/Hypermarkets
- 7.2.2. Specialized Stores
- 7.2.3. Online
- 7.2.4. Other Distribution Channels
- 7.1. Market Analysis, Insights and Forecast - by Product Type
- 8. North America Smart Home Fitness/Gym Equipment Market Analysis, Insights and Forecast, 2020-2032
- 8.1. Market Analysis, Insights and Forecast - by Product Type
- 8.1.1. Cardiovascular Training Equipment
- 8.1.2. Strength Training Equipment
- 8.2. Market Analysis, Insights and Forecast - by Distribution Channel
- 8.2.1. Supermarkets/Hypermarkets
- 8.2.2. Specialized Stores
- 8.2.3. Online
- 8.2.4. Other Distribution Channels
- 8.1. Market Analysis, Insights and Forecast - by Product Type
- 9. Europe Smart Home Fitness/Gym Equipment Market Analysis, Insights and Forecast, 2020-2032
- 9.1. Market Analysis, Insights and Forecast - by Product Type
- 9.1.1. Cardiovascular Training Equipment
- 9.1.2. Strength Training Equipment
- 9.2. Market Analysis, Insights and Forecast - by Distribution Channel
- 9.2.1. Supermarkets/Hypermarkets
- 9.2.2. Specialized Stores
- 9.2.3. Online
- 9.2.4. Other Distribution Channels
- 9.1. Market Analysis, Insights and Forecast - by Product Type
- 10. South America Smart Home Fitness/Gym Equipment Market Analysis, Insights and Forecast, 2020-2032
- 10.1. Market Analysis, Insights and Forecast - by Product Type
- 10.1.1. Cardiovascular Training Equipment
- 10.1.2. Strength Training Equipment
- 10.2. Market Analysis, Insights and Forecast - by Distribution Channel
- 10.2.1. Supermarkets/Hypermarkets
- 10.2.2. Specialized Stores
- 10.2.3. Online
- 10.2.4. Other Distribution Channels
- 10.1. Market Analysis, Insights and Forecast - by Product Type
- 11. Middle East and Africa Smart Home Fitness/Gym Equipment Market Analysis, Insights and Forecast, 2020-2032
- 11.1. Market Analysis, Insights and Forecast - by Product Type
- 11.1.1. Cardiovascular Training Equipment
- 11.1.2. Strength Training Equipment
- 11.2. Market Analysis, Insights and Forecast - by Distribution Channel
- 11.2.1. Supermarkets/Hypermarkets
- 11.2.2. Specialized Stores
- 11.2.3. Online
- 11.2.4. Other Distribution Channels
- 11.1. Market Analysis, Insights and Forecast - by Product Type
- 12. Competitive Analysis
- 12.1. Company Profiles
- 12.1.1 Peloton
- 12.1.1.1. Company Overview
- 12.1.1.2. Products
- 12.1.1.3. Company Financials
- 12.1.1.4. SWOT Analysis
- 12.1.2 TRUE Fitness Technology Inc
- 12.1.2.1. Company Overview
- 12.1.2.2. Products
- 12.1.2.3. Company Financials
- 12.1.2.4. SWOT Analysis
- 12.1.3 Nautilus Inc
- 12.1.3.1. Company Overview
- 12.1.3.2. Products
- 12.1.3.3. Company Financials
- 12.1.3.4. SWOT Analysis
- 12.1.4 JTX Fitness
- 12.1.4.1. Company Overview
- 12.1.4.2. Products
- 12.1.4.3. Company Financials
- 12.1.4.4. SWOT Analysis
- 12.1.5 Core Health and Fitness LLC
- 12.1.5.1. Company Overview
- 12.1.5.2. Products
- 12.1.5.3. Company Financials
- 12.1.5.4. SWOT Analysis
- 12.1.6 Precor Inc
- 12.1.6.1. Company Overview
- 12.1.6.2. Products
- 12.1.6.3. Company Financials
- 12.1.6.4. SWOT Analysis
- 12.1.7 Tonal System Inc
- 12.1.7.1. Company Overview
- 12.1.7.2. Products
- 12.1.7.3. Company Financials
- 12.1.7.4. SWOT Analysis
- 12.1.8 Technogym
- 12.1.8.1. Company Overview
- 12.1.8.2. Products
- 12.1.8.3. Company Financials
- 12.1.8.4. SWOT Analysis
- 12.1.9 ICON Health & Fitness Inc
- 12.1.9.1. Company Overview
- 12.1.9.2. Products
- 12.1.9.3. Company Financials
- 12.1.9.4. SWOT Analysis
- 12.1.10 Life Fitness Inc
- 12.1.10.1. Company Overview
- 12.1.10.2. Products
- 12.1.10.3. Company Financials
- 12.1.10.4. SWOT Analysis
- 12.1.1 Peloton
- 12.2. Market Entropy
- 12.2.1 Company's Key Areas Served
- 12.2.2 Recent Developments
- 12.3. Company Market Share Analysis 2025
- 12.3.1 Top 5 Companies Market Share Analysis
- 12.3.2 Top 3 Companies Market Share Analysis
- 12.4. List of Potential Customers
- 13. Research Methodology
List of Figures
- Figure 1: Global Smart Home Fitness/Gym Equipment Market Revenue Breakdown (Million, %) by Region 2025 & 2033
- Figure 2: Global Smart Home Fitness/Gym Equipment Market Volume Breakdown (K Units, %) by Region 2025 & 2033
- Figure 3: Asia Pacific Smart Home Fitness/Gym Equipment Market Revenue (Million), by Product Type 2025 & 2033
- Figure 4: Asia Pacific Smart Home Fitness/Gym Equipment Market Volume (K Units), by Product Type 2025 & 2033
- Figure 5: Asia Pacific Smart Home Fitness/Gym Equipment Market Revenue Share (%), by Product Type 2025 & 2033
- Figure 6: Asia Pacific Smart Home Fitness/Gym Equipment Market Volume Share (%), by Product Type 2025 & 2033
- Figure 7: Asia Pacific Smart Home Fitness/Gym Equipment Market Revenue (Million), by Distribution Channel 2025 & 2033
- Figure 8: Asia Pacific Smart Home Fitness/Gym Equipment Market Volume (K Units), by Distribution Channel 2025 & 2033
- Figure 9: Asia Pacific Smart Home Fitness/Gym Equipment Market Revenue Share (%), by Distribution Channel 2025 & 2033
- Figure 10: Asia Pacific Smart Home Fitness/Gym Equipment Market Volume Share (%), by Distribution Channel 2025 & 2033
- Figure 11: Asia Pacific Smart Home Fitness/Gym Equipment Market Revenue (Million), by Country 2025 & 2033
- Figure 12: Asia Pacific Smart Home Fitness/Gym Equipment Market Volume (K Units), by Country 2025 & 2033
- Figure 13: Asia Pacific Smart Home Fitness/Gym Equipment Market Revenue Share (%), by Country 2025 & 2033
- Figure 14: Asia Pacific Smart Home Fitness/Gym Equipment Market Volume Share (%), by Country 2025 & 2033
- Figure 15: North America Smart Home Fitness/Gym Equipment Market Revenue (Million), by Product Type 2025 & 2033
- Figure 16: North America Smart Home Fitness/Gym Equipment Market Volume (K Units), by Product Type 2025 & 2033
- Figure 17: North America Smart Home Fitness/Gym Equipment Market Revenue Share (%), by Product Type 2025 & 2033
- Figure 18: North America Smart Home Fitness/Gym Equipment Market Volume Share (%), by Product Type 2025 & 2033
- Figure 19: North America Smart Home Fitness/Gym Equipment Market Revenue (Million), by Distribution Channel 2025 & 2033
- Figure 20: North America Smart Home Fitness/Gym Equipment Market Volume (K Units), by Distribution Channel 2025 & 2033
- Figure 21: North America Smart Home Fitness/Gym Equipment Market Revenue Share (%), by Distribution Channel 2025 & 2033
- Figure 22: North America Smart Home Fitness/Gym Equipment Market Volume Share (%), by Distribution Channel 2025 & 2033
- Figure 23: North America Smart Home Fitness/Gym Equipment Market Revenue (Million), by Country 2025 & 2033
- Figure 24: North America Smart Home Fitness/Gym Equipment Market Volume (K Units), by Country 2025 & 2033
- Figure 25: North America Smart Home Fitness/Gym Equipment Market Revenue Share (%), by Country 2025 & 2033
- Figure 26: North America Smart Home Fitness/Gym Equipment Market Volume Share (%), by Country 2025 & 2033
- Figure 27: Europe Smart Home Fitness/Gym Equipment Market Revenue (Million), by Product Type 2025 & 2033
- Figure 28: Europe Smart Home Fitness/Gym Equipment Market Volume (K Units), by Product Type 2025 & 2033
- Figure 29: Europe Smart Home Fitness/Gym Equipment Market Revenue Share (%), by Product Type 2025 & 2033
- Figure 30: Europe Smart Home Fitness/Gym Equipment Market Volume Share (%), by Product Type 2025 & 2033
- Figure 31: Europe Smart Home Fitness/Gym Equipment Market Revenue (Million), by Distribution Channel 2025 & 2033
- Figure 32: Europe Smart Home Fitness/Gym Equipment Market Volume (K Units), by Distribution Channel 2025 & 2033
- Figure 33: Europe Smart Home Fitness/Gym Equipment Market Revenue Share (%), by Distribution Channel 2025 & 2033
- Figure 34: Europe Smart Home Fitness/Gym Equipment Market Volume Share (%), by Distribution Channel 2025 & 2033
- Figure 35: Europe Smart Home Fitness/Gym Equipment Market Revenue (Million), by Country 2025 & 2033
- Figure 36: Europe Smart Home Fitness/Gym Equipment Market Volume (K Units), by Country 2025 & 2033
- Figure 37: Europe Smart Home Fitness/Gym Equipment Market Revenue Share (%), by Country 2025 & 2033
- Figure 38: Europe Smart Home Fitness/Gym Equipment Market Volume Share (%), by Country 2025 & 2033
- Figure 39: South America Smart Home Fitness/Gym Equipment Market Revenue (Million), by Product Type 2025 & 2033
- Figure 40: South America Smart Home Fitness/Gym Equipment Market Volume (K Units), by Product Type 2025 & 2033
- Figure 41: South America Smart Home Fitness/Gym Equipment Market Revenue Share (%), by Product Type 2025 & 2033
- Figure 42: South America Smart Home Fitness/Gym Equipment Market Volume Share (%), by Product Type 2025 & 2033
- Figure 43: South America Smart Home Fitness/Gym Equipment Market Revenue (Million), by Distribution Channel 2025 & 2033
- Figure 44: South America Smart Home Fitness/Gym Equipment Market Volume (K Units), by Distribution Channel 2025 & 2033
- Figure 45: South America Smart Home Fitness/Gym Equipment Market Revenue Share (%), by Distribution Channel 2025 & 2033
- Figure 46: South America Smart Home Fitness/Gym Equipment Market Volume Share (%), by Distribution Channel 2025 & 2033
- Figure 47: South America Smart Home Fitness/Gym Equipment Market Revenue (Million), by Country 2025 & 2033
- Figure 48: South America Smart Home Fitness/Gym Equipment Market Volume (K Units), by Country 2025 & 2033
- Figure 49: South America Smart Home Fitness/Gym Equipment Market Revenue Share (%), by Country 2025 & 2033
- Figure 50: South America Smart Home Fitness/Gym Equipment Market Volume Share (%), by Country 2025 & 2033
- Figure 51: Middle East and Africa Smart Home Fitness/Gym Equipment Market Revenue (Million), by Product Type 2025 & 2033
- Figure 52: Middle East and Africa Smart Home Fitness/Gym Equipment Market Volume (K Units), by Product Type 2025 & 2033
- Figure 53: Middle East and Africa Smart Home Fitness/Gym Equipment Market Revenue Share (%), by Product Type 2025 & 2033
- Figure 54: Middle East and Africa Smart Home Fitness/Gym Equipment Market Volume Share (%), by Product Type 2025 & 2033
- Figure 55: Middle East and Africa Smart Home Fitness/Gym Equipment Market Revenue (Million), by Distribution Channel 2025 & 2033
- Figure 56: Middle East and Africa Smart Home Fitness/Gym Equipment Market Volume (K Units), by Distribution Channel 2025 & 2033
- Figure 57: Middle East and Africa Smart Home Fitness/Gym Equipment Market Revenue Share (%), by Distribution Channel 2025 & 2033
- Figure 58: Middle East and Africa Smart Home Fitness/Gym Equipment Market Volume Share (%), by Distribution Channel 2025 & 2033
- Figure 59: Middle East and Africa Smart Home Fitness/Gym Equipment Market Revenue (Million), by Country 2025 & 2033
- Figure 60: Middle East and Africa Smart Home Fitness/Gym Equipment Market Volume (K Units), by Country 2025 & 2033
- Figure 61: Middle East and Africa Smart Home Fitness/Gym Equipment Market Revenue Share (%), by Country 2025 & 2033
- Figure 62: Middle East and Africa Smart Home Fitness/Gym Equipment Market Volume Share (%), by Country 2025 & 2033
List of Tables
- Table 1: Global Smart Home Fitness/Gym Equipment Market Revenue Million Forecast, by Product Type 2020 & 2033
- Table 2: Global Smart Home Fitness/Gym Equipment Market Volume K Units Forecast, by Product Type 2020 & 2033
- Table 3: Global Smart Home Fitness/Gym Equipment Market Revenue Million Forecast, by Distribution Channel 2020 & 2033
- Table 4: Global Smart Home Fitness/Gym Equipment Market Volume K Units Forecast, by Distribution Channel 2020 & 2033
- Table 5: Global Smart Home Fitness/Gym Equipment Market Revenue Million Forecast, by Region 2020 & 2033
- Table 6: Global Smart Home Fitness/Gym Equipment Market Volume K Units Forecast, by Region 2020 & 2033
- Table 7: Global Smart Home Fitness/Gym Equipment Market Revenue Million Forecast, by Product Type 2020 & 2033
- Table 8: Global Smart Home Fitness/Gym Equipment Market Volume K Units Forecast, by Product Type 2020 & 2033
- Table 9: Global Smart Home Fitness/Gym Equipment Market Revenue Million Forecast, by Distribution Channel 2020 & 2033
- Table 10: Global Smart Home Fitness/Gym Equipment Market Volume K Units Forecast, by Distribution Channel 2020 & 2033
- Table 11: Global Smart Home Fitness/Gym Equipment Market Revenue Million Forecast, by Country 2020 & 2033
- Table 12: Global Smart Home Fitness/Gym Equipment Market Volume K Units Forecast, by Country 2020 & 2033
- Table 13: India Smart Home Fitness/Gym Equipment Market Revenue (Million) Forecast, by Application 2020 & 2033
- Table 14: India Smart Home Fitness/Gym Equipment Market Volume (K Units) Forecast, by Application 2020 & 2033
- Table 15: China Smart Home Fitness/Gym Equipment Market Revenue (Million) Forecast, by Application 2020 & 2033
- Table 16: China Smart Home Fitness/Gym Equipment Market Volume (K Units) Forecast, by Application 2020 & 2033
- Table 17: Japan Smart Home Fitness/Gym Equipment Market Revenue (Million) Forecast, by Application 2020 & 2033
- Table 18: Japan Smart Home Fitness/Gym Equipment Market Volume (K Units) Forecast, by Application 2020 & 2033
- Table 19: Australia Smart Home Fitness/Gym Equipment Market Revenue (Million) Forecast, by Application 2020 & 2033
- Table 20: Australia Smart Home Fitness/Gym Equipment Market Volume (K Units) Forecast, by Application 2020 & 2033
- Table 21: Rest of Asia Pacific Smart Home Fitness/Gym Equipment Market Revenue (Million) Forecast, by Application 2020 & 2033
- Table 22: Rest of Asia Pacific Smart Home Fitness/Gym Equipment Market Volume (K Units) Forecast, by Application 2020 & 2033
- Table 23: Global Smart Home Fitness/Gym Equipment Market Revenue Million Forecast, by Product Type 2020 & 2033
- Table 24: Global Smart Home Fitness/Gym Equipment Market Volume K Units Forecast, by Product Type 2020 & 2033
- Table 25: Global Smart Home Fitness/Gym Equipment Market Revenue Million Forecast, by Distribution Channel 2020 & 2033
- Table 26: Global Smart Home Fitness/Gym Equipment Market Volume K Units Forecast, by Distribution Channel 2020 & 2033
- Table 27: Global Smart Home Fitness/Gym Equipment Market Revenue Million Forecast, by Country 2020 & 2033
- Table 28: Global Smart Home Fitness/Gym Equipment Market Volume K Units Forecast, by Country 2020 & 2033
- Table 29: United States Smart Home Fitness/Gym Equipment Market Revenue (Million) Forecast, by Application 2020 & 2033
- Table 30: United States Smart Home Fitness/Gym Equipment Market Volume (K Units) Forecast, by Application 2020 & 2033
- Table 31: Mexico Smart Home Fitness/Gym Equipment Market Revenue (Million) Forecast, by Application 2020 & 2033
- Table 32: Mexico Smart Home Fitness/Gym Equipment Market Volume (K Units) Forecast, by Application 2020 & 2033
- Table 33: Rest of North America Smart Home Fitness/Gym Equipment Market Revenue (Million) Forecast, by Application 2020 & 2033
- Table 34: Rest of North America Smart Home Fitness/Gym Equipment Market Volume (K Units) Forecast, by Application 2020 & 2033
- Table 35: Global Smart Home Fitness/Gym Equipment Market Revenue Million Forecast, by Product Type 2020 & 2033
- Table 36: Global Smart Home Fitness/Gym Equipment Market Volume K Units Forecast, by Product Type 2020 & 2033
- Table 37: Global Smart Home Fitness/Gym Equipment Market Revenue Million Forecast, by Distribution Channel 2020 & 2033
- Table 38: Global Smart Home Fitness/Gym Equipment Market Volume K Units Forecast, by Distribution Channel 2020 & 2033
- Table 39: Global Smart Home Fitness/Gym Equipment Market Revenue Million Forecast, by Country 2020 & 2033
- Table 40: Global Smart Home Fitness/Gym Equipment Market Volume K Units Forecast, by Country 2020 & 2033
- Table 41: Germany Smart Home Fitness/Gym Equipment Market Revenue (Million) Forecast, by Application 2020 & 2033
- Table 42: Germany Smart Home Fitness/Gym Equipment Market Volume (K Units) Forecast, by Application 2020 & 2033
- Table 43: United Kingdom Smart Home Fitness/Gym Equipment Market Revenue (Million) Forecast, by Application 2020 & 2033
- Table 44: United Kingdom Smart Home Fitness/Gym Equipment Market Volume (K Units) Forecast, by Application 2020 & 2033
- Table 45: France Smart Home Fitness/Gym Equipment Market Revenue (Million) Forecast, by Application 2020 & 2033
- Table 46: France Smart Home Fitness/Gym Equipment Market Volume (K Units) Forecast, by Application 2020 & 2033
- Table 47: Russia Smart Home Fitness/Gym Equipment Market Revenue (Million) Forecast, by Application 2020 & 2033
- Table 48: Russia Smart Home Fitness/Gym Equipment Market Volume (K Units) Forecast, by Application 2020 & 2033
- Table 49: Rest of Europe Smart Home Fitness/Gym Equipment Market Revenue (Million) Forecast, by Application 2020 & 2033
- Table 50: Rest of Europe Smart Home Fitness/Gym Equipment Market Volume (K Units) Forecast, by Application 2020 & 2033
- Table 51: Global Smart Home Fitness/Gym Equipment Market Revenue Million Forecast, by Product Type 2020 & 2033
- Table 52: Global Smart Home Fitness/Gym Equipment Market Volume K Units Forecast, by Product Type 2020 & 2033
- Table 53: Global Smart Home Fitness/Gym Equipment Market Revenue Million Forecast, by Distribution Channel 2020 & 2033
- Table 54: Global Smart Home Fitness/Gym Equipment Market Volume K Units Forecast, by Distribution Channel 2020 & 2033
- Table 55: Global Smart Home Fitness/Gym Equipment Market Revenue Million Forecast, by Country 2020 & 2033
- Table 56: Global Smart Home Fitness/Gym Equipment Market Volume K Units Forecast, by Country 2020 & 2033
- Table 57: Brazil Smart Home Fitness/Gym Equipment Market Revenue (Million) Forecast, by Application 2020 & 2033
- Table 58: Brazil Smart Home Fitness/Gym Equipment Market Volume (K Units) Forecast, by Application 2020 & 2033
- Table 59: Argentina Smart Home Fitness/Gym Equipment Market Revenue (Million) Forecast, by Application 2020 & 2033
- Table 60: Argentina Smart Home Fitness/Gym Equipment Market Volume (K Units) Forecast, by Application 2020 & 2033
- Table 61: Rest of South America Smart Home Fitness/Gym Equipment Market Revenue (Million) Forecast, by Application 2020 & 2033
- Table 62: Rest of South America Smart Home Fitness/Gym Equipment Market Volume (K Units) Forecast, by Application 2020 & 2033
- Table 63: Global Smart Home Fitness/Gym Equipment Market Revenue Million Forecast, by Product Type 2020 & 2033
- Table 64: Global Smart Home Fitness/Gym Equipment Market Volume K Units Forecast, by Product Type 2020 & 2033
- Table 65: Global Smart Home Fitness/Gym Equipment Market Revenue Million Forecast, by Distribution Channel 2020 & 2033
- Table 66: Global Smart Home Fitness/Gym Equipment Market Volume K Units Forecast, by Distribution Channel 2020 & 2033
- Table 67: Global Smart Home Fitness/Gym Equipment Market Revenue Million Forecast, by Country 2020 & 2033
- Table 68: Global Smart Home Fitness/Gym Equipment Market Volume K Units Forecast, by Country 2020 & 2033
- Table 69: United Arab Emirates Smart Home Fitness/Gym Equipment Market Revenue (Million) Forecast, by Application 2020 & 2033
- Table 70: United Arab Emirates Smart Home Fitness/Gym Equipment Market Volume (K Units) Forecast, by Application 2020 & 2033
- Table 71: South Africa Smart Home Fitness/Gym Equipment Market Revenue (Million) Forecast, by Application 2020 & 2033
- Table 72: South Africa Smart Home Fitness/Gym Equipment Market Volume (K Units) Forecast, by Application 2020 & 2033
- Table 73: Rest of Middle East and Africa Smart Home Fitness/Gym Equipment Market Revenue (Million) Forecast, by Application 2020 & 2033
- Table 74: Rest of Middle East and Africa Smart Home Fitness/Gym Equipment Market Volume (K Units) Forecast, by Application 2020 & 2033
Frequently Asked Questions
1. What is the projected Compound Annual Growth Rate (CAGR) of the Smart Home Fitness/Gym Equipment Market?
The projected CAGR is approximately 5.13%.
2. Which companies are prominent players in the Smart Home Fitness/Gym Equipment Market?
Key companies in the market include Peloton, TRUE Fitness Technology Inc, Nautilus Inc, JTX Fitness, Core Health and Fitness LLC, Precor Inc, Tonal System Inc, Technogym, ICON Health & Fitness Inc, Life Fitness Inc.
3. What are the main segments of the Smart Home Fitness/Gym Equipment Market?
The market segments include Product Type, Distribution Channel.
4. Can you provide details about the market size?
The market size is estimated to be USD 2.5 Million as of 2022.
5. What are some drivers contributing to market growth?
Transforming Workouts with Ultimate Convenience for Busy Lifestyles; Increasing Awareness and Prioritization of Health.
6. What are the notable trends driving market growth?
Cardiovascular Training Equipment is Expected to Grow at a Faster Rate during the Forecast Period.
7. Are there any restraints impacting market growth?
High Product Cost Restrains Market Growth; Limited Space in Homes.
8. Can you provide examples of recent developments in the market?
October 2023: Lululemon entered a five-year partnership with connected fitness specialist Peloton, signing a content, apparel, and community initiative deal. As a result, Lululemon decided to discontinue its mirror-connected fitness service.
9. What pricing options are available for accessing the report?
Pricing options include single-user, multi-user, and enterprise licenses priced at USD 4750, USD 5250, and USD 8750 respectively.
10. Is the market size provided in terms of value or volume?
The market size is provided in terms of value, measured in Million and volume, measured in K Units.
11. Are there any specific market keywords associated with the report?
Yes, the market keyword associated with the report is "Smart Home Fitness/Gym Equipment Market," which aids in identifying and referencing the specific market segment covered.
12. How do I determine which pricing option suits my needs best?
The pricing options vary based on user requirements and access needs. Individual users may opt for single-user licenses, while businesses requiring broader access may choose multi-user or enterprise licenses for cost-effective access to the report.
13. Are there any additional resources or data provided in the Smart Home Fitness/Gym Equipment Market report?
While the report offers comprehensive insights, it's advisable to review the specific contents or supplementary materials provided to ascertain if additional resources or data are available.
14. How can I stay updated on further developments or reports in the Smart Home Fitness/Gym Equipment Market?
To stay informed about further developments, trends, and reports in the Smart Home Fitness/Gym Equipment Market, consider subscribing to industry newsletters, following relevant companies and organizations, or regularly checking reputable industry news sources and publications.
Methodology
Step 1 - Identification of Relevant Samples Size from Population Database


Step 2 - Approaches for Defining Global Market Size (Value, Volume* & Price*)

Note*: In applicable scenarios
Step 3 - Data Sources
Primary Research
- Web Analytics
- Survey Reports
- Research Institute
- Latest Research Reports
- Opinion Leaders
Secondary Research
- Annual Reports
- White Paper
- Latest Press Release
- Industry Association
- Paid Database
- Investor Presentations

Step 4 - Data Triangulation
Involves using different sources of information in order to increase the validity of a study
These sources are likely to be stakeholders in a program - participants, other researchers, program staff, other community members, and so on.
Then we put all data in single framework & apply various statistical tools to find out the dynamic on the market.
During the analysis stage, feedback from the stakeholder groups would be compared to determine areas of agreement as well as areas of divergence

