

Key Insights
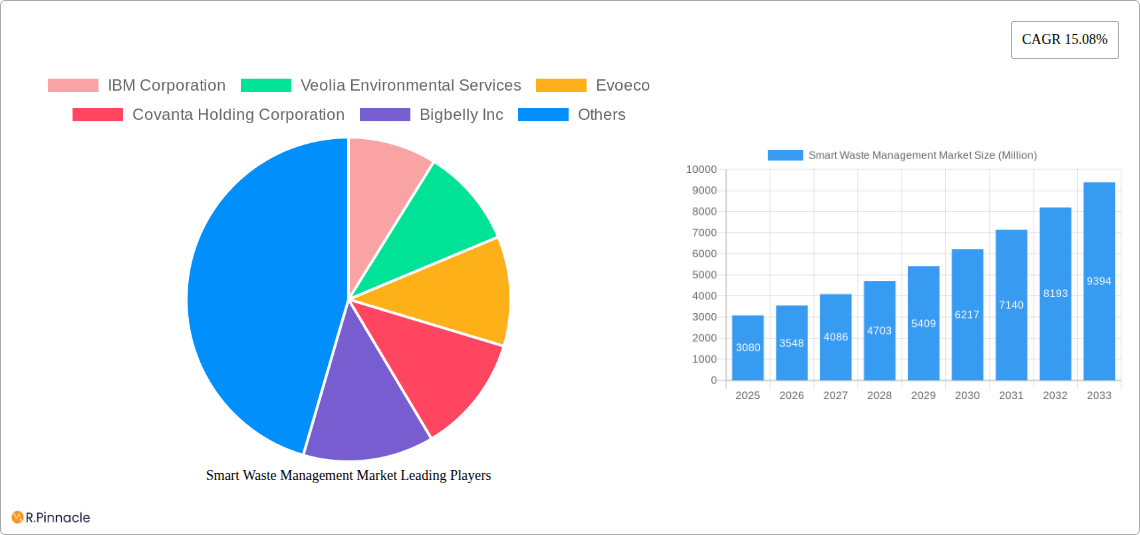
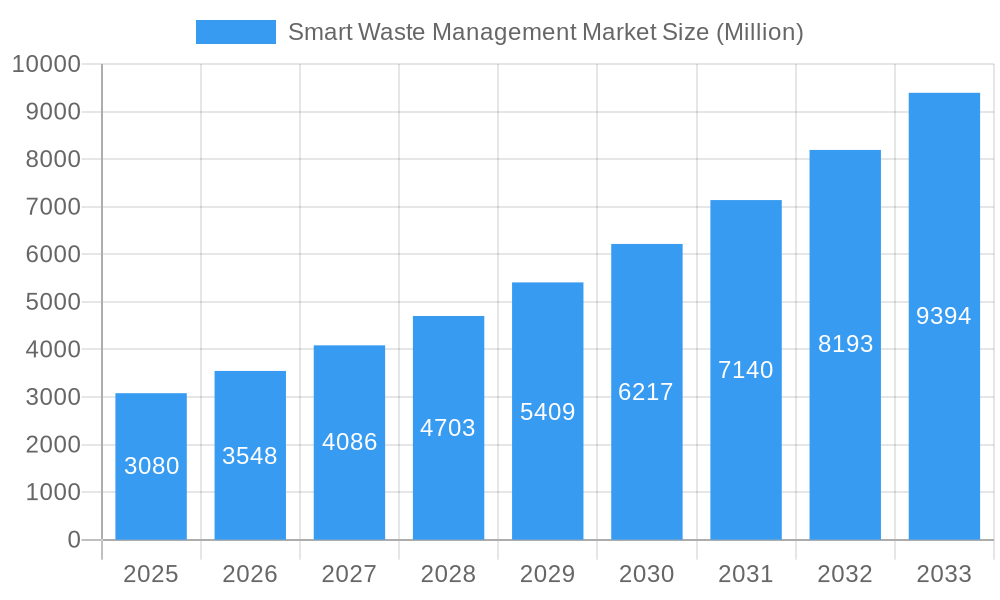
The smart waste management market, valued at $3.08 billion in 2025, is experiencing robust growth, projected to expand at a Compound Annual Growth Rate (CAGR) of 15.08% from 2025 to 2033. This surge is driven by increasing urbanization leading to escalating waste generation, stricter environmental regulations demanding efficient waste management solutions, and the rising adoption of smart city initiatives globally. Technological advancements like IoT sensors, AI-powered analytics, and sophisticated fleet management systems are key enablers, optimizing waste collection routes, reducing operational costs, and improving overall efficiency. The market is segmented by solution (fleet management, remote monitoring, analytics) and waste type (industrial, residential), with fleet management currently dominating due to its tangible cost-saving benefits. North America and Europe are currently leading the market, driven by early adoption of smart technologies and strong regulatory frameworks. However, Asia-Pacific is expected to witness significant growth in the coming years, fueled by rapid urbanization and increasing government investments in sustainable waste management infrastructure. The competitive landscape is comprised of established players like IBM and Veolia, alongside innovative technology providers like Enevo and Bigbelly.
Smart Waste Management Market Market Size (In Billion)
The continued expansion of the smart waste management market hinges on several factors. Firstly, the increasing availability of affordable and reliable sensor technologies will further accelerate adoption across various regions. Secondly, the growing focus on data-driven decision-making within municipalities will fuel demand for advanced analytics solutions. Thirdly, successful public-private partnerships will be crucial in fostering market growth by bridging the gap between technological innovation and practical implementation. However, challenges remain, including the high initial investment costs associated with smart waste management systems and the need for robust cybersecurity measures to protect sensitive data collected by these systems. Furthermore, ensuring seamless integration with existing waste management infrastructure will be critical for widespread adoption.
Smart Waste Management Market Company Market Share
Smart Waste Management Market: A Comprehensive Report (2019-2033)
This in-depth report provides a comprehensive analysis of the Smart Waste Management Market, offering actionable insights for industry professionals, investors, and strategic decision-makers. Covering the period 2019-2033, with a base year of 2025 and a forecast period of 2025-2033, this report leverages rigorous data analysis to illuminate market trends, growth drivers, and emerging opportunities. The global market is projected to reach xx Million by 2033, exhibiting a significant CAGR.
Smart Waste Management Market Structure & Innovation Trends
This section delves into the competitive landscape of the Smart Waste Management Market, analyzing market concentration, innovation drivers, regulatory frameworks, and M&A activities. Key aspects include:
Market Concentration: The market exhibits a moderately concentrated structure, with key players such as IBM Corporation, Veolia Environmental Services, and Waste Management Inc. holding significant market share. Precise figures on market share are detailed within the report. However, the market also features several smaller, specialized players focusing on niche segments.
Innovation Drivers: Technological advancements, such as AI-powered waste sorting and predictive analytics, are driving significant innovation. Stringent environmental regulations and the growing need for sustainable waste management solutions are also key catalysts.
Regulatory Frameworks: Government initiatives promoting smart cities and sustainable waste management practices are shaping market growth. Variations in regulations across different geographies influence market dynamics and adoption rates.
Product Substitutes: Traditional waste management methods pose some competition, but the superior efficiency and data-driven insights of smart waste management solutions are driving market shift.
End-User Demographics: The market caters to diverse end-users, including municipalities, industrial facilities, and residential communities. The report provides a detailed breakdown of each segment's contribution.
M&A Activities: The report tracks significant M&A activities in the market, including deal values and their impact on market consolidation. Examples include (but are not limited to) the integration of smaller specialized companies by larger players to enhance their service offerings and expand their reach. The total value of M&A deals recorded during the historical period (2019-2024) is estimated at xx Million.
Smart Waste Management Market Dynamics & Trends
This section analyzes the key dynamics influencing market growth, including:
Market growth is primarily driven by increasing urbanization, rising environmental concerns, and the need for optimized waste management practices. Technological advancements, such as the integration of IoT sensors, AI algorithms, and advanced analytics, are revolutionizing waste management processes, leading to improved efficiency and reduced environmental impact. Consumer preferences are shifting toward sustainable and eco-friendly solutions, further driving market demand. The competitive landscape is characterized by both established players and emerging companies, resulting in intense competition and continuous innovation. The market is segmented by solution (fleet management, remote monitoring, analytics) and waste type (industrial, residential). The report details the CAGR for each segment and explores the market penetration rate for smart waste management solutions in various regions.
Dominant Regions & Segments in Smart Waste Management Market
This section identifies the leading regions and segments within the Smart Waste Management Market.
Leading Region: North America currently holds the largest market share, driven by technological advancements, stringent environmental regulations, and significant investments in smart city initiatives. Europe is also witnessing significant growth.
Leading Segments:
- Solution: The remote monitoring segment is experiencing rapid growth due to its ability to provide real-time data on waste levels, optimize collection routes, and reduce operational costs.
- Waste Type: The industrial waste segment holds a larger market share due to the high volume of waste generated and the stringent regulatory requirements for its management. However, the residential waste management segment is also witnessing considerable growth, driven by increasing urbanization and growing awareness of sustainable waste management practices.
Key drivers for dominance in specific regions include favorable economic policies, robust infrastructure, and government support for smart city initiatives. The report provides a detailed analysis of each region's and segment's market size and growth potential.
Smart Waste Management Market Product Innovations
Recent product innovations focus on enhancing data analytics capabilities, improving sensor technologies, and developing integrated software solutions for efficient waste management. These innovations offer significant advantages in terms of cost optimization, waste reduction, and environmental sustainability. The market is witnessing a trend towards the integration of AI and machine learning for predictive maintenance, route optimization, and real-time waste level monitoring. This integration is enhancing operational efficiency and optimizing resource allocation.
Report Scope & Segmentation Analysis
The report provides a comprehensive segmentation of the Smart Waste Management Market based on solution (Fleet Management, Remote Monitoring, Analytics) and waste type (Industrial Waste, Residential Waste). Each segment's growth projections, market size, and competitive dynamics are analyzed in detail. The report offers detailed insights into individual segments, including market size estimates, growth projections, and key competitive dynamics for each. For instance, the Fleet Management segment shows a projected market value of xx Million by 2033 while Remote Monitoring shows xx Million, with similar detail provided for all segments listed.
Key Drivers of Smart Waste Management Market Growth
Key growth drivers include:
- Technological advancements: IoT, AI, and data analytics improve efficiency and resource allocation.
- Stringent environmental regulations: Governments worldwide are pushing for sustainable waste management.
- Increasing urbanization: Growing populations in urban areas increase waste generation and the need for effective solutions.
- Rising environmental awareness: Consumers are increasingly demanding eco-friendly solutions.
These factors are collectively driving significant investment and innovation in the smart waste management sector.
Challenges in the Smart Waste Management Market Sector
Challenges include:
- High initial investment costs: Implementing smart waste management systems requires significant upfront investment.
- Data security concerns: Managing sensitive data necessitates robust cybersecurity measures.
- Interoperability issues: Integrating different systems and technologies can be challenging.
- Lack of awareness and education: Promoting adoption requires public awareness campaigns.
Emerging Opportunities in Smart Waste Management Market
Emerging opportunities include:
- Expansion into developing economies: Untapped potential exists in countries with rapidly growing urban populations.
- Development of advanced analytics solutions: AI-driven insights can further optimize resource allocation and reduce operational costs.
- Integration of renewable energy sources: Sustainable waste management solutions can be coupled with renewable energy generation.
Leading Players in the Smart Waste Management Market Market
- IBM Corporation
- Veolia Environmental Services
- Evoeco
- Covanta Holding Corporation
- Bigbelly Inc
- Waste Management Inc
- Enevo
- Pepperl+Fuchs GmbH
- BIN-
- SAP SE
Key Developments in Smart Waste Management Market Industry
- July 2023: Waste Management Inc. (WM) commenced operations at its new USD 35 Million renewable natural gas plant in Texas, boosting renewable energy production and showcasing investment in sustainable waste management infrastructure.
- June 2023: The Indian government's support for the CITIIS 2.0 project underscores the global focus on sustainable urban development and smart waste management solutions. This initiative will influence market growth in India significantly.
Future Outlook for Smart Waste Management Market Market
The Smart Waste Management Market is poised for significant growth, driven by technological innovations, increasing environmental awareness, and supportive government policies. Strategic partnerships, mergers and acquisitions, and expansion into new markets are expected to further accelerate market growth and create new opportunities for industry players. The focus on sustainable and eco-friendly solutions will continue to be a major trend, shaping the future direction of the market.
Smart Waste Management Market Segmentation
-
1. Solution
- 1.1. Fleet Management
- 1.2. Remote Monitoring
- 1.3. Analytics
-
2. Waste Type
- 2.1. Industrial Waste
- 2.2. Residential Waste
Smart Waste Management Market Segmentation By Geography
-
1. North America
- 1.1. United States
- 1.2. Canada
-
2. Europe
- 2.1. Germany
- 2.2. United Kingdom
- 2.3. France
- 2.4. Spain
- 2.5. Italy
-
3. Asia
- 3.1. India
- 3.2. China
- 3.3. Australia
- 3.4. Japan
- 3.5. Australia and New Zealand
- 4. Latin America
- 5. Middle East and Africa
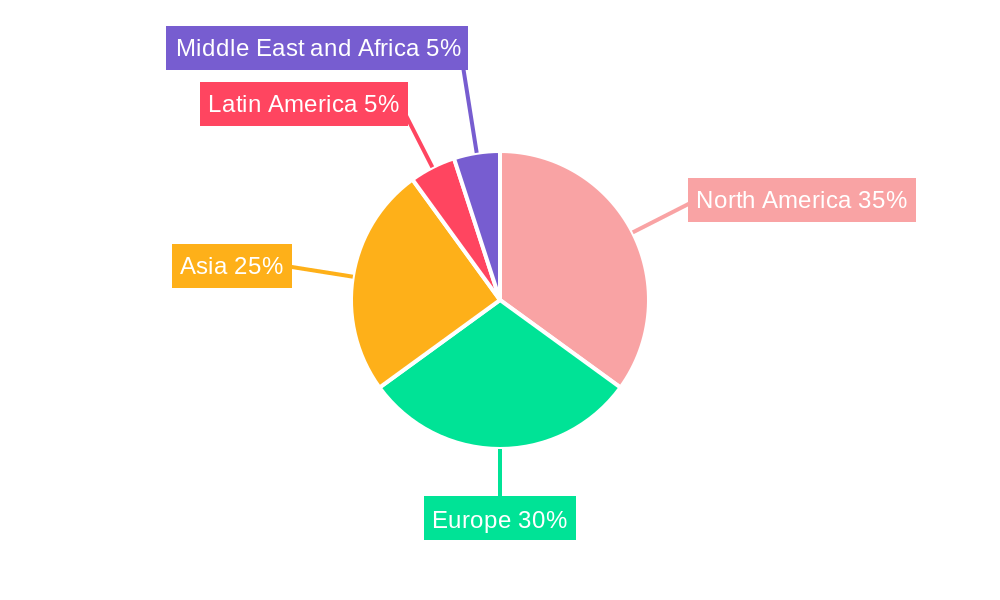
Smart Waste Management Market Regional Market Share
Geographic Coverage of Smart Waste Management Market
Smart Waste Management Market REPORT HIGHLIGHTS
| Aspects | Details |
|---|---|
| Study Period | 2020-2034 |
| Base Year | 2025 |
| Estimated Year | 2026 |
| Forecast Period | 2026-2034 |
| Historical Period | 2020-2025 |
| Growth Rate | CAGR of 15.08% from 2020-2034 |
| Segmentation |
|
Table of Contents
- 1. Introduction
- 1.1. Research Scope
- 1.2. Market Segmentation
- 1.3. Research Objective
- 1.4. Definitions and Assumptions
- 2. Executive Summary
- 2.1. Market Snapshot
- 3. Market Dynamics
- 3.1. Market Drivers
- 3.2. Market Restrains
- 3.3. Market Trends
- 3.4. Market Opportunities
- 4. Market Factor Analysis
- 4.1. Porters Five Forces
- 4.1.1. Bargaining Power of Suppliers
- 4.1.2. Bargaining Power of Buyers
- 4.1.3. Threat of New Entrants
- 4.1.4. Threat of Substitutes
- 4.1.5. Competitive Rivalry
- 4.2. PESTEL analysis
- 4.3. BCG Analysis
- 4.3.1. Stars (High Growth, High Market Share)
- 4.3.2. Cash Cows (Low Growth, High Market Share)
- 4.3.3. Question Mark (High Growth, Low Market Share)
- 4.3.4. Dogs (Low Growth, Low Market Share)
- 4.4. Ansoff Matrix Analysis
- 4.5. Supply Chain Analysis
- 4.6. Regulatory Landscape
- 4.7. Current Market Potential and Opportunity Assessment (TAM–SAM–SOM Framework)
- 4.8. PRI Analyst Note
- 4.1. Porters Five Forces
- 5. Market Analysis, Insights and Forecast 2021-2033
- 5.1. Market Analysis, Insights and Forecast - by Solution
- 5.1.1. Fleet Management
- 5.1.2. Remote Monitoring
- 5.1.3. Analytics
- 5.2. Market Analysis, Insights and Forecast - by Waste Type
- 5.2.1. Industrial Waste
- 5.2.2. Residential Waste
- 5.3. Market Analysis, Insights and Forecast - by Region
- 5.3.1. North America
- 5.3.2. Europe
- 5.3.3. Asia
- 5.3.4. Latin America
- 5.3.5. Middle East and Africa
- 5.1. Market Analysis, Insights and Forecast - by Solution
- 6. Global Smart Waste Management Market Analysis, Insights and Forecast, 2021-2033
- 6.1. Market Analysis, Insights and Forecast - by Solution
- 6.1.1. Fleet Management
- 6.1.2. Remote Monitoring
- 6.1.3. Analytics
- 6.2. Market Analysis, Insights and Forecast - by Waste Type
- 6.2.1. Industrial Waste
- 6.2.2. Residential Waste
- 6.1. Market Analysis, Insights and Forecast - by Solution
- 7. North America Smart Waste Management Market Analysis, Insights and Forecast, 2020-2032
- 7.1. Market Analysis, Insights and Forecast - by Solution
- 7.1.1. Fleet Management
- 7.1.2. Remote Monitoring
- 7.1.3. Analytics
- 7.2. Market Analysis, Insights and Forecast - by Waste Type
- 7.2.1. Industrial Waste
- 7.2.2. Residential Waste
- 7.1. Market Analysis, Insights and Forecast - by Solution
- 8. Europe Smart Waste Management Market Analysis, Insights and Forecast, 2020-2032
- 8.1. Market Analysis, Insights and Forecast - by Solution
- 8.1.1. Fleet Management
- 8.1.2. Remote Monitoring
- 8.1.3. Analytics
- 8.2. Market Analysis, Insights and Forecast - by Waste Type
- 8.2.1. Industrial Waste
- 8.2.2. Residential Waste
- 8.1. Market Analysis, Insights and Forecast - by Solution
- 9. Asia Smart Waste Management Market Analysis, Insights and Forecast, 2020-2032
- 9.1. Market Analysis, Insights and Forecast - by Solution
- 9.1.1. Fleet Management
- 9.1.2. Remote Monitoring
- 9.1.3. Analytics
- 9.2. Market Analysis, Insights and Forecast - by Waste Type
- 9.2.1. Industrial Waste
- 9.2.2. Residential Waste
- 9.1. Market Analysis, Insights and Forecast - by Solution
- 10. Latin America Smart Waste Management Market Analysis, Insights and Forecast, 2020-2032
- 10.1. Market Analysis, Insights and Forecast - by Solution
- 10.1.1. Fleet Management
- 10.1.2. Remote Monitoring
- 10.1.3. Analytics
- 10.2. Market Analysis, Insights and Forecast - by Waste Type
- 10.2.1. Industrial Waste
- 10.2.2. Residential Waste
- 10.1. Market Analysis, Insights and Forecast - by Solution
- 11. Middle East and Africa Smart Waste Management Market Analysis, Insights and Forecast, 2020-2032
- 11.1. Market Analysis, Insights and Forecast - by Solution
- 11.1.1. Fleet Management
- 11.1.2. Remote Monitoring
- 11.1.3. Analytics
- 11.2. Market Analysis, Insights and Forecast - by Waste Type
- 11.2.1. Industrial Waste
- 11.2.2. Residential Waste
- 11.1. Market Analysis, Insights and Forecast - by Solution
- 12. Competitive Analysis
- 12.1. Company Profiles
- 12.1.1 IBM Corporation
- 12.1.1.1. Company Overview
- 12.1.1.2. Products
- 12.1.1.3. Company Financials
- 12.1.1.4. SWOT Analysis
- 12.1.2 Veolia Environmental Services
- 12.1.2.1. Company Overview
- 12.1.2.2. Products
- 12.1.2.3. Company Financials
- 12.1.2.4. SWOT Analysis
- 12.1.3 Evoeco
- 12.1.3.1. Company Overview
- 12.1.3.2. Products
- 12.1.3.3. Company Financials
- 12.1.3.4. SWOT Analysis
- 12.1.4 Covanta Holding Corporation
- 12.1.4.1. Company Overview
- 12.1.4.2. Products
- 12.1.4.3. Company Financials
- 12.1.4.4. SWOT Analysis
- 12.1.5 Bigbelly Inc
- 12.1.5.1. Company Overview
- 12.1.5.2. Products
- 12.1.5.3. Company Financials
- 12.1.5.4. SWOT Analysis
- 12.1.6 Waste Management Inc
- 12.1.6.1. Company Overview
- 12.1.6.2. Products
- 12.1.6.3. Company Financials
- 12.1.6.4. SWOT Analysis
- 12.1.7 Enevo
- 12.1.7.1. Company Overview
- 12.1.7.2. Products
- 12.1.7.3. Company Financials
- 12.1.7.4. SWOT Analysis
- 12.1.8 Pepperl+Fuchs GmbH
- 12.1.8.1. Company Overview
- 12.1.8.2. Products
- 12.1.8.3. Company Financials
- 12.1.8.4. SWOT Analysis
- 12.1.9 BIN-
- 12.1.9.1. Company Overview
- 12.1.9.2. Products
- 12.1.9.3. Company Financials
- 12.1.9.4. SWOT Analysis
- 12.1.10 SAP SE
- 12.1.10.1. Company Overview
- 12.1.10.2. Products
- 12.1.10.3. Company Financials
- 12.1.10.4. SWOT Analysis
- 12.1.1 IBM Corporation
- 12.2. Market Entropy
- 12.2.1 Company's Key Areas Served
- 12.2.2 Recent Developments
- 12.3. Company Market Share Analysis 2025
- 12.3.1 Top 5 Companies Market Share Analysis
- 12.3.2 Top 3 Companies Market Share Analysis
- 12.4. List of Potential Customers
- 13. Research Methodology
List of Figures
- Figure 1: Global Smart Waste Management Market Revenue Breakdown (Million, %) by Region 2025 & 2033
- Figure 2: North America Smart Waste Management Market Revenue (Million), by Solution 2025 & 2033
- Figure 3: North America Smart Waste Management Market Revenue Share (%), by Solution 2025 & 2033
- Figure 4: North America Smart Waste Management Market Revenue (Million), by Waste Type 2025 & 2033
- Figure 5: North America Smart Waste Management Market Revenue Share (%), by Waste Type 2025 & 2033
- Figure 6: North America Smart Waste Management Market Revenue (Million), by Country 2025 & 2033
- Figure 7: North America Smart Waste Management Market Revenue Share (%), by Country 2025 & 2033
- Figure 8: Europe Smart Waste Management Market Revenue (Million), by Solution 2025 & 2033
- Figure 9: Europe Smart Waste Management Market Revenue Share (%), by Solution 2025 & 2033
- Figure 10: Europe Smart Waste Management Market Revenue (Million), by Waste Type 2025 & 2033
- Figure 11: Europe Smart Waste Management Market Revenue Share (%), by Waste Type 2025 & 2033
- Figure 12: Europe Smart Waste Management Market Revenue (Million), by Country 2025 & 2033
- Figure 13: Europe Smart Waste Management Market Revenue Share (%), by Country 2025 & 2033
- Figure 14: Asia Smart Waste Management Market Revenue (Million), by Solution 2025 & 2033
- Figure 15: Asia Smart Waste Management Market Revenue Share (%), by Solution 2025 & 2033
- Figure 16: Asia Smart Waste Management Market Revenue (Million), by Waste Type 2025 & 2033
- Figure 17: Asia Smart Waste Management Market Revenue Share (%), by Waste Type 2025 & 2033
- Figure 18: Asia Smart Waste Management Market Revenue (Million), by Country 2025 & 2033
- Figure 19: Asia Smart Waste Management Market Revenue Share (%), by Country 2025 & 2033
- Figure 20: Latin America Smart Waste Management Market Revenue (Million), by Solution 2025 & 2033
- Figure 21: Latin America Smart Waste Management Market Revenue Share (%), by Solution 2025 & 2033
- Figure 22: Latin America Smart Waste Management Market Revenue (Million), by Waste Type 2025 & 2033
- Figure 23: Latin America Smart Waste Management Market Revenue Share (%), by Waste Type 2025 & 2033
- Figure 24: Latin America Smart Waste Management Market Revenue (Million), by Country 2025 & 2033
- Figure 25: Latin America Smart Waste Management Market Revenue Share (%), by Country 2025 & 2033
- Figure 26: Middle East and Africa Smart Waste Management Market Revenue (Million), by Solution 2025 & 2033
- Figure 27: Middle East and Africa Smart Waste Management Market Revenue Share (%), by Solution 2025 & 2033
- Figure 28: Middle East and Africa Smart Waste Management Market Revenue (Million), by Waste Type 2025 & 2033
- Figure 29: Middle East and Africa Smart Waste Management Market Revenue Share (%), by Waste Type 2025 & 2033
- Figure 30: Middle East and Africa Smart Waste Management Market Revenue (Million), by Country 2025 & 2033
- Figure 31: Middle East and Africa Smart Waste Management Market Revenue Share (%), by Country 2025 & 2033
List of Tables
- Table 1: Global Smart Waste Management Market Revenue Million Forecast, by Solution 2020 & 2033
- Table 2: Global Smart Waste Management Market Revenue Million Forecast, by Waste Type 2020 & 2033
- Table 3: Global Smart Waste Management Market Revenue Million Forecast, by Region 2020 & 2033
- Table 4: Global Smart Waste Management Market Revenue Million Forecast, by Solution 2020 & 2033
- Table 5: Global Smart Waste Management Market Revenue Million Forecast, by Waste Type 2020 & 2033
- Table 6: Global Smart Waste Management Market Revenue Million Forecast, by Country 2020 & 2033
- Table 7: United States Smart Waste Management Market Revenue (Million) Forecast, by Application 2020 & 2033
- Table 8: Canada Smart Waste Management Market Revenue (Million) Forecast, by Application 2020 & 2033
- Table 9: Global Smart Waste Management Market Revenue Million Forecast, by Solution 2020 & 2033
- Table 10: Global Smart Waste Management Market Revenue Million Forecast, by Waste Type 2020 & 2033
- Table 11: Global Smart Waste Management Market Revenue Million Forecast, by Country 2020 & 2033
- Table 12: Germany Smart Waste Management Market Revenue (Million) Forecast, by Application 2020 & 2033
- Table 13: United Kingdom Smart Waste Management Market Revenue (Million) Forecast, by Application 2020 & 2033
- Table 14: France Smart Waste Management Market Revenue (Million) Forecast, by Application 2020 & 2033
- Table 15: Spain Smart Waste Management Market Revenue (Million) Forecast, by Application 2020 & 2033
- Table 16: Italy Smart Waste Management Market Revenue (Million) Forecast, by Application 2020 & 2033
- Table 17: Global Smart Waste Management Market Revenue Million Forecast, by Solution 2020 & 2033
- Table 18: Global Smart Waste Management Market Revenue Million Forecast, by Waste Type 2020 & 2033
- Table 19: Global Smart Waste Management Market Revenue Million Forecast, by Country 2020 & 2033
- Table 20: India Smart Waste Management Market Revenue (Million) Forecast, by Application 2020 & 2033
- Table 21: China Smart Waste Management Market Revenue (Million) Forecast, by Application 2020 & 2033
- Table 22: Australia Smart Waste Management Market Revenue (Million) Forecast, by Application 2020 & 2033
- Table 23: Japan Smart Waste Management Market Revenue (Million) Forecast, by Application 2020 & 2033
- Table 24: Australia and New Zealand Smart Waste Management Market Revenue (Million) Forecast, by Application 2020 & 2033
- Table 25: Global Smart Waste Management Market Revenue Million Forecast, by Solution 2020 & 2033
- Table 26: Global Smart Waste Management Market Revenue Million Forecast, by Waste Type 2020 & 2033
- Table 27: Global Smart Waste Management Market Revenue Million Forecast, by Country 2020 & 2033
- Table 28: Global Smart Waste Management Market Revenue Million Forecast, by Solution 2020 & 2033
- Table 29: Global Smart Waste Management Market Revenue Million Forecast, by Waste Type 2020 & 2033
- Table 30: Global Smart Waste Management Market Revenue Million Forecast, by Country 2020 & 2033
Frequently Asked Questions
1. What is the projected Compound Annual Growth Rate (CAGR) of the Smart Waste Management Market?
The projected CAGR is approximately 15.08%.
2. Which companies are prominent players in the Smart Waste Management Market?
Key companies in the market include IBM Corporation, Veolia Environmental Services, Evoeco, Covanta Holding Corporation, Bigbelly Inc, Waste Management Inc, Enevo, Pepperl+Fuchs GmbH, BIN-, SAP SE.
3. What are the main segments of the Smart Waste Management Market?
The market segments include Solution, Waste Type.
4. Can you provide details about the market size?
The market size is estimated to be USD 3.08 Million as of 2022.
5. What are some drivers contributing to market growth?
Increasing Volumes of Waste to Boost the Market; Rising Adoption of Smart Cities to Flourish the Market.
6. What are the notable trends driving market growth?
Analytics Sector to Witness Major Growth.
7. Are there any restraints impacting market growth?
Cybersecurity Concerns and Data Security Breaches.
8. Can you provide examples of recent developments in the market?
July 2023 - WM began operations at its new USD 35 million, 14,500 square foot renewable natural gas plant located at the Texas-based company’s Eco Vista landfill, the company said in a news release. Construction on the new facility began two years ago, and the company plans to employ 125 construction workers and four workers to manage the facility, which will have a capacity of 14,500 square feet. The company said the new facility is expected to be fully operational by the end of May.
9. What pricing options are available for accessing the report?
Pricing options include single-user, multi-user, and enterprise licenses priced at USD 4750, USD 5250, and USD 8750 respectively.
10. Is the market size provided in terms of value or volume?
The market size is provided in terms of value, measured in Million.
11. Are there any specific market keywords associated with the report?
Yes, the market keyword associated with the report is "Smart Waste Management Market," which aids in identifying and referencing the specific market segment covered.
12. How do I determine which pricing option suits my needs best?
The pricing options vary based on user requirements and access needs. Individual users may opt for single-user licenses, while businesses requiring broader access may choose multi-user or enterprise licenses for cost-effective access to the report.
13. Are there any additional resources or data provided in the Smart Waste Management Market report?
While the report offers comprehensive insights, it's advisable to review the specific contents or supplementary materials provided to ascertain if additional resources or data are available.
14. How can I stay updated on further developments or reports in the Smart Waste Management Market?
To stay informed about further developments, trends, and reports in the Smart Waste Management Market, consider subscribing to industry newsletters, following relevant companies and organizations, or regularly checking reputable industry news sources and publications.
Methodology
Step 1 - Identification of Relevant Samples Size from Population Database


Step 2 - Approaches for Defining Global Market Size (Value, Volume* & Price*)

Note*: In applicable scenarios
Step 3 - Data Sources
Primary Research
- Web Analytics
- Survey Reports
- Research Institute
- Latest Research Reports
- Opinion Leaders
Secondary Research
- Annual Reports
- White Paper
- Latest Press Release
- Industry Association
- Paid Database
- Investor Presentations

Step 4 - Data Triangulation
Involves using different sources of information in order to increase the validity of a study
These sources are likely to be stakeholders in a program - participants, other researchers, program staff, other community members, and so on.
Then we put all data in single framework & apply various statistical tools to find out the dynamic on the market.
During the analysis stage, feedback from the stakeholder groups would be compared to determine areas of agreement as well as areas of divergence