

Key Insights
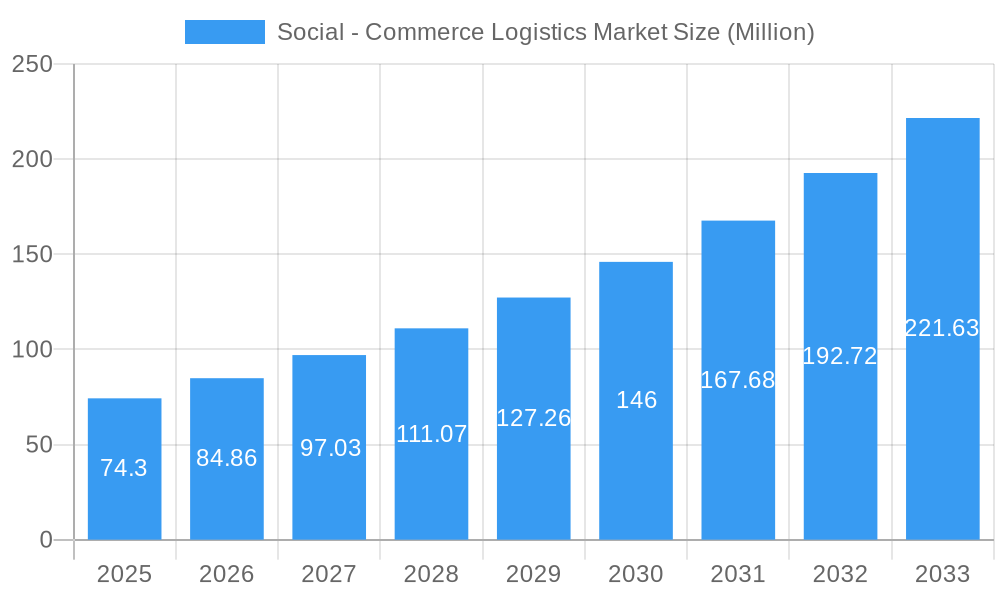
The social commerce logistics market, valued at $74.30 million in 2025, is experiencing robust growth, projected to expand at a compound annual growth rate (CAGR) of 14.31% from 2025 to 2033. This significant expansion is driven by the surging popularity of social commerce platforms, increasing smartphone penetration, and a preference for convenient and reliable delivery options among consumers. Key players like Shiprocket, Delhivery, Ekart, XpressBees, Shadowfax, Ecom Express, Blue Dart, Wow Express, Gati, and Rivigo are actively shaping this market, constantly innovating to meet the unique demands of social commerce logistics. These demands include faster delivery times, efficient last-mile delivery solutions, and robust return management systems tailored to the often smaller, more frequent shipments characteristic of social commerce transactions. The market's growth is further fueled by technological advancements such as real-time tracking, improved route optimization, and the integration of social media platforms with logistics providers. However, challenges remain, including managing fluctuating order volumes, maintaining consistent service quality across diverse geographical locations, and addressing the complexities of handling returns from various social commerce platforms.
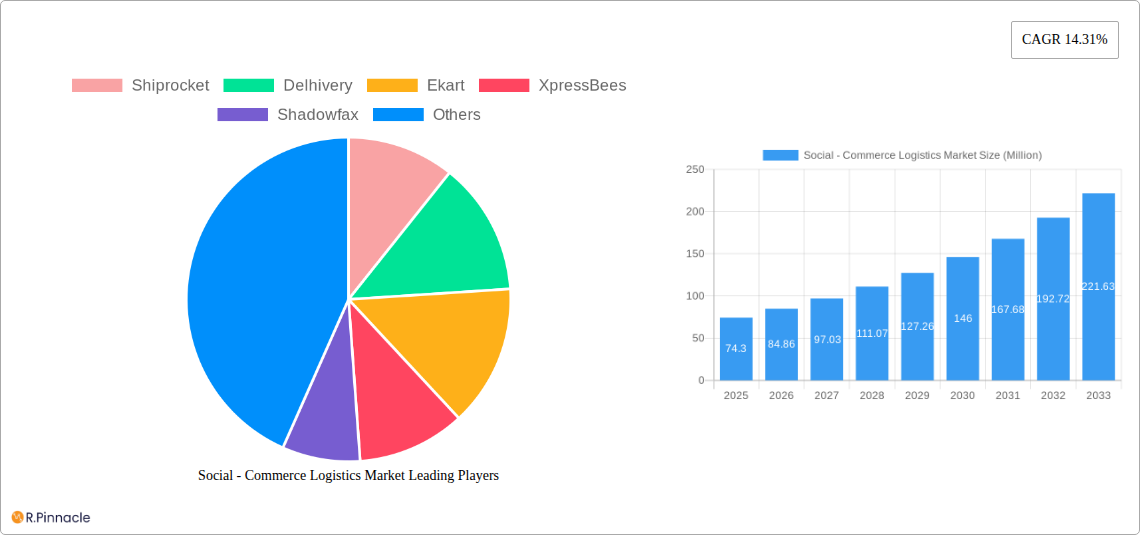
Social - Commerce Logistics Market Market Size (In Million)
The forecast period (2025-2033) anticipates continued market expansion, driven by the increasing adoption of social commerce by businesses of all sizes and the ongoing development of sophisticated logistics infrastructure to support this growth. The competitive landscape is likely to remain dynamic, with existing players investing in technological upgrades and new entrants seeking to capitalize on market opportunities. Furthermore, regulatory changes and evolving consumer expectations will continue to influence market strategies and necessitate adaptation from logistics providers. Effective last-mile delivery solutions will remain crucial for success, requiring innovative approaches to overcome geographical challenges and meet consumer demands for speed and transparency.
Social - Commerce Logistics Market Company Market Share
Social Commerce Logistics Market Report: 2019-2033
This comprehensive report provides an in-depth analysis of the Social Commerce Logistics Market, offering invaluable insights for industry professionals, investors, and strategists. With a study period spanning 2019-2033, a base year of 2025, and a forecast period of 2025-2033, this report leverages historical data (2019-2024) to predict future market trends and opportunities. The market is valued at xx Million in 2025 and is projected to reach xx Million by 2033, exhibiting a CAGR of xx%. Key players analyzed include Shiprocket, Delhivery, Ekart, XpressBees, Shadowfax, Ecom Express, Blue Dart, Wow Express, Gati, Rivigo, and 63 other companies.
Social-Commerce Logistics Market Market Structure & Innovation Trends
This section analyzes the market's competitive landscape, highlighting key trends driving innovation. We delve into market concentration, identifying the leading players and their respective market share. The report examines the regulatory framework impacting the industry, explores the presence of product substitutes, and profiles end-user demographics. Furthermore, it covers mergers and acquisitions (M&A) activities, including deal values and their impact on market dynamics. For example, the recent M&A activity between [Company A] and [Company B] resulted in a xx Million increase in market valuation.
- Market Concentration: Highly fragmented with top 10 players holding approximately xx% market share.
- Innovation Drivers: Rising e-commerce adoption, technological advancements in logistics, and the expansion of quick commerce.
- Regulatory Frameworks: Government policies related to e-commerce and logistics, including taxation and data privacy regulations.
- Product Substitutes: Traditional delivery services and in-house logistics solutions for larger enterprises.
- End-User Demographics: Focuses on demographic trends impacting consumer behavior and shopping habits.
- M&A Activities: Detailed analysis of significant M&A deals within the social commerce logistics sector from 2019-2024, with valuations and strategic implications.
Social-Commerce Logistics Market Market Dynamics & Trends
This section explores the key factors driving market growth, including technological disruptions and evolving consumer preferences. We analyze competitive dynamics, examining strategies employed by key players to gain market share. Specific metrics, such as CAGR and market penetration rates, provide a quantitative understanding of market performance. The rise of quick commerce and its impact on the industry is thoroughly examined. The market is driven by increased smartphone penetration, improving digital infrastructure, and the growing preference for online shopping.
Dominant Regions & Segments in Social-Commerce Logistics Market
This section identifies the leading geographical regions and market segments, providing a detailed analysis of their dominance. Key drivers, such as economic policies and infrastructure development, are outlined using bullet points. Paragraphs offer a comprehensive analysis of the factors contributing to regional and segmental dominance. For example, [Region X] demonstrates significant growth due to [specific driver 1] and [specific driver 2].
- Key Drivers for Dominant Region/Segment:
- Favorable government policies
- Robust digital infrastructure
- High consumer spending
- Strong e-commerce ecosystem
Social-Commerce Logistics Market Product Innovations
This section summarizes recent product developments, emphasizing technological trends and their market fit. The focus is on innovations enhancing delivery speed, efficiency, and customer experience, including the adoption of AI and automation in logistics. The competitive advantages offered by these innovations are also examined.
Report Scope & Segmentation Analysis
This report segments the market based on [list segmentation criteria e.g., service type, delivery speed, region]. Each segment's growth projections, market size, and competitive dynamics are detailed in separate paragraphs.
Key Drivers of Social Commerce Logistics Market Growth
This section outlines the key factors driving market growth, focusing on technological advancements (e.g., AI-powered route optimization), economic factors (e.g., rising disposable incomes), and regulatory changes (e.g., policies promoting e-commerce).
Challenges in the Social - Commerce Logistics Market Sector
This section identifies key challenges faced by the industry, including regulatory hurdles, supply chain disruptions, and intense competition. The quantifiable impact of these challenges on market growth is assessed.
Emerging Opportunities in Social Commerce Logistics Market
This section highlights emerging opportunities, including the expansion into new markets, the adoption of innovative technologies (e.g., drone delivery), and catering to evolving consumer preferences (e.g., sustainable logistics).
Leading Players in the Social-Commerce Logistics Market Market
- Shiprocket
- Delhivery
- Ekart
- XpressBees
- Shadowfax
- Ecom Express
- Blue Dart
- Wow Express
- Gati
- Rivigo
- 63 Other Companies
Key Developments in Social Commerce Logistics Market Industry
- June 2024: Delhivery and XpressBees pivot towards quick commerce, driven by increased demand from platforms like Swiggy Instamart, Blinkit, and Zepto.
- March 2024: Shiprocket expands its service portfolio to include fintech solutions (checkout services, working capital loans, insurance) and enhanced international shipping.
Future Outlook for Social Commerce Logistics Market Market
The social commerce logistics market is poised for significant growth, driven by continued e-commerce expansion, technological advancements, and the increasing adoption of quick commerce. Strategic partnerships, investments in technology, and expansion into new markets will be crucial for success in this dynamic landscape. The market is expected to see sustained growth over the forecast period, driven by [mention key growth drivers].
Social - Commerce Logistics Market Segmentation
-
1. Business Model
- 1.1. Business-to-consumer (B2C)
- 1.2. Business-to-business (B2B)
- 1.3. Consumer-to-consumer (C2C)
-
2. Service
- 2.1. Transportation
- 2.2. Warehousing and Inventory Management
- 2.3. Value-added Services (Labeling and Packaging)
-
3. Product Type
- 3.1. Personal and Beauty Care
- 3.2. Apparel
- 3.3. Accessories
- 3.4. Home Products
- 3.5. Health Supplements
- 3.6. Food and Beverages
- 3.7. Other Product Types
-
4. Sales Channel
- 4.1. Video Commerce
- 4.2. Social Network-Led Commerce
- 4.3. Social Reselling
- 4.4. Group Buying
- 4.5. Product Review Platforms
Social - Commerce Logistics Market Segmentation By Geography
-
1. North America
- 1.1. United States
- 1.2. Canada
- 1.3. Mexico
- 1.4. Rest of North America
-
2. Europe
- 2.1. United Kingdom
- 2.2. Germany
- 2.3. France
- 2.4. Russia
- 2.5. Italy
- 2.6. Spain
- 2.7. Rest of Europe
-
3. Asia Pacific
- 3.1. India
- 3.2. China
- 3.3. Japan
- 3.4. Australia
- 3.5. Rest of Asia Pacific
-
4. South America
- 4.1. Brazil
- 4.2. Argentina
- 4.3. Rest of South America
-
5. Middle East and Africa
- 5.1. United Arab Emirates
- 5.2. South Africa
- 5.3. Rest of Middle East and Africa
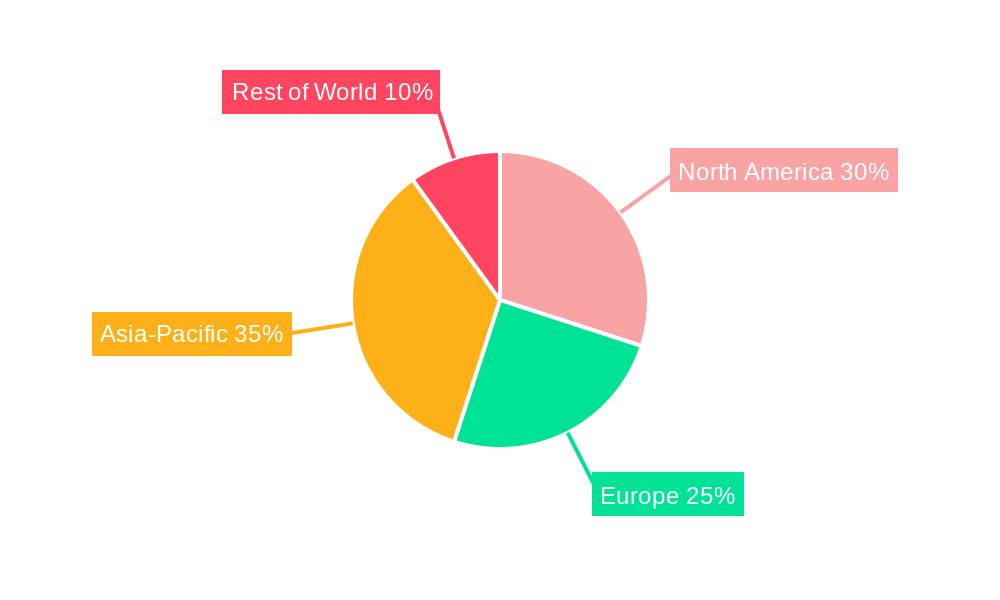
Social - Commerce Logistics Market Regional Market Share
Geographic Coverage of Social - Commerce Logistics Market
Social - Commerce Logistics Market REPORT HIGHLIGHTS
| Aspects | Details |
|---|---|
| Study Period | 2020-2034 |
| Base Year | 2025 |
| Estimated Year | 2026 |
| Forecast Period | 2026-2034 |
| Historical Period | 2020-2025 |
| Growth Rate | CAGR of 14.31% from 2020-2034 |
| Segmentation |
|
Table of Contents
- 1. Introduction
- 1.1. Research Scope
- 1.2. Market Segmentation
- 1.3. Research Objective
- 1.4. Definitions and Assumptions
- 2. Executive Summary
- 2.1. Market Snapshot
- 3. Market Dynamics
- 3.1. Market Drivers
- 3.2. Market Restrains
- 3.3. Market Trends
- 3.4. Market Opportunities
- 4. Market Factor Analysis
- 4.1. Porters Five Forces
- 4.1.1. Bargaining Power of Suppliers
- 4.1.2. Bargaining Power of Buyers
- 4.1.3. Threat of New Entrants
- 4.1.4. Threat of Substitutes
- 4.1.5. Competitive Rivalry
- 4.2. PESTEL analysis
- 4.3. BCG Analysis
- 4.3.1. Stars (High Growth, High Market Share)
- 4.3.2. Cash Cows (Low Growth, High Market Share)
- 4.3.3. Question Mark (High Growth, Low Market Share)
- 4.3.4. Dogs (Low Growth, Low Market Share)
- 4.4. Ansoff Matrix Analysis
- 4.5. Supply Chain Analysis
- 4.6. Regulatory Landscape
- 4.7. Current Market Potential and Opportunity Assessment (TAM–SAM–SOM Framework)
- 4.8. PRI Analyst Note
- 4.1. Porters Five Forces
- 5. Market Analysis, Insights and Forecast 2021-2033
- 5.1. Market Analysis, Insights and Forecast - by Business Model
- 5.1.1. Business-to-consumer (B2C)
- 5.1.2. Business-to-business (B2B)
- 5.1.3. Consumer-to-consumer (C2C)
- 5.2. Market Analysis, Insights and Forecast - by Service
- 5.2.1. Transportation
- 5.2.2. Warehousing and Inventory Management
- 5.2.3. Value-added Services (Labeling and Packaging)
- 5.3. Market Analysis, Insights and Forecast - by Product Type
- 5.3.1. Personal and Beauty Care
- 5.3.2. Apparel
- 5.3.3. Accessories
- 5.3.4. Home Products
- 5.3.5. Health Supplements
- 5.3.6. Food and Beverages
- 5.3.7. Other Product Types
- 5.4. Market Analysis, Insights and Forecast - by Sales Channel
- 5.4.1. Video Commerce
- 5.4.2. Social Network-Led Commerce
- 5.4.3. Social Reselling
- 5.4.4. Group Buying
- 5.4.5. Product Review Platforms
- 5.5. Market Analysis, Insights and Forecast - by Region
- 5.5.1. North America
- 5.5.2. Europe
- 5.5.3. Asia Pacific
- 5.5.4. South America
- 5.5.5. Middle East and Africa
- 5.1. Market Analysis, Insights and Forecast - by Business Model
- 6. Global Social - Commerce Logistics Market Analysis, Insights and Forecast, 2021-2033
- 6.1. Market Analysis, Insights and Forecast - by Business Model
- 6.1.1. Business-to-consumer (B2C)
- 6.1.2. Business-to-business (B2B)
- 6.1.3. Consumer-to-consumer (C2C)
- 6.2. Market Analysis, Insights and Forecast - by Service
- 6.2.1. Transportation
- 6.2.2. Warehousing and Inventory Management
- 6.2.3. Value-added Services (Labeling and Packaging)
- 6.3. Market Analysis, Insights and Forecast - by Product Type
- 6.3.1. Personal and Beauty Care
- 6.3.2. Apparel
- 6.3.3. Accessories
- 6.3.4. Home Products
- 6.3.5. Health Supplements
- 6.3.6. Food and Beverages
- 6.3.7. Other Product Types
- 6.4. Market Analysis, Insights and Forecast - by Sales Channel
- 6.4.1. Video Commerce
- 6.4.2. Social Network-Led Commerce
- 6.4.3. Social Reselling
- 6.4.4. Group Buying
- 6.4.5. Product Review Platforms
- 6.1. Market Analysis, Insights and Forecast - by Business Model
- 7. North America Social - Commerce Logistics Market Analysis, Insights and Forecast, 2020-2032
- 7.1. Market Analysis, Insights and Forecast - by Business Model
- 7.1.1. Business-to-consumer (B2C)
- 7.1.2. Business-to-business (B2B)
- 7.1.3. Consumer-to-consumer (C2C)
- 7.2. Market Analysis, Insights and Forecast - by Service
- 7.2.1. Transportation
- 7.2.2. Warehousing and Inventory Management
- 7.2.3. Value-added Services (Labeling and Packaging)
- 7.3. Market Analysis, Insights and Forecast - by Product Type
- 7.3.1. Personal and Beauty Care
- 7.3.2. Apparel
- 7.3.3. Accessories
- 7.3.4. Home Products
- 7.3.5. Health Supplements
- 7.3.6. Food and Beverages
- 7.3.7. Other Product Types
- 7.4. Market Analysis, Insights and Forecast - by Sales Channel
- 7.4.1. Video Commerce
- 7.4.2. Social Network-Led Commerce
- 7.4.3. Social Reselling
- 7.4.4. Group Buying
- 7.4.5. Product Review Platforms
- 7.1. Market Analysis, Insights and Forecast - by Business Model
- 8. Europe Social - Commerce Logistics Market Analysis, Insights and Forecast, 2020-2032
- 8.1. Market Analysis, Insights and Forecast - by Business Model
- 8.1.1. Business-to-consumer (B2C)
- 8.1.2. Business-to-business (B2B)
- 8.1.3. Consumer-to-consumer (C2C)
- 8.2. Market Analysis, Insights and Forecast - by Service
- 8.2.1. Transportation
- 8.2.2. Warehousing and Inventory Management
- 8.2.3. Value-added Services (Labeling and Packaging)
- 8.3. Market Analysis, Insights and Forecast - by Product Type
- 8.3.1. Personal and Beauty Care
- 8.3.2. Apparel
- 8.3.3. Accessories
- 8.3.4. Home Products
- 8.3.5. Health Supplements
- 8.3.6. Food and Beverages
- 8.3.7. Other Product Types
- 8.4. Market Analysis, Insights and Forecast - by Sales Channel
- 8.4.1. Video Commerce
- 8.4.2. Social Network-Led Commerce
- 8.4.3. Social Reselling
- 8.4.4. Group Buying
- 8.4.5. Product Review Platforms
- 8.1. Market Analysis, Insights and Forecast - by Business Model
- 9. Asia Pacific Social - Commerce Logistics Market Analysis, Insights and Forecast, 2020-2032
- 9.1. Market Analysis, Insights and Forecast - by Business Model
- 9.1.1. Business-to-consumer (B2C)
- 9.1.2. Business-to-business (B2B)
- 9.1.3. Consumer-to-consumer (C2C)
- 9.2. Market Analysis, Insights and Forecast - by Service
- 9.2.1. Transportation
- 9.2.2. Warehousing and Inventory Management
- 9.2.3. Value-added Services (Labeling and Packaging)
- 9.3. Market Analysis, Insights and Forecast - by Product Type
- 9.3.1. Personal and Beauty Care
- 9.3.2. Apparel
- 9.3.3. Accessories
- 9.3.4. Home Products
- 9.3.5. Health Supplements
- 9.3.6. Food and Beverages
- 9.3.7. Other Product Types
- 9.4. Market Analysis, Insights and Forecast - by Sales Channel
- 9.4.1. Video Commerce
- 9.4.2. Social Network-Led Commerce
- 9.4.3. Social Reselling
- 9.4.4. Group Buying
- 9.4.5. Product Review Platforms
- 9.1. Market Analysis, Insights and Forecast - by Business Model
- 10. South America Social - Commerce Logistics Market Analysis, Insights and Forecast, 2020-2032
- 10.1. Market Analysis, Insights and Forecast - by Business Model
- 10.1.1. Business-to-consumer (B2C)
- 10.1.2. Business-to-business (B2B)
- 10.1.3. Consumer-to-consumer (C2C)
- 10.2. Market Analysis, Insights and Forecast - by Service
- 10.2.1. Transportation
- 10.2.2. Warehousing and Inventory Management
- 10.2.3. Value-added Services (Labeling and Packaging)
- 10.3. Market Analysis, Insights and Forecast - by Product Type
- 10.3.1. Personal and Beauty Care
- 10.3.2. Apparel
- 10.3.3. Accessories
- 10.3.4. Home Products
- 10.3.5. Health Supplements
- 10.3.6. Food and Beverages
- 10.3.7. Other Product Types
- 10.4. Market Analysis, Insights and Forecast - by Sales Channel
- 10.4.1. Video Commerce
- 10.4.2. Social Network-Led Commerce
- 10.4.3. Social Reselling
- 10.4.4. Group Buying
- 10.4.5. Product Review Platforms
- 10.1. Market Analysis, Insights and Forecast - by Business Model
- 11. Middle East and Africa Social - Commerce Logistics Market Analysis, Insights and Forecast, 2020-2032
- 11.1. Market Analysis, Insights and Forecast - by Business Model
- 11.1.1. Business-to-consumer (B2C)
- 11.1.2. Business-to-business (B2B)
- 11.1.3. Consumer-to-consumer (C2C)
- 11.2. Market Analysis, Insights and Forecast - by Service
- 11.2.1. Transportation
- 11.2.2. Warehousing and Inventory Management
- 11.2.3. Value-added Services (Labeling and Packaging)
- 11.3. Market Analysis, Insights and Forecast - by Product Type
- 11.3.1. Personal and Beauty Care
- 11.3.2. Apparel
- 11.3.3. Accessories
- 11.3.4. Home Products
- 11.3.5. Health Supplements
- 11.3.6. Food and Beverages
- 11.3.7. Other Product Types
- 11.4. Market Analysis, Insights and Forecast - by Sales Channel
- 11.4.1. Video Commerce
- 11.4.2. Social Network-Led Commerce
- 11.4.3. Social Reselling
- 11.4.4. Group Buying
- 11.4.5. Product Review Platforms
- 11.1. Market Analysis, Insights and Forecast - by Business Model
- 12. Competitive Analysis
- 12.1. Company Profiles
- 12.1.1 Shiprocket
- 12.1.1.1. Company Overview
- 12.1.1.2. Products
- 12.1.1.3. Company Financials
- 12.1.1.4. SWOT Analysis
- 12.1.2 Delhivery
- 12.1.2.1. Company Overview
- 12.1.2.2. Products
- 12.1.2.3. Company Financials
- 12.1.2.4. SWOT Analysis
- 12.1.3 Ekart
- 12.1.3.1. Company Overview
- 12.1.3.2. Products
- 12.1.3.3. Company Financials
- 12.1.3.4. SWOT Analysis
- 12.1.4 XpressBees
- 12.1.4.1. Company Overview
- 12.1.4.2. Products
- 12.1.4.3. Company Financials
- 12.1.4.4. SWOT Analysis
- 12.1.5 Shadowfax
- 12.1.5.1. Company Overview
- 12.1.5.2. Products
- 12.1.5.3. Company Financials
- 12.1.5.4. SWOT Analysis
- 12.1.6 Ecom Express
- 12.1.6.1. Company Overview
- 12.1.6.2. Products
- 12.1.6.3. Company Financials
- 12.1.6.4. SWOT Analysis
- 12.1.7 Blue Dart
- 12.1.7.1. Company Overview
- 12.1.7.2. Products
- 12.1.7.3. Company Financials
- 12.1.7.4. SWOT Analysis
- 12.1.8 Wow Express
- 12.1.8.1. Company Overview
- 12.1.8.2. Products
- 12.1.8.3. Company Financials
- 12.1.8.4. SWOT Analysis
- 12.1.9 Gati
- 12.1.9.1. Company Overview
- 12.1.9.2. Products
- 12.1.9.3. Company Financials
- 12.1.9.4. SWOT Analysis
- 12.1.10 Rivigo **List Not Exhaustive 6 3 Other Companie
- 12.1.10.1. Company Overview
- 12.1.10.2. Products
- 12.1.10.3. Company Financials
- 12.1.10.4. SWOT Analysis
- 12.1.1 Shiprocket
- 12.2. Market Entropy
- 12.2.1 Company's Key Areas Served
- 12.2.2 Recent Developments
- 12.3. Company Market Share Analysis 2025
- 12.3.1 Top 5 Companies Market Share Analysis
- 12.3.2 Top 3 Companies Market Share Analysis
- 12.4. List of Potential Customers
- 13. Research Methodology
List of Figures
- Figure 1: Global Social - Commerce Logistics Market Revenue Breakdown (Million, %) by Region 2025 & 2033
- Figure 2: Global Social - Commerce Logistics Market Volume Breakdown (Billion, %) by Region 2025 & 2033
- Figure 3: North America Social - Commerce Logistics Market Revenue (Million), by Business Model 2025 & 2033
- Figure 4: North America Social - Commerce Logistics Market Volume (Billion), by Business Model 2025 & 2033
- Figure 5: North America Social - Commerce Logistics Market Revenue Share (%), by Business Model 2025 & 2033
- Figure 6: North America Social - Commerce Logistics Market Volume Share (%), by Business Model 2025 & 2033
- Figure 7: North America Social - Commerce Logistics Market Revenue (Million), by Service 2025 & 2033
- Figure 8: North America Social - Commerce Logistics Market Volume (Billion), by Service 2025 & 2033
- Figure 9: North America Social - Commerce Logistics Market Revenue Share (%), by Service 2025 & 2033
- Figure 10: North America Social - Commerce Logistics Market Volume Share (%), by Service 2025 & 2033
- Figure 11: North America Social - Commerce Logistics Market Revenue (Million), by Product Type 2025 & 2033
- Figure 12: North America Social - Commerce Logistics Market Volume (Billion), by Product Type 2025 & 2033
- Figure 13: North America Social - Commerce Logistics Market Revenue Share (%), by Product Type 2025 & 2033
- Figure 14: North America Social - Commerce Logistics Market Volume Share (%), by Product Type 2025 & 2033
- Figure 15: North America Social - Commerce Logistics Market Revenue (Million), by Sales Channel 2025 & 2033
- Figure 16: North America Social - Commerce Logistics Market Volume (Billion), by Sales Channel 2025 & 2033
- Figure 17: North America Social - Commerce Logistics Market Revenue Share (%), by Sales Channel 2025 & 2033
- Figure 18: North America Social - Commerce Logistics Market Volume Share (%), by Sales Channel 2025 & 2033
- Figure 19: North America Social - Commerce Logistics Market Revenue (Million), by Country 2025 & 2033
- Figure 20: North America Social - Commerce Logistics Market Volume (Billion), by Country 2025 & 2033
- Figure 21: North America Social - Commerce Logistics Market Revenue Share (%), by Country 2025 & 2033
- Figure 22: North America Social - Commerce Logistics Market Volume Share (%), by Country 2025 & 2033
- Figure 23: Europe Social - Commerce Logistics Market Revenue (Million), by Business Model 2025 & 2033
- Figure 24: Europe Social - Commerce Logistics Market Volume (Billion), by Business Model 2025 & 2033
- Figure 25: Europe Social - Commerce Logistics Market Revenue Share (%), by Business Model 2025 & 2033
- Figure 26: Europe Social - Commerce Logistics Market Volume Share (%), by Business Model 2025 & 2033
- Figure 27: Europe Social - Commerce Logistics Market Revenue (Million), by Service 2025 & 2033
- Figure 28: Europe Social - Commerce Logistics Market Volume (Billion), by Service 2025 & 2033
- Figure 29: Europe Social - Commerce Logistics Market Revenue Share (%), by Service 2025 & 2033
- Figure 30: Europe Social - Commerce Logistics Market Volume Share (%), by Service 2025 & 2033
- Figure 31: Europe Social - Commerce Logistics Market Revenue (Million), by Product Type 2025 & 2033
- Figure 32: Europe Social - Commerce Logistics Market Volume (Billion), by Product Type 2025 & 2033
- Figure 33: Europe Social - Commerce Logistics Market Revenue Share (%), by Product Type 2025 & 2033
- Figure 34: Europe Social - Commerce Logistics Market Volume Share (%), by Product Type 2025 & 2033
- Figure 35: Europe Social - Commerce Logistics Market Revenue (Million), by Sales Channel 2025 & 2033
- Figure 36: Europe Social - Commerce Logistics Market Volume (Billion), by Sales Channel 2025 & 2033
- Figure 37: Europe Social - Commerce Logistics Market Revenue Share (%), by Sales Channel 2025 & 2033
- Figure 38: Europe Social - Commerce Logistics Market Volume Share (%), by Sales Channel 2025 & 2033
- Figure 39: Europe Social - Commerce Logistics Market Revenue (Million), by Country 2025 & 2033
- Figure 40: Europe Social - Commerce Logistics Market Volume (Billion), by Country 2025 & 2033
- Figure 41: Europe Social - Commerce Logistics Market Revenue Share (%), by Country 2025 & 2033
- Figure 42: Europe Social - Commerce Logistics Market Volume Share (%), by Country 2025 & 2033
- Figure 43: Asia Pacific Social - Commerce Logistics Market Revenue (Million), by Business Model 2025 & 2033
- Figure 44: Asia Pacific Social - Commerce Logistics Market Volume (Billion), by Business Model 2025 & 2033
- Figure 45: Asia Pacific Social - Commerce Logistics Market Revenue Share (%), by Business Model 2025 & 2033
- Figure 46: Asia Pacific Social - Commerce Logistics Market Volume Share (%), by Business Model 2025 & 2033
- Figure 47: Asia Pacific Social - Commerce Logistics Market Revenue (Million), by Service 2025 & 2033
- Figure 48: Asia Pacific Social - Commerce Logistics Market Volume (Billion), by Service 2025 & 2033
- Figure 49: Asia Pacific Social - Commerce Logistics Market Revenue Share (%), by Service 2025 & 2033
- Figure 50: Asia Pacific Social - Commerce Logistics Market Volume Share (%), by Service 2025 & 2033
- Figure 51: Asia Pacific Social - Commerce Logistics Market Revenue (Million), by Product Type 2025 & 2033
- Figure 52: Asia Pacific Social - Commerce Logistics Market Volume (Billion), by Product Type 2025 & 2033
- Figure 53: Asia Pacific Social - Commerce Logistics Market Revenue Share (%), by Product Type 2025 & 2033
- Figure 54: Asia Pacific Social - Commerce Logistics Market Volume Share (%), by Product Type 2025 & 2033
- Figure 55: Asia Pacific Social - Commerce Logistics Market Revenue (Million), by Sales Channel 2025 & 2033
- Figure 56: Asia Pacific Social - Commerce Logistics Market Volume (Billion), by Sales Channel 2025 & 2033
- Figure 57: Asia Pacific Social - Commerce Logistics Market Revenue Share (%), by Sales Channel 2025 & 2033
- Figure 58: Asia Pacific Social - Commerce Logistics Market Volume Share (%), by Sales Channel 2025 & 2033
- Figure 59: Asia Pacific Social - Commerce Logistics Market Revenue (Million), by Country 2025 & 2033
- Figure 60: Asia Pacific Social - Commerce Logistics Market Volume (Billion), by Country 2025 & 2033
- Figure 61: Asia Pacific Social - Commerce Logistics Market Revenue Share (%), by Country 2025 & 2033
- Figure 62: Asia Pacific Social - Commerce Logistics Market Volume Share (%), by Country 2025 & 2033
- Figure 63: South America Social - Commerce Logistics Market Revenue (Million), by Business Model 2025 & 2033
- Figure 64: South America Social - Commerce Logistics Market Volume (Billion), by Business Model 2025 & 2033
- Figure 65: South America Social - Commerce Logistics Market Revenue Share (%), by Business Model 2025 & 2033
- Figure 66: South America Social - Commerce Logistics Market Volume Share (%), by Business Model 2025 & 2033
- Figure 67: South America Social - Commerce Logistics Market Revenue (Million), by Service 2025 & 2033
- Figure 68: South America Social - Commerce Logistics Market Volume (Billion), by Service 2025 & 2033
- Figure 69: South America Social - Commerce Logistics Market Revenue Share (%), by Service 2025 & 2033
- Figure 70: South America Social - Commerce Logistics Market Volume Share (%), by Service 2025 & 2033
- Figure 71: South America Social - Commerce Logistics Market Revenue (Million), by Product Type 2025 & 2033
- Figure 72: South America Social - Commerce Logistics Market Volume (Billion), by Product Type 2025 & 2033
- Figure 73: South America Social - Commerce Logistics Market Revenue Share (%), by Product Type 2025 & 2033
- Figure 74: South America Social - Commerce Logistics Market Volume Share (%), by Product Type 2025 & 2033
- Figure 75: South America Social - Commerce Logistics Market Revenue (Million), by Sales Channel 2025 & 2033
- Figure 76: South America Social - Commerce Logistics Market Volume (Billion), by Sales Channel 2025 & 2033
- Figure 77: South America Social - Commerce Logistics Market Revenue Share (%), by Sales Channel 2025 & 2033
- Figure 78: South America Social - Commerce Logistics Market Volume Share (%), by Sales Channel 2025 & 2033
- Figure 79: South America Social - Commerce Logistics Market Revenue (Million), by Country 2025 & 2033
- Figure 80: South America Social - Commerce Logistics Market Volume (Billion), by Country 2025 & 2033
- Figure 81: South America Social - Commerce Logistics Market Revenue Share (%), by Country 2025 & 2033
- Figure 82: South America Social - Commerce Logistics Market Volume Share (%), by Country 2025 & 2033
- Figure 83: Middle East and Africa Social - Commerce Logistics Market Revenue (Million), by Business Model 2025 & 2033
- Figure 84: Middle East and Africa Social - Commerce Logistics Market Volume (Billion), by Business Model 2025 & 2033
- Figure 85: Middle East and Africa Social - Commerce Logistics Market Revenue Share (%), by Business Model 2025 & 2033
- Figure 86: Middle East and Africa Social - Commerce Logistics Market Volume Share (%), by Business Model 2025 & 2033
- Figure 87: Middle East and Africa Social - Commerce Logistics Market Revenue (Million), by Service 2025 & 2033
- Figure 88: Middle East and Africa Social - Commerce Logistics Market Volume (Billion), by Service 2025 & 2033
- Figure 89: Middle East and Africa Social - Commerce Logistics Market Revenue Share (%), by Service 2025 & 2033
- Figure 90: Middle East and Africa Social - Commerce Logistics Market Volume Share (%), by Service 2025 & 2033
- Figure 91: Middle East and Africa Social - Commerce Logistics Market Revenue (Million), by Product Type 2025 & 2033
- Figure 92: Middle East and Africa Social - Commerce Logistics Market Volume (Billion), by Product Type 2025 & 2033
- Figure 93: Middle East and Africa Social - Commerce Logistics Market Revenue Share (%), by Product Type 2025 & 2033
- Figure 94: Middle East and Africa Social - Commerce Logistics Market Volume Share (%), by Product Type 2025 & 2033
- Figure 95: Middle East and Africa Social - Commerce Logistics Market Revenue (Million), by Sales Channel 2025 & 2033
- Figure 96: Middle East and Africa Social - Commerce Logistics Market Volume (Billion), by Sales Channel 2025 & 2033
- Figure 97: Middle East and Africa Social - Commerce Logistics Market Revenue Share (%), by Sales Channel 2025 & 2033
- Figure 98: Middle East and Africa Social - Commerce Logistics Market Volume Share (%), by Sales Channel 2025 & 2033
- Figure 99: Middle East and Africa Social - Commerce Logistics Market Revenue (Million), by Country 2025 & 2033
- Figure 100: Middle East and Africa Social - Commerce Logistics Market Volume (Billion), by Country 2025 & 2033
- Figure 101: Middle East and Africa Social - Commerce Logistics Market Revenue Share (%), by Country 2025 & 2033
- Figure 102: Middle East and Africa Social - Commerce Logistics Market Volume Share (%), by Country 2025 & 2033
List of Tables
- Table 1: Global Social - Commerce Logistics Market Revenue Million Forecast, by Business Model 2020 & 2033
- Table 2: Global Social - Commerce Logistics Market Volume Billion Forecast, by Business Model 2020 & 2033
- Table 3: Global Social - Commerce Logistics Market Revenue Million Forecast, by Service 2020 & 2033
- Table 4: Global Social - Commerce Logistics Market Volume Billion Forecast, by Service 2020 & 2033
- Table 5: Global Social - Commerce Logistics Market Revenue Million Forecast, by Product Type 2020 & 2033
- Table 6: Global Social - Commerce Logistics Market Volume Billion Forecast, by Product Type 2020 & 2033
- Table 7: Global Social - Commerce Logistics Market Revenue Million Forecast, by Sales Channel 2020 & 2033
- Table 8: Global Social - Commerce Logistics Market Volume Billion Forecast, by Sales Channel 2020 & 2033
- Table 9: Global Social - Commerce Logistics Market Revenue Million Forecast, by Region 2020 & 2033
- Table 10: Global Social - Commerce Logistics Market Volume Billion Forecast, by Region 2020 & 2033
- Table 11: Global Social - Commerce Logistics Market Revenue Million Forecast, by Business Model 2020 & 2033
- Table 12: Global Social - Commerce Logistics Market Volume Billion Forecast, by Business Model 2020 & 2033
- Table 13: Global Social - Commerce Logistics Market Revenue Million Forecast, by Service 2020 & 2033
- Table 14: Global Social - Commerce Logistics Market Volume Billion Forecast, by Service 2020 & 2033
- Table 15: Global Social - Commerce Logistics Market Revenue Million Forecast, by Product Type 2020 & 2033
- Table 16: Global Social - Commerce Logistics Market Volume Billion Forecast, by Product Type 2020 & 2033
- Table 17: Global Social - Commerce Logistics Market Revenue Million Forecast, by Sales Channel 2020 & 2033
- Table 18: Global Social - Commerce Logistics Market Volume Billion Forecast, by Sales Channel 2020 & 2033
- Table 19: Global Social - Commerce Logistics Market Revenue Million Forecast, by Country 2020 & 2033
- Table 20: Global Social - Commerce Logistics Market Volume Billion Forecast, by Country 2020 & 2033
- Table 21: United States Social - Commerce Logistics Market Revenue (Million) Forecast, by Application 2020 & 2033
- Table 22: United States Social - Commerce Logistics Market Volume (Billion) Forecast, by Application 2020 & 2033
- Table 23: Canada Social - Commerce Logistics Market Revenue (Million) Forecast, by Application 2020 & 2033
- Table 24: Canada Social - Commerce Logistics Market Volume (Billion) Forecast, by Application 2020 & 2033
- Table 25: Mexico Social - Commerce Logistics Market Revenue (Million) Forecast, by Application 2020 & 2033
- Table 26: Mexico Social - Commerce Logistics Market Volume (Billion) Forecast, by Application 2020 & 2033
- Table 27: Rest of North America Social - Commerce Logistics Market Revenue (Million) Forecast, by Application 2020 & 2033
- Table 28: Rest of North America Social - Commerce Logistics Market Volume (Billion) Forecast, by Application 2020 & 2033
- Table 29: Global Social - Commerce Logistics Market Revenue Million Forecast, by Business Model 2020 & 2033
- Table 30: Global Social - Commerce Logistics Market Volume Billion Forecast, by Business Model 2020 & 2033
- Table 31: Global Social - Commerce Logistics Market Revenue Million Forecast, by Service 2020 & 2033
- Table 32: Global Social - Commerce Logistics Market Volume Billion Forecast, by Service 2020 & 2033
- Table 33: Global Social - Commerce Logistics Market Revenue Million Forecast, by Product Type 2020 & 2033
- Table 34: Global Social - Commerce Logistics Market Volume Billion Forecast, by Product Type 2020 & 2033
- Table 35: Global Social - Commerce Logistics Market Revenue Million Forecast, by Sales Channel 2020 & 2033
- Table 36: Global Social - Commerce Logistics Market Volume Billion Forecast, by Sales Channel 2020 & 2033
- Table 37: Global Social - Commerce Logistics Market Revenue Million Forecast, by Country 2020 & 2033
- Table 38: Global Social - Commerce Logistics Market Volume Billion Forecast, by Country 2020 & 2033
- Table 39: United Kingdom Social - Commerce Logistics Market Revenue (Million) Forecast, by Application 2020 & 2033
- Table 40: United Kingdom Social - Commerce Logistics Market Volume (Billion) Forecast, by Application 2020 & 2033
- Table 41: Germany Social - Commerce Logistics Market Revenue (Million) Forecast, by Application 2020 & 2033
- Table 42: Germany Social - Commerce Logistics Market Volume (Billion) Forecast, by Application 2020 & 2033
- Table 43: France Social - Commerce Logistics Market Revenue (Million) Forecast, by Application 2020 & 2033
- Table 44: France Social - Commerce Logistics Market Volume (Billion) Forecast, by Application 2020 & 2033
- Table 45: Russia Social - Commerce Logistics Market Revenue (Million) Forecast, by Application 2020 & 2033
- Table 46: Russia Social - Commerce Logistics Market Volume (Billion) Forecast, by Application 2020 & 2033
- Table 47: Italy Social - Commerce Logistics Market Revenue (Million) Forecast, by Application 2020 & 2033
- Table 48: Italy Social - Commerce Logistics Market Volume (Billion) Forecast, by Application 2020 & 2033
- Table 49: Spain Social - Commerce Logistics Market Revenue (Million) Forecast, by Application 2020 & 2033
- Table 50: Spain Social - Commerce Logistics Market Volume (Billion) Forecast, by Application 2020 & 2033
- Table 51: Rest of Europe Social - Commerce Logistics Market Revenue (Million) Forecast, by Application 2020 & 2033
- Table 52: Rest of Europe Social - Commerce Logistics Market Volume (Billion) Forecast, by Application 2020 & 2033
- Table 53: Global Social - Commerce Logistics Market Revenue Million Forecast, by Business Model 2020 & 2033
- Table 54: Global Social - Commerce Logistics Market Volume Billion Forecast, by Business Model 2020 & 2033
- Table 55: Global Social - Commerce Logistics Market Revenue Million Forecast, by Service 2020 & 2033
- Table 56: Global Social - Commerce Logistics Market Volume Billion Forecast, by Service 2020 & 2033
- Table 57: Global Social - Commerce Logistics Market Revenue Million Forecast, by Product Type 2020 & 2033
- Table 58: Global Social - Commerce Logistics Market Volume Billion Forecast, by Product Type 2020 & 2033
- Table 59: Global Social - Commerce Logistics Market Revenue Million Forecast, by Sales Channel 2020 & 2033
- Table 60: Global Social - Commerce Logistics Market Volume Billion Forecast, by Sales Channel 2020 & 2033
- Table 61: Global Social - Commerce Logistics Market Revenue Million Forecast, by Country 2020 & 2033
- Table 62: Global Social - Commerce Logistics Market Volume Billion Forecast, by Country 2020 & 2033
- Table 63: India Social - Commerce Logistics Market Revenue (Million) Forecast, by Application 2020 & 2033
- Table 64: India Social - Commerce Logistics Market Volume (Billion) Forecast, by Application 2020 & 2033
- Table 65: China Social - Commerce Logistics Market Revenue (Million) Forecast, by Application 2020 & 2033
- Table 66: China Social - Commerce Logistics Market Volume (Billion) Forecast, by Application 2020 & 2033
- Table 67: Japan Social - Commerce Logistics Market Revenue (Million) Forecast, by Application 2020 & 2033
- Table 68: Japan Social - Commerce Logistics Market Volume (Billion) Forecast, by Application 2020 & 2033
- Table 69: Australia Social - Commerce Logistics Market Revenue (Million) Forecast, by Application 2020 & 2033
- Table 70: Australia Social - Commerce Logistics Market Volume (Billion) Forecast, by Application 2020 & 2033
- Table 71: Rest of Asia Pacific Social - Commerce Logistics Market Revenue (Million) Forecast, by Application 2020 & 2033
- Table 72: Rest of Asia Pacific Social - Commerce Logistics Market Volume (Billion) Forecast, by Application 2020 & 2033
- Table 73: Global Social - Commerce Logistics Market Revenue Million Forecast, by Business Model 2020 & 2033
- Table 74: Global Social - Commerce Logistics Market Volume Billion Forecast, by Business Model 2020 & 2033
- Table 75: Global Social - Commerce Logistics Market Revenue Million Forecast, by Service 2020 & 2033
- Table 76: Global Social - Commerce Logistics Market Volume Billion Forecast, by Service 2020 & 2033
- Table 77: Global Social - Commerce Logistics Market Revenue Million Forecast, by Product Type 2020 & 2033
- Table 78: Global Social - Commerce Logistics Market Volume Billion Forecast, by Product Type 2020 & 2033
- Table 79: Global Social - Commerce Logistics Market Revenue Million Forecast, by Sales Channel 2020 & 2033
- Table 80: Global Social - Commerce Logistics Market Volume Billion Forecast, by Sales Channel 2020 & 2033
- Table 81: Global Social - Commerce Logistics Market Revenue Million Forecast, by Country 2020 & 2033
- Table 82: Global Social - Commerce Logistics Market Volume Billion Forecast, by Country 2020 & 2033
- Table 83: Brazil Social - Commerce Logistics Market Revenue (Million) Forecast, by Application 2020 & 2033
- Table 84: Brazil Social - Commerce Logistics Market Volume (Billion) Forecast, by Application 2020 & 2033
- Table 85: Argentina Social - Commerce Logistics Market Revenue (Million) Forecast, by Application 2020 & 2033
- Table 86: Argentina Social - Commerce Logistics Market Volume (Billion) Forecast, by Application 2020 & 2033
- Table 87: Rest of South America Social - Commerce Logistics Market Revenue (Million) Forecast, by Application 2020 & 2033
- Table 88: Rest of South America Social - Commerce Logistics Market Volume (Billion) Forecast, by Application 2020 & 2033
- Table 89: Global Social - Commerce Logistics Market Revenue Million Forecast, by Business Model 2020 & 2033
- Table 90: Global Social - Commerce Logistics Market Volume Billion Forecast, by Business Model 2020 & 2033
- Table 91: Global Social - Commerce Logistics Market Revenue Million Forecast, by Service 2020 & 2033
- Table 92: Global Social - Commerce Logistics Market Volume Billion Forecast, by Service 2020 & 2033
- Table 93: Global Social - Commerce Logistics Market Revenue Million Forecast, by Product Type 2020 & 2033
- Table 94: Global Social - Commerce Logistics Market Volume Billion Forecast, by Product Type 2020 & 2033
- Table 95: Global Social - Commerce Logistics Market Revenue Million Forecast, by Sales Channel 2020 & 2033
- Table 96: Global Social - Commerce Logistics Market Volume Billion Forecast, by Sales Channel 2020 & 2033
- Table 97: Global Social - Commerce Logistics Market Revenue Million Forecast, by Country 2020 & 2033
- Table 98: Global Social - Commerce Logistics Market Volume Billion Forecast, by Country 2020 & 2033
- Table 99: United Arab Emirates Social - Commerce Logistics Market Revenue (Million) Forecast, by Application 2020 & 2033
- Table 100: United Arab Emirates Social - Commerce Logistics Market Volume (Billion) Forecast, by Application 2020 & 2033
- Table 101: South Africa Social - Commerce Logistics Market Revenue (Million) Forecast, by Application 2020 & 2033
- Table 102: South Africa Social - Commerce Logistics Market Volume (Billion) Forecast, by Application 2020 & 2033
- Table 103: Rest of Middle East and Africa Social - Commerce Logistics Market Revenue (Million) Forecast, by Application 2020 & 2033
- Table 104: Rest of Middle East and Africa Social - Commerce Logistics Market Volume (Billion) Forecast, by Application 2020 & 2033
Frequently Asked Questions
1. What is the projected Compound Annual Growth Rate (CAGR) of the Social - Commerce Logistics Market?
The projected CAGR is approximately 14.31%.
2. Which companies are prominent players in the Social - Commerce Logistics Market?
Key companies in the market include Shiprocket, Delhivery, Ekart, XpressBees, Shadowfax, Ecom Express, Blue Dart, Wow Express, Gati, Rivigo **List Not Exhaustive 6 3 Other Companie.
3. What are the main segments of the Social - Commerce Logistics Market?
The market segments include Business Model, Service, Product Type, Sales Channel.
4. Can you provide details about the market size?
The market size is estimated to be USD 74.30 Million as of 2022.
5. What are some drivers contributing to market growth?
4.; Growing Number of Social Media Platforms4.; Shift in Consumer Preferences Toward Online Purchase.
6. What are the notable trends driving market growth?
Rising B2C Social commerce Demand Steers Market Growth.
7. Are there any restraints impacting market growth?
4.; Growing Number of Social Media Platforms4.; Shift in Consumer Preferences Toward Online Purchase.
8. Can you provide examples of recent developments in the market?
June 2024: Third-party logistics companies such as Delhivery and XpressBees, traditionally catering to e-commerce, are pivoting toward the quick-commerce industry. This shift comes in response to the rising demand on platforms like Swiggy Instamart, Blinkit, and Zepto.March 2024: Shiprocket, a platform that consolidates logistics services for small online sellers, expanded its service portfolio in conjunction with a recent funding round. These new services, initially tested, encompass fintech solutions such as checkout services, working capital loans, insurance, and an enhanced focus on international shipping.
9. What pricing options are available for accessing the report?
Pricing options include single-user, multi-user, and enterprise licenses priced at USD 4750, USD 5250, and USD 8750 respectively.
10. Is the market size provided in terms of value or volume?
The market size is provided in terms of value, measured in Million and volume, measured in Billion.
11. Are there any specific market keywords associated with the report?
Yes, the market keyword associated with the report is "Social - Commerce Logistics Market," which aids in identifying and referencing the specific market segment covered.
12. How do I determine which pricing option suits my needs best?
The pricing options vary based on user requirements and access needs. Individual users may opt for single-user licenses, while businesses requiring broader access may choose multi-user or enterprise licenses for cost-effective access to the report.
13. Are there any additional resources or data provided in the Social - Commerce Logistics Market report?
While the report offers comprehensive insights, it's advisable to review the specific contents or supplementary materials provided to ascertain if additional resources or data are available.
14. How can I stay updated on further developments or reports in the Social - Commerce Logistics Market?
To stay informed about further developments, trends, and reports in the Social - Commerce Logistics Market, consider subscribing to industry newsletters, following relevant companies and organizations, or regularly checking reputable industry news sources and publications.
Methodology
Step 1 - Identification of Relevant Samples Size from Population Database


Step 2 - Approaches for Defining Global Market Size (Value, Volume* & Price*)

Note*: In applicable scenarios
Step 3 - Data Sources
Primary Research
- Web Analytics
- Survey Reports
- Research Institute
- Latest Research Reports
- Opinion Leaders
Secondary Research
- Annual Reports
- White Paper
- Latest Press Release
- Industry Association
- Paid Database
- Investor Presentations

Step 4 - Data Triangulation
Involves using different sources of information in order to increase the validity of a study
These sources are likely to be stakeholders in a program - participants, other researchers, program staff, other community members, and so on.
Then we put all data in single framework & apply various statistical tools to find out the dynamic on the market.
During the analysis stage, feedback from the stakeholder groups would be compared to determine areas of agreement as well as areas of divergence