

Key Insights
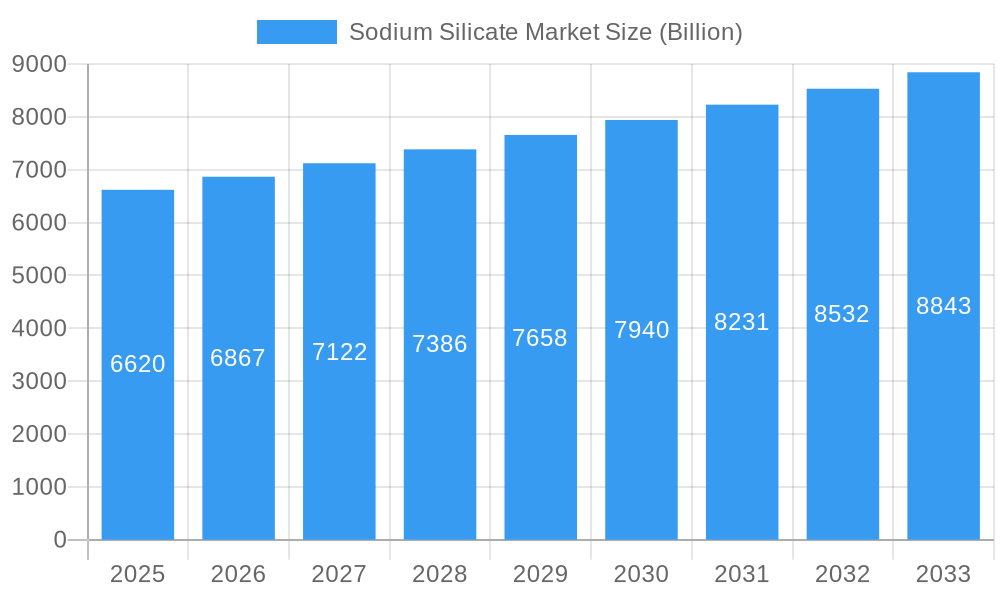
The global sodium silicate market, valued at $6.62 billion in 2025, is projected to experience steady growth, driven by its diverse applications across various industries. A Compound Annual Growth Rate (CAGR) of 3.6% from 2025 to 2033 indicates a promising outlook. Key drivers include the increasing demand for construction materials, particularly in developing economies experiencing rapid urbanization. The burgeoning adhesives and paints sector, fueled by the construction boom and rising demand for high-performance coatings, significantly contributes to market growth. Furthermore, the expanding detergent and food preservation industries rely heavily on sodium silicate's properties as a cleaning agent and preservative, respectively. The rising awareness of water treatment solutions further propels demand for sodium silicate in water purification applications. However, the market faces certain restraints, including fluctuating raw material prices (silica and soda ash) and environmental concerns regarding its production process. The market is segmented by type (solid and liquid) and application (adhesives and paints, detergents, food preservation, precipitated silica, paper production, water treatment, and other applications like construction and metal casting). Major players like BASF SE, Evonik Industries AG, and PQ Corporation dominate the market, leveraging their established distribution networks and technological advancements to maintain their competitive edge. Regional analysis reveals significant growth potential in the Asia-Pacific region, driven primarily by China and India's expanding industrial sectors. North America and Europe also contribute substantially, with mature markets exhibiting steady growth fueled by innovation and technological advancements within the industry.
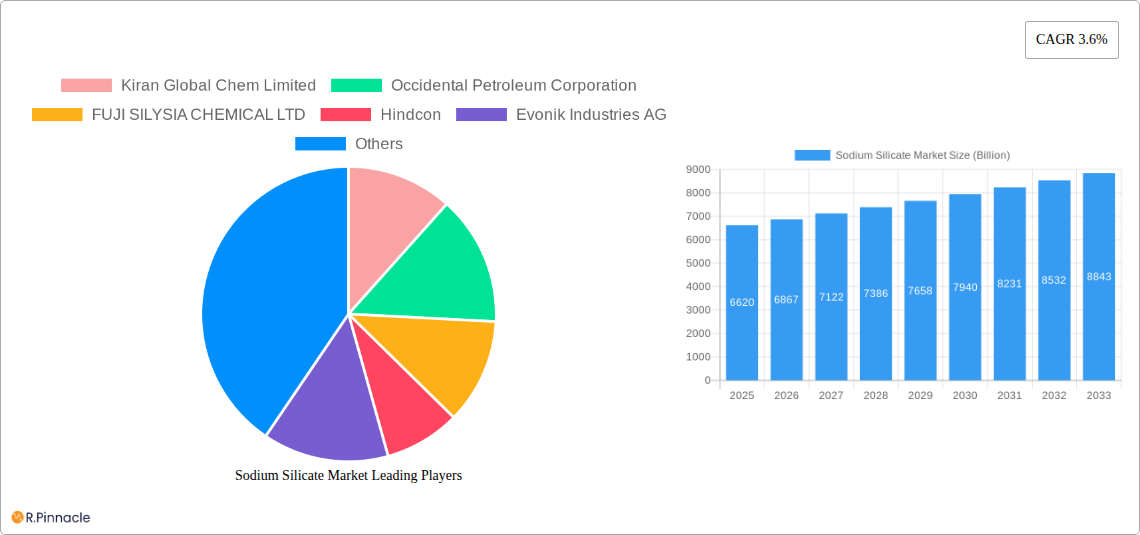
Sodium Silicate Market Market Size (In Billion)
The market's future hinges on technological innovations focused on sustainable production methods and the development of novel applications for sodium silicate. Manufacturers are actively exploring environmentally friendly alternatives and optimizing production processes to mitigate raw material price volatility and reduce environmental impact. The expanding use of sodium silicate in specialized applications, like in advanced ceramics and green building materials, presents new growth opportunities. Competition among existing players will likely intensify, driving innovation and potentially leading to mergers and acquisitions. The market's growth trajectory remains positive, with continued expansion predicted across various segments and geographical regions over the forecast period. Addressing environmental concerns and leveraging technological advancements will be crucial for sustained market success.
Sodium Silicate Market Company Market Share
Sodium Silicate Market: A Comprehensive Report (2019-2033)
This comprehensive report provides an in-depth analysis of the global Sodium Silicate Market, offering valuable insights for industry professionals, investors, and stakeholders. The report covers the period from 2019 to 2033, with a focus on the forecast period from 2025 to 2033, using 2025 as the base year. The market is projected to reach xx Billion by 2033, showcasing significant growth opportunities. This report delves into market structure, dynamics, key players, and future trends, providing actionable data to navigate the complexities of this thriving sector.
Sodium Silicate Market Market Structure & Innovation Trends
This section analyzes the competitive landscape of the Sodium Silicate market, examining market concentration, innovation drivers, regulatory influences, and significant M&A activities. The report assesses the market share held by key players such as Kiran Global Chem Limited, Occidental Petroleum Corporation, FUJI SILYSIA CHEMICAL LTD, Hindcon, Evonik Industries AG, Silmaco, BASF SE, PQ Corporation, Z Ch Rudniki S A, C THAI GROUP, Alumina doo Zvornik, W R Grace & Co -Conn, and CIECH Group. The analysis includes an examination of the market's consolidation level, identifying potential areas for future mergers and acquisitions (M&A). The total value of M&A deals in the sector during the historical period (2019-2024) is estimated at xx Billion. Furthermore, the report assesses the impact of government regulations, the presence of substitute products, and evolving end-user demographics on market dynamics. Innovation trends and their influence on market growth are also meticulously detailed, including the introduction of new production technologies and formulations.
Sodium Silicate Market Market Dynamics & Trends
This section provides a detailed analysis of the factors driving the growth of the Sodium Silicate market, including technological advancements, shifting consumer preferences, and competitive dynamics. The report projects a Compound Annual Growth Rate (CAGR) of xx% during the forecast period (2025-2033), driven by increasing demand from key application segments. The analysis encompasses an evaluation of market penetration rates across different regions and applications. Specific examples of technological advancements, like improved manufacturing processes resulting in higher purity and efficiency, and the impact of these advancements on market dynamics are highlighted. The competitive landscape is analyzed, identifying key players and their strategies for gaining market share. Consumer preferences are discussed, explaining the underlying factors influencing demand for Sodium Silicate in various end-use industries.
Dominant Regions & Segments in Sodium Silicate Market
This section identifies the leading regions and segments within the Sodium Silicate market. The report analyzes market dominance by geographic location, pinpointing specific countries with the highest market share. Similarly, it identifies the most significant segments based on type (Solid and Liquid) and application (Adhesives and Paints, Detergents, Food Preservation, Precipitated Silica, Paper Production, Water Treatment, Other Applications (Construction, Metal Casting)).
Key Drivers in Dominant Regions:
- Favorable economic policies and infrastructure investments.
- Growing construction and industrial activities.
- Stringent environmental regulations promoting sustainable solutions.
Dominant Segments Analysis: The detailed analysis will explain the reasons behind the dominance of specific segments in terms of market size and growth rate. For instance, the report might explain the high demand for liquid Sodium Silicate in the detergent industry due to its superior properties compared to solid Sodium Silicate in specific applications. Similarly, the report would explain the dominance of specific applications such as water treatment or adhesives and paints.
Sodium Silicate Market Product Innovations
Recent product developments in the Sodium Silicate market are reviewed, focusing on improvements in purity, functionality, and sustainability. The report showcases how these innovations address specific market needs and offer competitive advantages to manufacturers. The analysis also incorporates the exploration of emerging applications and the influence of technological advancements on market fit and overall market dynamics.
Report Scope & Segmentation Analysis
This report segments the Sodium Silicate market by type (Solid and Liquid) and application (Adhesives and Paints, Detergents, Food Preservation, Precipitated Silica, Paper Production, Water Treatment, and Other Applications). Each segment's growth projections, market size, and competitive dynamics are thoroughly analyzed. For instance, the "Adhesives and Paints" segment's analysis will include its projected market size, growth rate, and the competitive landscape within that specific segment. Similar individual analyses will be conducted for all segments.
Key Drivers of Sodium Silicate Market Growth
The growth of the Sodium Silicate market is propelled by several key factors. These include technological advancements leading to more efficient production methods, increasing demand from key application sectors like construction and water treatment due to rising urbanization and industrialization, and favorable government policies promoting sustainable industrial practices. Specific examples, such as the development of specialized grades of Sodium Silicate for improved performance in specific applications, will be cited to support the analysis.
Challenges in the Sodium Silicate Market Sector
The Sodium Silicate market faces several challenges, including fluctuating raw material prices, stringent environmental regulations impacting production processes, and intense competition from substitute materials. These challenges, and their quantifiable impacts on market growth and profitability, are discussed. For example, the impact of increased energy prices on the production cost of Sodium Silicate will be quantified.
Emerging Opportunities in Sodium Silicate Market
Despite challenges, the Sodium Silicate market presents several emerging opportunities. These include the expansion into new applications, the development of innovative formulations with improved performance characteristics, and the growing demand for environmentally friendly alternatives in various industries. Specific examples of these opportunities and their potential impact on market growth are discussed.
Leading Players in the Sodium Silicate Market Market
- Kiran Global Chem Limited
- Occidental Petroleum Corporation
- FUJI SILYSIA CHEMICAL LTD
- Hindcon
- Evonik Industries AG
- Silmaco
- BASF SE
- PQ Corporation
- Z Ch Rudniki S A
- C THAI GROUP
- Alumina doo Zvornik
- W R Grace & Co -Conn
- CIECH Group
Key Developments in Sodium Silicate Market Industry
- September 2022: Evonik Industries AG, a leading silica producer, announced a strategic cooperation with the Porner Group (Austria) and Phichit Bio Power Co., Ltd. (Thailand) to supply sustainable ULTRASIL precipitated silica to tire manufacturers. This development highlights the increasing focus on sustainable materials within the industry.
Future Outlook for Sodium Silicate Market Market
The Sodium Silicate market is poised for continued growth, driven by expanding application areas and advancements in product technology. The market's future potential is significant, presenting numerous strategic opportunities for companies to capitalize on. The report concludes with an outlook on potential future market trends and offers strategic recommendations for businesses operating in this sector.
Sodium Silicate Market Segmentation
-
1. Type
- 1.1. Solid
- 1.2. Liquid
-
2. Application
- 2.1. Adhesives and Paints
- 2.2. Detergents
- 2.3. Food Preservation
- 2.4. Precipitated Silica
- 2.5. Paper Production
- 2.6. Water Treatment
- 2.7. Other Applications (Construction, Metal Casting)
Sodium Silicate Market Segmentation By Geography
-
1. Asia Pacific
- 1.1. China
- 1.2. India
- 1.3. Japan
- 1.4. South Korea
- 1.5. Rest of Asia Pacific
-
2. North America
- 2.1. United States
- 2.2. Canada
- 2.3. Mexico
-
3. Europe
- 3.1. Germany
- 3.2. United Kingdom
- 3.3. Italy
- 3.4. France
- 3.5. Rest of Europe
-
4. South America
- 4.1. Brazil
- 4.2. Argentina
- 4.3. Rest of South America
-
5. Middle East and Africa
- 5.1. Saudi Arabia
- 5.2. South Africa
- 5.3. Rest of Middle East and Africa
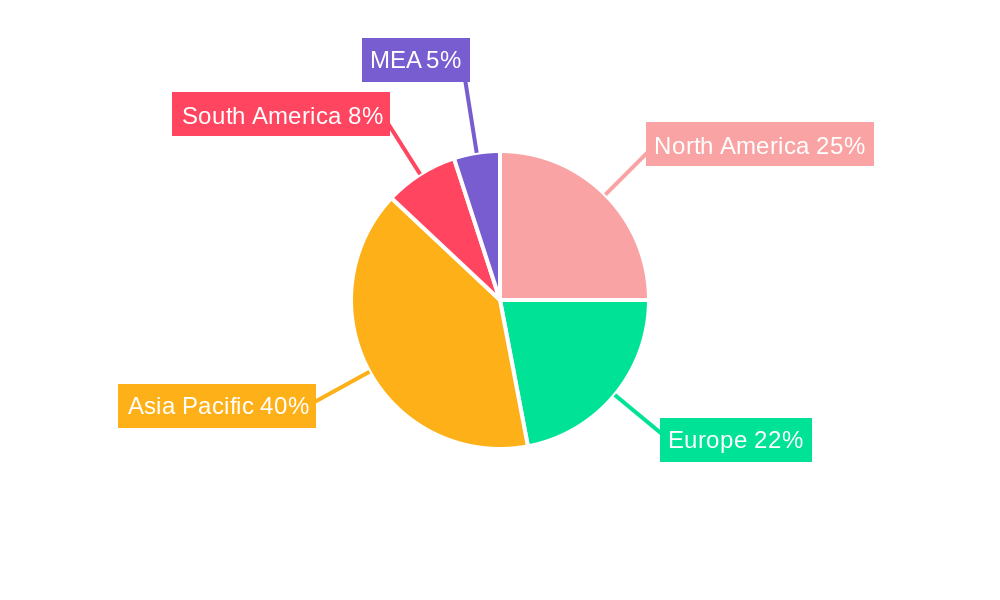
Sodium Silicate Market Regional Market Share
Geographic Coverage of Sodium Silicate Market
Sodium Silicate Market REPORT HIGHLIGHTS
| Aspects | Details |
|---|---|
| Study Period | 2020-2034 |
| Base Year | 2025 |
| Estimated Year | 2026 |
| Forecast Period | 2026-2034 |
| Historical Period | 2020-2025 |
| Growth Rate | CAGR of 3.6% from 2020-2034 |
| Segmentation |
|
Table of Contents
- 1. Introduction
- 1.1. Research Scope
- 1.2. Market Segmentation
- 1.3. Research Objective
- 1.4. Definitions and Assumptions
- 2. Executive Summary
- 2.1. Market Snapshot
- 3. Market Dynamics
- 3.1. Market Drivers
- 3.2. Market Restrains
- 3.3. Market Trends
- 3.4. Market Opportunities
- 4. Market Factor Analysis
- 4.1. Porters Five Forces
- 4.1.1. Bargaining Power of Suppliers
- 4.1.2. Bargaining Power of Buyers
- 4.1.3. Threat of New Entrants
- 4.1.4. Threat of Substitutes
- 4.1.5. Competitive Rivalry
- 4.2. PESTEL analysis
- 4.3. BCG Analysis
- 4.3.1. Stars (High Growth, High Market Share)
- 4.3.2. Cash Cows (Low Growth, High Market Share)
- 4.3.3. Question Mark (High Growth, Low Market Share)
- 4.3.4. Dogs (Low Growth, Low Market Share)
- 4.4. Ansoff Matrix Analysis
- 4.5. Supply Chain Analysis
- 4.6. Regulatory Landscape
- 4.7. Current Market Potential and Opportunity Assessment (TAM–SAM–SOM Framework)
- 4.8. PRI Analyst Note
- 4.1. Porters Five Forces
- 5. Market Analysis, Insights and Forecast 2021-2033
- 5.1. Market Analysis, Insights and Forecast - by Type
- 5.1.1. Solid
- 5.1.2. Liquid
- 5.2. Market Analysis, Insights and Forecast - by Application
- 5.2.1. Adhesives and Paints
- 5.2.2. Detergents
- 5.2.3. Food Preservation
- 5.2.4. Precipitated Silica
- 5.2.5. Paper Production
- 5.2.6. Water Treatment
- 5.2.7. Other Applications (Construction, Metal Casting)
- 5.3. Market Analysis, Insights and Forecast - by Region
- 5.3.1. Asia Pacific
- 5.3.2. North America
- 5.3.3. Europe
- 5.3.4. South America
- 5.3.5. Middle East and Africa
- 5.1. Market Analysis, Insights and Forecast - by Type
- 6. Global Sodium Silicate Market Analysis, Insights and Forecast, 2021-2033
- 6.1. Market Analysis, Insights and Forecast - by Type
- 6.1.1. Solid
- 6.1.2. Liquid
- 6.2. Market Analysis, Insights and Forecast - by Application
- 6.2.1. Adhesives and Paints
- 6.2.2. Detergents
- 6.2.3. Food Preservation
- 6.2.4. Precipitated Silica
- 6.2.5. Paper Production
- 6.2.6. Water Treatment
- 6.2.7. Other Applications (Construction, Metal Casting)
- 6.1. Market Analysis, Insights and Forecast - by Type
- 7. Asia Pacific Sodium Silicate Market Analysis, Insights and Forecast, 2020-2032
- 7.1. Market Analysis, Insights and Forecast - by Type
- 7.1.1. Solid
- 7.1.2. Liquid
- 7.2. Market Analysis, Insights and Forecast - by Application
- 7.2.1. Adhesives and Paints
- 7.2.2. Detergents
- 7.2.3. Food Preservation
- 7.2.4. Precipitated Silica
- 7.2.5. Paper Production
- 7.2.6. Water Treatment
- 7.2.7. Other Applications (Construction, Metal Casting)
- 7.1. Market Analysis, Insights and Forecast - by Type
- 8. North America Sodium Silicate Market Analysis, Insights and Forecast, 2020-2032
- 8.1. Market Analysis, Insights and Forecast - by Type
- 8.1.1. Solid
- 8.1.2. Liquid
- 8.2. Market Analysis, Insights and Forecast - by Application
- 8.2.1. Adhesives and Paints
- 8.2.2. Detergents
- 8.2.3. Food Preservation
- 8.2.4. Precipitated Silica
- 8.2.5. Paper Production
- 8.2.6. Water Treatment
- 8.2.7. Other Applications (Construction, Metal Casting)
- 8.1. Market Analysis, Insights and Forecast - by Type
- 9. Europe Sodium Silicate Market Analysis, Insights and Forecast, 2020-2032
- 9.1. Market Analysis, Insights and Forecast - by Type
- 9.1.1. Solid
- 9.1.2. Liquid
- 9.2. Market Analysis, Insights and Forecast - by Application
- 9.2.1. Adhesives and Paints
- 9.2.2. Detergents
- 9.2.3. Food Preservation
- 9.2.4. Precipitated Silica
- 9.2.5. Paper Production
- 9.2.6. Water Treatment
- 9.2.7. Other Applications (Construction, Metal Casting)
- 9.1. Market Analysis, Insights and Forecast - by Type
- 10. South America Sodium Silicate Market Analysis, Insights and Forecast, 2020-2032
- 10.1. Market Analysis, Insights and Forecast - by Type
- 10.1.1. Solid
- 10.1.2. Liquid
- 10.2. Market Analysis, Insights and Forecast - by Application
- 10.2.1. Adhesives and Paints
- 10.2.2. Detergents
- 10.2.3. Food Preservation
- 10.2.4. Precipitated Silica
- 10.2.5. Paper Production
- 10.2.6. Water Treatment
- 10.2.7. Other Applications (Construction, Metal Casting)
- 10.1. Market Analysis, Insights and Forecast - by Type
- 11. Middle East and Africa Sodium Silicate Market Analysis, Insights and Forecast, 2020-2032
- 11.1. Market Analysis, Insights and Forecast - by Type
- 11.1.1. Solid
- 11.1.2. Liquid
- 11.2. Market Analysis, Insights and Forecast - by Application
- 11.2.1. Adhesives and Paints
- 11.2.2. Detergents
- 11.2.3. Food Preservation
- 11.2.4. Precipitated Silica
- 11.2.5. Paper Production
- 11.2.6. Water Treatment
- 11.2.7. Other Applications (Construction, Metal Casting)
- 11.1. Market Analysis, Insights and Forecast - by Type
- 12. Competitive Analysis
- 12.1. Company Profiles
- 12.1.1 Kiran Global Chem Limited
- 12.1.1.1. Company Overview
- 12.1.1.2. Products
- 12.1.1.3. Company Financials
- 12.1.1.4. SWOT Analysis
- 12.1.2 Occidental Petroleum Corporation
- 12.1.2.1. Company Overview
- 12.1.2.2. Products
- 12.1.2.3. Company Financials
- 12.1.2.4. SWOT Analysis
- 12.1.3 FUJI SILYSIA CHEMICAL LTD
- 12.1.3.1. Company Overview
- 12.1.3.2. Products
- 12.1.3.3. Company Financials
- 12.1.3.4. SWOT Analysis
- 12.1.4 Hindcon
- 12.1.4.1. Company Overview
- 12.1.4.2. Products
- 12.1.4.3. Company Financials
- 12.1.4.4. SWOT Analysis
- 12.1.5 Evonik Industries AG
- 12.1.5.1. Company Overview
- 12.1.5.2. Products
- 12.1.5.3. Company Financials
- 12.1.5.4. SWOT Analysis
- 12.1.6 Silmaco
- 12.1.6.1. Company Overview
- 12.1.6.2. Products
- 12.1.6.3. Company Financials
- 12.1.6.4. SWOT Analysis
- 12.1.7 BASF SE
- 12.1.7.1. Company Overview
- 12.1.7.2. Products
- 12.1.7.3. Company Financials
- 12.1.7.4. SWOT Analysis
- 12.1.8 PQ Corporation
- 12.1.8.1. Company Overview
- 12.1.8.2. Products
- 12.1.8.3. Company Financials
- 12.1.8.4. SWOT Analysis
- 12.1.9 Z Ch Rudniki S A
- 12.1.9.1. Company Overview
- 12.1.9.2. Products
- 12.1.9.3. Company Financials
- 12.1.9.4. SWOT Analysis
- 12.1.10 C THAI GROUP
- 12.1.10.1. Company Overview
- 12.1.10.2. Products
- 12.1.10.3. Company Financials
- 12.1.10.4. SWOT Analysis
- 12.1.11 Alumina doo Zvornik
- 12.1.11.1. Company Overview
- 12.1.11.2. Products
- 12.1.11.3. Company Financials
- 12.1.11.4. SWOT Analysis
- 12.1.12 W R Grace & Co -Conn
- 12.1.12.1. Company Overview
- 12.1.12.2. Products
- 12.1.12.3. Company Financials
- 12.1.12.4. SWOT Analysis
- 12.1.13 CIECH Group
- 12.1.13.1. Company Overview
- 12.1.13.2. Products
- 12.1.13.3. Company Financials
- 12.1.13.4. SWOT Analysis
- 12.1.1 Kiran Global Chem Limited
- 12.2. Market Entropy
- 12.2.1 Company's Key Areas Served
- 12.2.2 Recent Developments
- 12.3. Company Market Share Analysis 2025
- 12.3.1 Top 5 Companies Market Share Analysis
- 12.3.2 Top 3 Companies Market Share Analysis
- 12.4. List of Potential Customers
- 13. Research Methodology
List of Figures
- Figure 1: Global Sodium Silicate Market Revenue Breakdown (Billion, %) by Region 2025 & 2033
- Figure 2: Global Sodium Silicate Market Volume Breakdown (K Tons, %) by Region 2025 & 2033
- Figure 3: Asia Pacific Sodium Silicate Market Revenue (Billion), by Type 2025 & 2033
- Figure 4: Asia Pacific Sodium Silicate Market Volume (K Tons), by Type 2025 & 2033
- Figure 5: Asia Pacific Sodium Silicate Market Revenue Share (%), by Type 2025 & 2033
- Figure 6: Asia Pacific Sodium Silicate Market Volume Share (%), by Type 2025 & 2033
- Figure 7: Asia Pacific Sodium Silicate Market Revenue (Billion), by Application 2025 & 2033
- Figure 8: Asia Pacific Sodium Silicate Market Volume (K Tons), by Application 2025 & 2033
- Figure 9: Asia Pacific Sodium Silicate Market Revenue Share (%), by Application 2025 & 2033
- Figure 10: Asia Pacific Sodium Silicate Market Volume Share (%), by Application 2025 & 2033
- Figure 11: Asia Pacific Sodium Silicate Market Revenue (Billion), by Country 2025 & 2033
- Figure 12: Asia Pacific Sodium Silicate Market Volume (K Tons), by Country 2025 & 2033
- Figure 13: Asia Pacific Sodium Silicate Market Revenue Share (%), by Country 2025 & 2033
- Figure 14: Asia Pacific Sodium Silicate Market Volume Share (%), by Country 2025 & 2033
- Figure 15: North America Sodium Silicate Market Revenue (Billion), by Type 2025 & 2033
- Figure 16: North America Sodium Silicate Market Volume (K Tons), by Type 2025 & 2033
- Figure 17: North America Sodium Silicate Market Revenue Share (%), by Type 2025 & 2033
- Figure 18: North America Sodium Silicate Market Volume Share (%), by Type 2025 & 2033
- Figure 19: North America Sodium Silicate Market Revenue (Billion), by Application 2025 & 2033
- Figure 20: North America Sodium Silicate Market Volume (K Tons), by Application 2025 & 2033
- Figure 21: North America Sodium Silicate Market Revenue Share (%), by Application 2025 & 2033
- Figure 22: North America Sodium Silicate Market Volume Share (%), by Application 2025 & 2033
- Figure 23: North America Sodium Silicate Market Revenue (Billion), by Country 2025 & 2033
- Figure 24: North America Sodium Silicate Market Volume (K Tons), by Country 2025 & 2033
- Figure 25: North America Sodium Silicate Market Revenue Share (%), by Country 2025 & 2033
- Figure 26: North America Sodium Silicate Market Volume Share (%), by Country 2025 & 2033
- Figure 27: Europe Sodium Silicate Market Revenue (Billion), by Type 2025 & 2033
- Figure 28: Europe Sodium Silicate Market Volume (K Tons), by Type 2025 & 2033
- Figure 29: Europe Sodium Silicate Market Revenue Share (%), by Type 2025 & 2033
- Figure 30: Europe Sodium Silicate Market Volume Share (%), by Type 2025 & 2033
- Figure 31: Europe Sodium Silicate Market Revenue (Billion), by Application 2025 & 2033
- Figure 32: Europe Sodium Silicate Market Volume (K Tons), by Application 2025 & 2033
- Figure 33: Europe Sodium Silicate Market Revenue Share (%), by Application 2025 & 2033
- Figure 34: Europe Sodium Silicate Market Volume Share (%), by Application 2025 & 2033
- Figure 35: Europe Sodium Silicate Market Revenue (Billion), by Country 2025 & 2033
- Figure 36: Europe Sodium Silicate Market Volume (K Tons), by Country 2025 & 2033
- Figure 37: Europe Sodium Silicate Market Revenue Share (%), by Country 2025 & 2033
- Figure 38: Europe Sodium Silicate Market Volume Share (%), by Country 2025 & 2033
- Figure 39: South America Sodium Silicate Market Revenue (Billion), by Type 2025 & 2033
- Figure 40: South America Sodium Silicate Market Volume (K Tons), by Type 2025 & 2033
- Figure 41: South America Sodium Silicate Market Revenue Share (%), by Type 2025 & 2033
- Figure 42: South America Sodium Silicate Market Volume Share (%), by Type 2025 & 2033
- Figure 43: South America Sodium Silicate Market Revenue (Billion), by Application 2025 & 2033
- Figure 44: South America Sodium Silicate Market Volume (K Tons), by Application 2025 & 2033
- Figure 45: South America Sodium Silicate Market Revenue Share (%), by Application 2025 & 2033
- Figure 46: South America Sodium Silicate Market Volume Share (%), by Application 2025 & 2033
- Figure 47: South America Sodium Silicate Market Revenue (Billion), by Country 2025 & 2033
- Figure 48: South America Sodium Silicate Market Volume (K Tons), by Country 2025 & 2033
- Figure 49: South America Sodium Silicate Market Revenue Share (%), by Country 2025 & 2033
- Figure 50: South America Sodium Silicate Market Volume Share (%), by Country 2025 & 2033
- Figure 51: Middle East and Africa Sodium Silicate Market Revenue (Billion), by Type 2025 & 2033
- Figure 52: Middle East and Africa Sodium Silicate Market Volume (K Tons), by Type 2025 & 2033
- Figure 53: Middle East and Africa Sodium Silicate Market Revenue Share (%), by Type 2025 & 2033
- Figure 54: Middle East and Africa Sodium Silicate Market Volume Share (%), by Type 2025 & 2033
- Figure 55: Middle East and Africa Sodium Silicate Market Revenue (Billion), by Application 2025 & 2033
- Figure 56: Middle East and Africa Sodium Silicate Market Volume (K Tons), by Application 2025 & 2033
- Figure 57: Middle East and Africa Sodium Silicate Market Revenue Share (%), by Application 2025 & 2033
- Figure 58: Middle East and Africa Sodium Silicate Market Volume Share (%), by Application 2025 & 2033
- Figure 59: Middle East and Africa Sodium Silicate Market Revenue (Billion), by Country 2025 & 2033
- Figure 60: Middle East and Africa Sodium Silicate Market Volume (K Tons), by Country 2025 & 2033
- Figure 61: Middle East and Africa Sodium Silicate Market Revenue Share (%), by Country 2025 & 2033
- Figure 62: Middle East and Africa Sodium Silicate Market Volume Share (%), by Country 2025 & 2033
List of Tables
- Table 1: Global Sodium Silicate Market Revenue Billion Forecast, by Type 2020 & 2033
- Table 2: Global Sodium Silicate Market Volume K Tons Forecast, by Type 2020 & 2033
- Table 3: Global Sodium Silicate Market Revenue Billion Forecast, by Application 2020 & 2033
- Table 4: Global Sodium Silicate Market Volume K Tons Forecast, by Application 2020 & 2033
- Table 5: Global Sodium Silicate Market Revenue Billion Forecast, by Region 2020 & 2033
- Table 6: Global Sodium Silicate Market Volume K Tons Forecast, by Region 2020 & 2033
- Table 7: Global Sodium Silicate Market Revenue Billion Forecast, by Type 2020 & 2033
- Table 8: Global Sodium Silicate Market Volume K Tons Forecast, by Type 2020 & 2033
- Table 9: Global Sodium Silicate Market Revenue Billion Forecast, by Application 2020 & 2033
- Table 10: Global Sodium Silicate Market Volume K Tons Forecast, by Application 2020 & 2033
- Table 11: Global Sodium Silicate Market Revenue Billion Forecast, by Country 2020 & 2033
- Table 12: Global Sodium Silicate Market Volume K Tons Forecast, by Country 2020 & 2033
- Table 13: China Sodium Silicate Market Revenue (Billion) Forecast, by Application 2020 & 2033
- Table 14: China Sodium Silicate Market Volume (K Tons) Forecast, by Application 2020 & 2033
- Table 15: India Sodium Silicate Market Revenue (Billion) Forecast, by Application 2020 & 2033
- Table 16: India Sodium Silicate Market Volume (K Tons) Forecast, by Application 2020 & 2033
- Table 17: Japan Sodium Silicate Market Revenue (Billion) Forecast, by Application 2020 & 2033
- Table 18: Japan Sodium Silicate Market Volume (K Tons) Forecast, by Application 2020 & 2033
- Table 19: South Korea Sodium Silicate Market Revenue (Billion) Forecast, by Application 2020 & 2033
- Table 20: South Korea Sodium Silicate Market Volume (K Tons) Forecast, by Application 2020 & 2033
- Table 21: Rest of Asia Pacific Sodium Silicate Market Revenue (Billion) Forecast, by Application 2020 & 2033
- Table 22: Rest of Asia Pacific Sodium Silicate Market Volume (K Tons) Forecast, by Application 2020 & 2033
- Table 23: Global Sodium Silicate Market Revenue Billion Forecast, by Type 2020 & 2033
- Table 24: Global Sodium Silicate Market Volume K Tons Forecast, by Type 2020 & 2033
- Table 25: Global Sodium Silicate Market Revenue Billion Forecast, by Application 2020 & 2033
- Table 26: Global Sodium Silicate Market Volume K Tons Forecast, by Application 2020 & 2033
- Table 27: Global Sodium Silicate Market Revenue Billion Forecast, by Country 2020 & 2033
- Table 28: Global Sodium Silicate Market Volume K Tons Forecast, by Country 2020 & 2033
- Table 29: United States Sodium Silicate Market Revenue (Billion) Forecast, by Application 2020 & 2033
- Table 30: United States Sodium Silicate Market Volume (K Tons) Forecast, by Application 2020 & 2033
- Table 31: Canada Sodium Silicate Market Revenue (Billion) Forecast, by Application 2020 & 2033
- Table 32: Canada Sodium Silicate Market Volume (K Tons) Forecast, by Application 2020 & 2033
- Table 33: Mexico Sodium Silicate Market Revenue (Billion) Forecast, by Application 2020 & 2033
- Table 34: Mexico Sodium Silicate Market Volume (K Tons) Forecast, by Application 2020 & 2033
- Table 35: Global Sodium Silicate Market Revenue Billion Forecast, by Type 2020 & 2033
- Table 36: Global Sodium Silicate Market Volume K Tons Forecast, by Type 2020 & 2033
- Table 37: Global Sodium Silicate Market Revenue Billion Forecast, by Application 2020 & 2033
- Table 38: Global Sodium Silicate Market Volume K Tons Forecast, by Application 2020 & 2033
- Table 39: Global Sodium Silicate Market Revenue Billion Forecast, by Country 2020 & 2033
- Table 40: Global Sodium Silicate Market Volume K Tons Forecast, by Country 2020 & 2033
- Table 41: Germany Sodium Silicate Market Revenue (Billion) Forecast, by Application 2020 & 2033
- Table 42: Germany Sodium Silicate Market Volume (K Tons) Forecast, by Application 2020 & 2033
- Table 43: United Kingdom Sodium Silicate Market Revenue (Billion) Forecast, by Application 2020 & 2033
- Table 44: United Kingdom Sodium Silicate Market Volume (K Tons) Forecast, by Application 2020 & 2033
- Table 45: Italy Sodium Silicate Market Revenue (Billion) Forecast, by Application 2020 & 2033
- Table 46: Italy Sodium Silicate Market Volume (K Tons) Forecast, by Application 2020 & 2033
- Table 47: France Sodium Silicate Market Revenue (Billion) Forecast, by Application 2020 & 2033
- Table 48: France Sodium Silicate Market Volume (K Tons) Forecast, by Application 2020 & 2033
- Table 49: Rest of Europe Sodium Silicate Market Revenue (Billion) Forecast, by Application 2020 & 2033
- Table 50: Rest of Europe Sodium Silicate Market Volume (K Tons) Forecast, by Application 2020 & 2033
- Table 51: Global Sodium Silicate Market Revenue Billion Forecast, by Type 2020 & 2033
- Table 52: Global Sodium Silicate Market Volume K Tons Forecast, by Type 2020 & 2033
- Table 53: Global Sodium Silicate Market Revenue Billion Forecast, by Application 2020 & 2033
- Table 54: Global Sodium Silicate Market Volume K Tons Forecast, by Application 2020 & 2033
- Table 55: Global Sodium Silicate Market Revenue Billion Forecast, by Country 2020 & 2033
- Table 56: Global Sodium Silicate Market Volume K Tons Forecast, by Country 2020 & 2033
- Table 57: Brazil Sodium Silicate Market Revenue (Billion) Forecast, by Application 2020 & 2033
- Table 58: Brazil Sodium Silicate Market Volume (K Tons) Forecast, by Application 2020 & 2033
- Table 59: Argentina Sodium Silicate Market Revenue (Billion) Forecast, by Application 2020 & 2033
- Table 60: Argentina Sodium Silicate Market Volume (K Tons) Forecast, by Application 2020 & 2033
- Table 61: Rest of South America Sodium Silicate Market Revenue (Billion) Forecast, by Application 2020 & 2033
- Table 62: Rest of South America Sodium Silicate Market Volume (K Tons) Forecast, by Application 2020 & 2033
- Table 63: Global Sodium Silicate Market Revenue Billion Forecast, by Type 2020 & 2033
- Table 64: Global Sodium Silicate Market Volume K Tons Forecast, by Type 2020 & 2033
- Table 65: Global Sodium Silicate Market Revenue Billion Forecast, by Application 2020 & 2033
- Table 66: Global Sodium Silicate Market Volume K Tons Forecast, by Application 2020 & 2033
- Table 67: Global Sodium Silicate Market Revenue Billion Forecast, by Country 2020 & 2033
- Table 68: Global Sodium Silicate Market Volume K Tons Forecast, by Country 2020 & 2033
- Table 69: Saudi Arabia Sodium Silicate Market Revenue (Billion) Forecast, by Application 2020 & 2033
- Table 70: Saudi Arabia Sodium Silicate Market Volume (K Tons) Forecast, by Application 2020 & 2033
- Table 71: South Africa Sodium Silicate Market Revenue (Billion) Forecast, by Application 2020 & 2033
- Table 72: South Africa Sodium Silicate Market Volume (K Tons) Forecast, by Application 2020 & 2033
- Table 73: Rest of Middle East and Africa Sodium Silicate Market Revenue (Billion) Forecast, by Application 2020 & 2033
- Table 74: Rest of Middle East and Africa Sodium Silicate Market Volume (K Tons) Forecast, by Application 2020 & 2033
Frequently Asked Questions
1. What is the projected Compound Annual Growth Rate (CAGR) of the Sodium Silicate Market?
The projected CAGR is approximately 3.6%.
2. Which companies are prominent players in the Sodium Silicate Market?
Key companies in the market include Kiran Global Chem Limited, Occidental Petroleum Corporation, FUJI SILYSIA CHEMICAL LTD, Hindcon, Evonik Industries AG, Silmaco, BASF SE, PQ Corporation, Z Ch Rudniki S A, C THAI GROUP, Alumina doo Zvornik, W R Grace & Co -Conn, CIECH Group.
3. What are the main segments of the Sodium Silicate Market?
The market segments include Type, Application.
4. Can you provide details about the market size?
The market size is estimated to be USD 6.62 Billion as of 2022.
5. What are some drivers contributing to market growth?
Increasing Demand for Waste Paper Recycling; Rising Demand for Precipitated Silica from the Rubber and Tyre Industry; Other Drivers.
6. What are the notable trends driving market growth?
Detergents Segment to Witness Healthy Demand.
7. Are there any restraints impacting market growth?
Hazardous Effects of Sodium Silicate; Other Restraints.
8. Can you provide examples of recent developments in the market?
September 2022: Evonik, one of the world's leading silica producers, has entered a strategic cooperation with the Porner Group, Austria and Phichit Bio Power Co., Ltd., Thailand, to supply sustainable ULTRASIL precipitated silica to tire manufacturers.
9. What pricing options are available for accessing the report?
Pricing options include single-user, multi-user, and enterprise licenses priced at USD 4750, USD 5250, and USD 8750 respectively.
10. Is the market size provided in terms of value or volume?
The market size is provided in terms of value, measured in Billion and volume, measured in K Tons.
11. Are there any specific market keywords associated with the report?
Yes, the market keyword associated with the report is "Sodium Silicate Market," which aids in identifying and referencing the specific market segment covered.
12. How do I determine which pricing option suits my needs best?
The pricing options vary based on user requirements and access needs. Individual users may opt for single-user licenses, while businesses requiring broader access may choose multi-user or enterprise licenses for cost-effective access to the report.
13. Are there any additional resources or data provided in the Sodium Silicate Market report?
While the report offers comprehensive insights, it's advisable to review the specific contents or supplementary materials provided to ascertain if additional resources or data are available.
14. How can I stay updated on further developments or reports in the Sodium Silicate Market?
To stay informed about further developments, trends, and reports in the Sodium Silicate Market, consider subscribing to industry newsletters, following relevant companies and organizations, or regularly checking reputable industry news sources and publications.
Methodology
Step 1 - Identification of Relevant Samples Size from Population Database


Step 2 - Approaches for Defining Global Market Size (Value, Volume* & Price*)

Note*: In applicable scenarios
Step 3 - Data Sources
Primary Research
- Web Analytics
- Survey Reports
- Research Institute
- Latest Research Reports
- Opinion Leaders
Secondary Research
- Annual Reports
- White Paper
- Latest Press Release
- Industry Association
- Paid Database
- Investor Presentations

Step 4 - Data Triangulation
Involves using different sources of information in order to increase the validity of a study
These sources are likely to be stakeholders in a program - participants, other researchers, program staff, other community members, and so on.
Then we put all data in single framework & apply various statistical tools to find out the dynamic on the market.
During the analysis stage, feedback from the stakeholder groups would be compared to determine areas of agreement as well as areas of divergence