

Key Insights
The global soft contact lens market is poised for substantial expansion, projected to achieve a Compound Annual Growth Rate (CAGR) of 6.21%. This growth is driven by a confluence of factors including the rising incidence of refractive errors, increasing disposable incomes, and heightened consumer awareness regarding vision correction solutions. Advancements in lens technology, such as the development of superior silicone hydrogel lenses offering enhanced oxygen permeability, further stimulate market demand. The expanding e-commerce landscape also contributes significantly by providing consumers with convenient access and competitive pricing. Despite potential challenges like the risk of eye infections and the cost of premium lenses, the overall market outlook remains robust. Corrective contact lenses constitute the largest market segment, reflecting their primary role in vision correction. While spectacle stores remain a key distribution channel, online retailers are experiencing considerable growth, indicating a shift in consumer purchasing behavior. Key industry players, including Johnson & Johnson Vision Care, CooperVision, and Alcon (Novartis), are actively shaping the market through product innovation and strategic acquisitions.
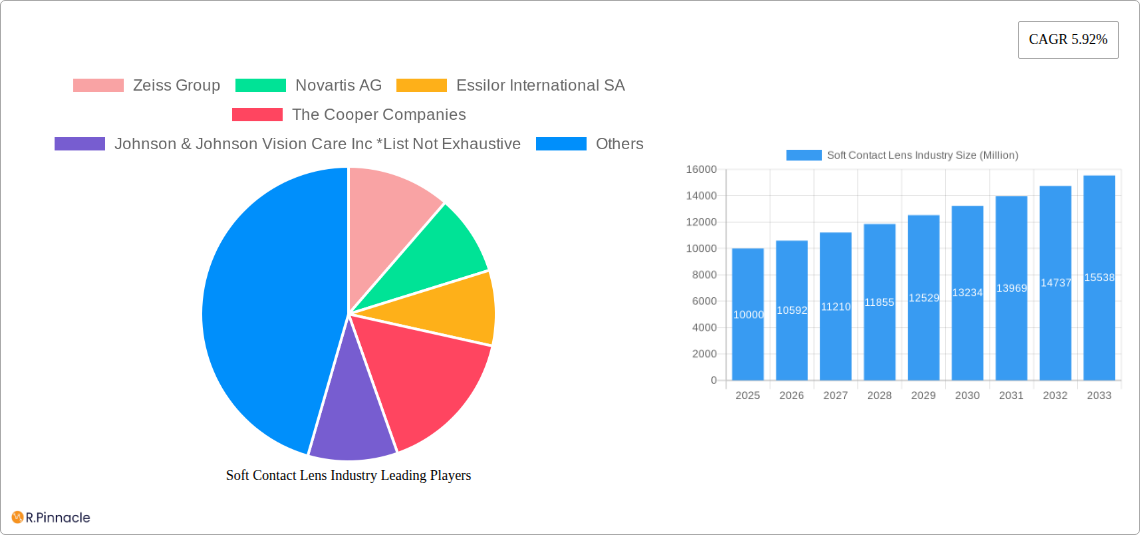
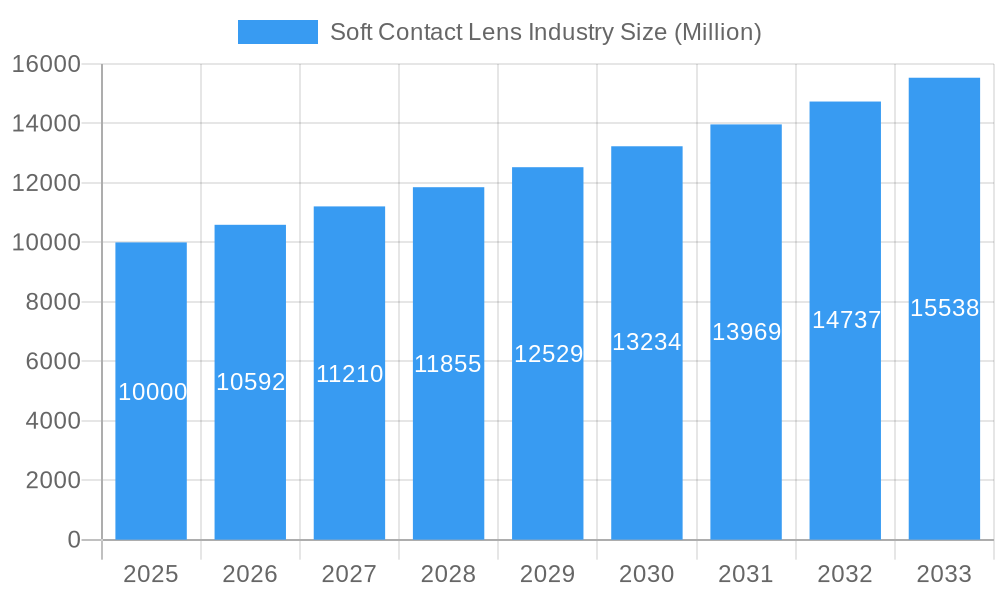
Soft Contact Lens Industry Market Size (In Billion)
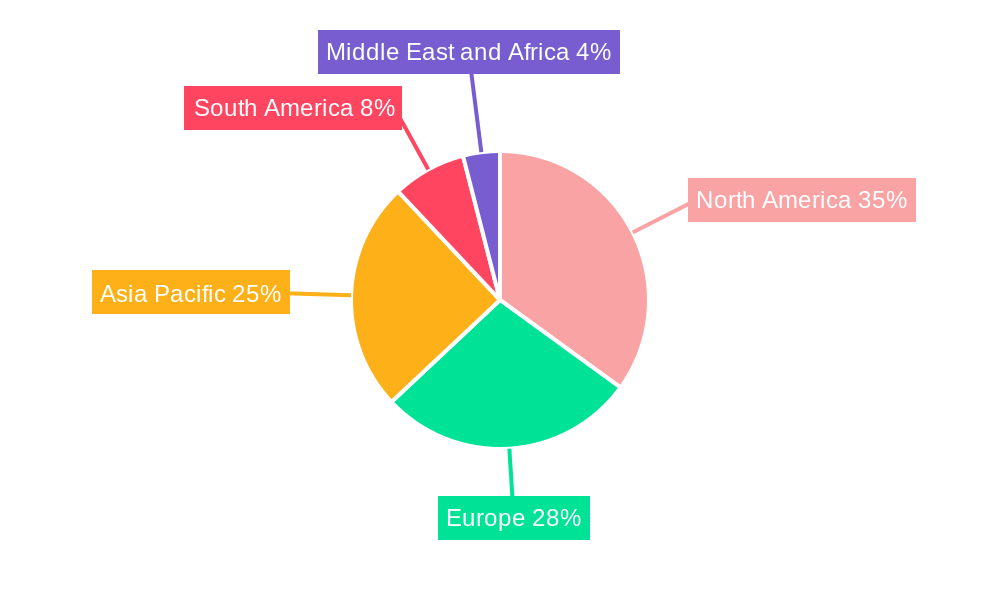
Regional market dynamics will vary. North America and Europe, supported by developed healthcare systems and higher disposable incomes, are expected to retain significant market shares. Conversely, emerging economies in the Asia-Pacific region, particularly China and India, are anticipated to exhibit accelerated growth rates, driven by their expanding middle classes and increasing adoption of contact lenses. The growing preference for daily disposable soft contact lenses, attributed to their superior hygiene and convenience, is a notable trend influencing market dynamics. Future growth hinges on sustained innovation in lens materials, enhanced comfort features, and the development of advanced lenses to address specific vision impairments. Consumer education on proper lens care and hygiene is crucial for mitigating infection risks. Intense competition among established and emerging players will continue to drive product innovation and influence pricing strategies.
Soft Contact Lens Industry Company Market Share
Soft Contact Lens Industry Market Report: 2019-2033
This comprehensive report provides an in-depth analysis of the global soft contact lens industry, offering crucial insights for industry professionals, investors, and strategists. Covering the period from 2019 to 2033, with a focus on 2025, this report unveils market dynamics, trends, and future projections, empowering informed decision-making. The market is valued at $XX Million in 2025 and is projected to reach $XX Million by 2033, exhibiting a CAGR of XX%.
Soft Contact Lens Industry Market Structure & Innovation Trends
The global soft contact lens market is moderately concentrated, with key players like Zeiss Group, Novartis AG, Essilor International SA, The Cooper Companies, Johnson & Johnson Vision Care Inc, Bausch Health Companies Inc, and Hoya Corporation holding significant market share. Market share distribution fluctuates, with the top 5 companies holding approximately 60% of the market in 2025. Innovation is driven by advancements in material science (e.g., silicone hydrogel lenses for increased oxygen permeability), lens designs (e.g., toric lenses for astigmatism correction), and digital technologies (e.g., personalized lens fitting using 3D scanning). Regulatory frameworks concerning lens safety and efficacy significantly influence market operations. Substitutes include eyeglasses and refractive surgeries (LASIK). The end-user demographic skews towards the 25-55 age group, with a growing elderly segment driving demand for specific lens designs. M&A activity has been moderate in recent years, with deal values averaging $XX Million per transaction. Key examples include [Insert Specific M&A example if available, otherwise omit].
- Market Concentration: Moderately concentrated, top 5 players holding ~60% market share (2025).
- Innovation Drivers: Material science, lens design, and digital technologies.
- Regulatory Framework: Stringent regulations regarding safety and efficacy.
- Product Substitutes: Eyeglasses, refractive surgeries.
- End-User Demographics: Primarily 25-55 age group, growing elderly segment.
- M&A Activity: Moderate, average deal value ~$XX Million (2019-2024).
Soft Contact Lens Industry Market Dynamics & Trends
The soft contact lens market is experiencing robust growth, driven by increasing myopia prevalence, rising disposable income, and growing awareness of vision correction options. Technological disruptions, such as the development of daily disposable lenses and smart lenses, are reshaping the market landscape. Consumer preferences are shifting towards convenient and comfortable options, such as daily disposable lenses and those with UV protection. Competitive dynamics are characterized by intense rivalry among major players, with a focus on product innovation, brand building, and strategic partnerships. The market penetration rate of soft contact lenses is approximately XX% globally (2025), with potential for further growth in emerging markets.
The CAGR for the forecast period (2025-2033) is projected at XX%, indicating significant expansion. This growth is largely fueled by several factors, including:
- The increasing prevalence of vision impairment globally.
- The rising disposable incomes in developing economies.
- The growing awareness among consumers about contact lenses as a viable vision correction option.
- The technological advancements in lens materials, designs, and manufacturing processes.
- The increasing demand for daily disposable lenses due to their convenience and hygiene benefits.
Dominant Regions & Segments in Soft Contact Lens Industry
North America currently dominates the soft contact lens market, followed by Europe and Asia-Pacific. Within North America, the US holds the largest market share. Key drivers include robust healthcare infrastructure, high disposable income, and widespread awareness of vision correction options. In Europe, high adoption rates and a developed healthcare system contribute to its strong performance. Asia-Pacific is experiencing rapid growth due to rising disposable incomes and an expanding middle class.
Dominant Segments:
- Product Type: Soft contact lenses constitute the largest segment, driven by their comfort and affordability.
- Usage: Corrective contact lenses represent the dominant usage segment.
- Distribution Channel: Spectacle stores retain a dominant share, while online stores are experiencing significant growth.
Key Drivers by Region:
- North America: Developed healthcare infrastructure, high disposable incomes, and high awareness.
- Europe: High adoption rates, developed healthcare systems.
- Asia-Pacific: Rising disposable incomes, expanding middle class, increasing awareness.
Soft Contact Lens Industry Product Innovations
Recent innovations focus on enhanced comfort, improved oxygen permeability, and extended wear capabilities. Silicone hydrogel lenses provide superior oxygen transmissibility, minimizing corneal hypoxia. Daily disposable lenses offer convenience and hygiene benefits, while multifocal lenses cater to presbyopia. Smart lenses with integrated health monitoring features are emerging. These innovations cater to evolving consumer preferences and enhance the overall user experience.
Report Scope & Segmentation Analysis
This report segments the soft contact lens market by product type (soft contact lenses, hybrid contact lenses, rigid gas permeable contact lenses, others), usage (corrective contact lenses, therapeutic contact lenses, other usages), and distribution channel (spectacle stores, online stores, other channels). Each segment is analyzed based on its historical performance, current market size, and future growth projections. Competitive dynamics within each segment are also examined. Growth projections vary across segments, with the daily disposable soft contact lens segment expected to experience the highest growth rate.
Key Drivers of Soft Contact Lens Industry Growth
Technological advancements in lens materials and designs, increasing prevalence of myopia and other refractive errors, rising disposable incomes, and growing awareness of vision correction options are key growth drivers. The development of convenient and comfortable lenses like daily disposables has significantly expanded market penetration. Favorable regulatory environments in several regions also contribute to market expansion.
Challenges in the Soft Contact Lens Industry Sector
Regulatory hurdles and stringent quality control requirements pose challenges. Supply chain disruptions can affect product availability and pricing. Intense competition among established players and the emergence of new entrants create price pressures. Fluctuations in raw material costs impact profitability. Consumer safety concerns related to lens hygiene and improper usage present an ongoing challenge.
Emerging Opportunities in Soft Contact Lens Industry
Expansion into emerging markets with high unmet needs, personalized lens fitting using advanced technologies, and development of smart lenses with integrated health monitoring capabilities present lucrative opportunities. Focus on innovative lens materials to enhance comfort and oxygen transmissibility, and the integration of telehealth platforms for remote patient monitoring, will open up further avenues of growth.
Leading Players in the Soft Contact Lens Industry Market
- Zeiss Group
- Novartis AG
- Essilor International SA
- The Cooper Companies
- Johnson & Johnson Vision Care Inc
- Bausch Health Companies Inc
- Hoya Corporation
Key Developments in Soft Contact Lens Industry Industry
- 2022 Q4: Johnson & Johnson Vision launched a new daily disposable lens.
- 2023 Q1: Zeiss Group announced a strategic partnership for lens distribution.
- 2023 Q2: [Insert another key development, with date and details]
Future Outlook for Soft Contact Lens Industry Market
The soft contact lens market is poised for sustained growth, driven by technological advancements, expanding consumer base, and increased awareness. Strategic partnerships, investments in R&D, and focus on personalized solutions will be crucial for success in this dynamic market. The focus on sustainable and eco-friendly materials will also play a significant role.
Soft Contact Lens Industry Segmentation
-
1. Product Type
- 1.1. Soft Contact Lens
- 1.2. Hybrid Contact Lens
- 1.3. Rigid Gas Permeable Contact Lens
- 1.4. Others
-
2. Usages
- 2.1. Corrective Contact Lens
- 2.2. Therapeutic Contact Lens
- 2.3. Other Usages
-
3. Distribution Channel
- 3.1. Spectacle Stores
- 3.2. Online Stores
- 3.3. Other channel
Soft Contact Lens Industry Segmentation By Geography
-
1. North America
- 1.1. United States
- 1.2. Canada
- 1.3. Mexico
- 1.4. Rest of North America
-
2. Europe
- 2.1. United Kingdom
- 2.2. Germany
- 2.3. France
- 2.4. Italy
- 2.5. Russia
- 2.6. Rest of Europe
-
3. Asia Pacific
- 3.1. China
- 3.2. Japan
- 3.3. India
- 3.4. Australia
- 3.5. Rest of Asia Pacific
-
4. South America
- 4.1. Brazil
- 4.2. Argentina
- 4.3. Rest of South America
-
5. Middle East and Africa
- 5.1. South Africa
- 5.2. United Arab Emirates
- 5.3. Rest of Middle East and Africa
Soft Contact Lens Industry Regional Market Share
Geographic Coverage of Soft Contact Lens Industry
Soft Contact Lens Industry REPORT HIGHLIGHTS
| Aspects | Details |
|---|---|
| Study Period | 2020-2034 |
| Base Year | 2025 |
| Estimated Year | 2026 |
| Forecast Period | 2026-2034 |
| Historical Period | 2020-2025 |
| Growth Rate | CAGR of 6.21% from 2020-2034 |
| Segmentation |
|
Table of Contents
- 1. Introduction
- 1.1. Research Scope
- 1.2. Market Segmentation
- 1.3. Research Objective
- 1.4. Definitions and Assumptions
- 2. Executive Summary
- 2.1. Market Snapshot
- 3. Market Dynamics
- 3.1. Market Drivers
- 3.2. Market Restrains
- 3.3. Market Trends
- 3.4. Market Opportunities
- 4. Market Factor Analysis
- 4.1. Porters Five Forces
- 4.1.1. Bargaining Power of Suppliers
- 4.1.2. Bargaining Power of Buyers
- 4.1.3. Threat of New Entrants
- 4.1.4. Threat of Substitutes
- 4.1.5. Competitive Rivalry
- 4.2. PESTEL analysis
- 4.3. BCG Analysis
- 4.3.1. Stars (High Growth, High Market Share)
- 4.3.2. Cash Cows (Low Growth, High Market Share)
- 4.3.3. Question Mark (High Growth, Low Market Share)
- 4.3.4. Dogs (Low Growth, Low Market Share)
- 4.4. Ansoff Matrix Analysis
- 4.5. Supply Chain Analysis
- 4.6. Regulatory Landscape
- 4.7. Current Market Potential and Opportunity Assessment (TAM–SAM–SOM Framework)
- 4.8. PRI Analyst Note
- 4.1. Porters Five Forces
- 5. Market Analysis, Insights and Forecast 2021-2033
- 5.1. Market Analysis, Insights and Forecast - by Product Type
- 5.1.1. Soft Contact Lens
- 5.1.2. Hybrid Contact Lens
- 5.1.3. Rigid Gas Permeable Contact Lens
- 5.1.4. Others
- 5.2. Market Analysis, Insights and Forecast - by Usages
- 5.2.1. Corrective Contact Lens
- 5.2.2. Therapeutic Contact Lens
- 5.2.3. Other Usages
- 5.3. Market Analysis, Insights and Forecast - by Distribution Channel
- 5.3.1. Spectacle Stores
- 5.3.2. Online Stores
- 5.3.3. Other channel
- 5.4. Market Analysis, Insights and Forecast - by Region
- 5.4.1. North America
- 5.4.2. Europe
- 5.4.3. Asia Pacific
- 5.4.4. South America
- 5.4.5. Middle East and Africa
- 5.1. Market Analysis, Insights and Forecast - by Product Type
- 6. Global Soft Contact Lens Industry Analysis, Insights and Forecast, 2021-2033
- 6.1. Market Analysis, Insights and Forecast - by Product Type
- 6.1.1. Soft Contact Lens
- 6.1.2. Hybrid Contact Lens
- 6.1.3. Rigid Gas Permeable Contact Lens
- 6.1.4. Others
- 6.2. Market Analysis, Insights and Forecast - by Usages
- 6.2.1. Corrective Contact Lens
- 6.2.2. Therapeutic Contact Lens
- 6.2.3. Other Usages
- 6.3. Market Analysis, Insights and Forecast - by Distribution Channel
- 6.3.1. Spectacle Stores
- 6.3.2. Online Stores
- 6.3.3. Other channel
- 6.1. Market Analysis, Insights and Forecast - by Product Type
- 7. North America Soft Contact Lens Industry Analysis, Insights and Forecast, 2020-2032
- 7.1. Market Analysis, Insights and Forecast - by Product Type
- 7.1.1. Soft Contact Lens
- 7.1.2. Hybrid Contact Lens
- 7.1.3. Rigid Gas Permeable Contact Lens
- 7.1.4. Others
- 7.2. Market Analysis, Insights and Forecast - by Usages
- 7.2.1. Corrective Contact Lens
- 7.2.2. Therapeutic Contact Lens
- 7.2.3. Other Usages
- 7.3. Market Analysis, Insights and Forecast - by Distribution Channel
- 7.3.1. Spectacle Stores
- 7.3.2. Online Stores
- 7.3.3. Other channel
- 7.1. Market Analysis, Insights and Forecast - by Product Type
- 8. Europe Soft Contact Lens Industry Analysis, Insights and Forecast, 2020-2032
- 8.1. Market Analysis, Insights and Forecast - by Product Type
- 8.1.1. Soft Contact Lens
- 8.1.2. Hybrid Contact Lens
- 8.1.3. Rigid Gas Permeable Contact Lens
- 8.1.4. Others
- 8.2. Market Analysis, Insights and Forecast - by Usages
- 8.2.1. Corrective Contact Lens
- 8.2.2. Therapeutic Contact Lens
- 8.2.3. Other Usages
- 8.3. Market Analysis, Insights and Forecast - by Distribution Channel
- 8.3.1. Spectacle Stores
- 8.3.2. Online Stores
- 8.3.3. Other channel
- 8.1. Market Analysis, Insights and Forecast - by Product Type
- 9. Asia Pacific Soft Contact Lens Industry Analysis, Insights and Forecast, 2020-2032
- 9.1. Market Analysis, Insights and Forecast - by Product Type
- 9.1.1. Soft Contact Lens
- 9.1.2. Hybrid Contact Lens
- 9.1.3. Rigid Gas Permeable Contact Lens
- 9.1.4. Others
- 9.2. Market Analysis, Insights and Forecast - by Usages
- 9.2.1. Corrective Contact Lens
- 9.2.2. Therapeutic Contact Lens
- 9.2.3. Other Usages
- 9.3. Market Analysis, Insights and Forecast - by Distribution Channel
- 9.3.1. Spectacle Stores
- 9.3.2. Online Stores
- 9.3.3. Other channel
- 9.1. Market Analysis, Insights and Forecast - by Product Type
- 10. South America Soft Contact Lens Industry Analysis, Insights and Forecast, 2020-2032
- 10.1. Market Analysis, Insights and Forecast - by Product Type
- 10.1.1. Soft Contact Lens
- 10.1.2. Hybrid Contact Lens
- 10.1.3. Rigid Gas Permeable Contact Lens
- 10.1.4. Others
- 10.2. Market Analysis, Insights and Forecast - by Usages
- 10.2.1. Corrective Contact Lens
- 10.2.2. Therapeutic Contact Lens
- 10.2.3. Other Usages
- 10.3. Market Analysis, Insights and Forecast - by Distribution Channel
- 10.3.1. Spectacle Stores
- 10.3.2. Online Stores
- 10.3.3. Other channel
- 10.1. Market Analysis, Insights and Forecast - by Product Type
- 11. Middle East and Africa Soft Contact Lens Industry Analysis, Insights and Forecast, 2020-2032
- 11.1. Market Analysis, Insights and Forecast - by Product Type
- 11.1.1. Soft Contact Lens
- 11.1.2. Hybrid Contact Lens
- 11.1.3. Rigid Gas Permeable Contact Lens
- 11.1.4. Others
- 11.2. Market Analysis, Insights and Forecast - by Usages
- 11.2.1. Corrective Contact Lens
- 11.2.2. Therapeutic Contact Lens
- 11.2.3. Other Usages
- 11.3. Market Analysis, Insights and Forecast - by Distribution Channel
- 11.3.1. Spectacle Stores
- 11.3.2. Online Stores
- 11.3.3. Other channel
- 11.1. Market Analysis, Insights and Forecast - by Product Type
- 12. Competitive Analysis
- 12.1. Company Profiles
- 12.1.1 Zeiss Group
- 12.1.1.1. Company Overview
- 12.1.1.2. Products
- 12.1.1.3. Company Financials
- 12.1.1.4. SWOT Analysis
- 12.1.2 Novartis AG
- 12.1.2.1. Company Overview
- 12.1.2.2. Products
- 12.1.2.3. Company Financials
- 12.1.2.4. SWOT Analysis
- 12.1.3 Essilor International SA
- 12.1.3.1. Company Overview
- 12.1.3.2. Products
- 12.1.3.3. Company Financials
- 12.1.3.4. SWOT Analysis
- 12.1.4 The Cooper Companies
- 12.1.4.1. Company Overview
- 12.1.4.2. Products
- 12.1.4.3. Company Financials
- 12.1.4.4. SWOT Analysis
- 12.1.5 Johnson & Johnson Vision Care Inc *List Not Exhaustive
- 12.1.5.1. Company Overview
- 12.1.5.2. Products
- 12.1.5.3. Company Financials
- 12.1.5.4. SWOT Analysis
- 12.1.6 Bausch Health Companies Inc
- 12.1.6.1. Company Overview
- 12.1.6.2. Products
- 12.1.6.3. Company Financials
- 12.1.6.4. SWOT Analysis
- 12.1.7 Hoya Corporation
- 12.1.7.1. Company Overview
- 12.1.7.2. Products
- 12.1.7.3. Company Financials
- 12.1.7.4. SWOT Analysis
- 12.1.1 Zeiss Group
- 12.2. Market Entropy
- 12.2.1 Company's Key Areas Served
- 12.2.2 Recent Developments
- 12.3. Company Market Share Analysis 2025
- 12.3.1 Top 5 Companies Market Share Analysis
- 12.3.2 Top 3 Companies Market Share Analysis
- 12.4. List of Potential Customers
- 13. Research Methodology
List of Figures
- Figure 1: Global Soft Contact Lens Industry Revenue Breakdown (billion, %) by Region 2025 & 2033
- Figure 2: Global Soft Contact Lens Industry Volume Breakdown (K Units, %) by Region 2025 & 2033
- Figure 3: North America Soft Contact Lens Industry Revenue (billion), by Product Type 2025 & 2033
- Figure 4: North America Soft Contact Lens Industry Volume (K Units), by Product Type 2025 & 2033
- Figure 5: North America Soft Contact Lens Industry Revenue Share (%), by Product Type 2025 & 2033
- Figure 6: North America Soft Contact Lens Industry Volume Share (%), by Product Type 2025 & 2033
- Figure 7: North America Soft Contact Lens Industry Revenue (billion), by Usages 2025 & 2033
- Figure 8: North America Soft Contact Lens Industry Volume (K Units), by Usages 2025 & 2033
- Figure 9: North America Soft Contact Lens Industry Revenue Share (%), by Usages 2025 & 2033
- Figure 10: North America Soft Contact Lens Industry Volume Share (%), by Usages 2025 & 2033
- Figure 11: North America Soft Contact Lens Industry Revenue (billion), by Distribution Channel 2025 & 2033
- Figure 12: North America Soft Contact Lens Industry Volume (K Units), by Distribution Channel 2025 & 2033
- Figure 13: North America Soft Contact Lens Industry Revenue Share (%), by Distribution Channel 2025 & 2033
- Figure 14: North America Soft Contact Lens Industry Volume Share (%), by Distribution Channel 2025 & 2033
- Figure 15: North America Soft Contact Lens Industry Revenue (billion), by Country 2025 & 2033
- Figure 16: North America Soft Contact Lens Industry Volume (K Units), by Country 2025 & 2033
- Figure 17: North America Soft Contact Lens Industry Revenue Share (%), by Country 2025 & 2033
- Figure 18: North America Soft Contact Lens Industry Volume Share (%), by Country 2025 & 2033
- Figure 19: Europe Soft Contact Lens Industry Revenue (billion), by Product Type 2025 & 2033
- Figure 20: Europe Soft Contact Lens Industry Volume (K Units), by Product Type 2025 & 2033
- Figure 21: Europe Soft Contact Lens Industry Revenue Share (%), by Product Type 2025 & 2033
- Figure 22: Europe Soft Contact Lens Industry Volume Share (%), by Product Type 2025 & 2033
- Figure 23: Europe Soft Contact Lens Industry Revenue (billion), by Usages 2025 & 2033
- Figure 24: Europe Soft Contact Lens Industry Volume (K Units), by Usages 2025 & 2033
- Figure 25: Europe Soft Contact Lens Industry Revenue Share (%), by Usages 2025 & 2033
- Figure 26: Europe Soft Contact Lens Industry Volume Share (%), by Usages 2025 & 2033
- Figure 27: Europe Soft Contact Lens Industry Revenue (billion), by Distribution Channel 2025 & 2033
- Figure 28: Europe Soft Contact Lens Industry Volume (K Units), by Distribution Channel 2025 & 2033
- Figure 29: Europe Soft Contact Lens Industry Revenue Share (%), by Distribution Channel 2025 & 2033
- Figure 30: Europe Soft Contact Lens Industry Volume Share (%), by Distribution Channel 2025 & 2033
- Figure 31: Europe Soft Contact Lens Industry Revenue (billion), by Country 2025 & 2033
- Figure 32: Europe Soft Contact Lens Industry Volume (K Units), by Country 2025 & 2033
- Figure 33: Europe Soft Contact Lens Industry Revenue Share (%), by Country 2025 & 2033
- Figure 34: Europe Soft Contact Lens Industry Volume Share (%), by Country 2025 & 2033
- Figure 35: Asia Pacific Soft Contact Lens Industry Revenue (billion), by Product Type 2025 & 2033
- Figure 36: Asia Pacific Soft Contact Lens Industry Volume (K Units), by Product Type 2025 & 2033
- Figure 37: Asia Pacific Soft Contact Lens Industry Revenue Share (%), by Product Type 2025 & 2033
- Figure 38: Asia Pacific Soft Contact Lens Industry Volume Share (%), by Product Type 2025 & 2033
- Figure 39: Asia Pacific Soft Contact Lens Industry Revenue (billion), by Usages 2025 & 2033
- Figure 40: Asia Pacific Soft Contact Lens Industry Volume (K Units), by Usages 2025 & 2033
- Figure 41: Asia Pacific Soft Contact Lens Industry Revenue Share (%), by Usages 2025 & 2033
- Figure 42: Asia Pacific Soft Contact Lens Industry Volume Share (%), by Usages 2025 & 2033
- Figure 43: Asia Pacific Soft Contact Lens Industry Revenue (billion), by Distribution Channel 2025 & 2033
- Figure 44: Asia Pacific Soft Contact Lens Industry Volume (K Units), by Distribution Channel 2025 & 2033
- Figure 45: Asia Pacific Soft Contact Lens Industry Revenue Share (%), by Distribution Channel 2025 & 2033
- Figure 46: Asia Pacific Soft Contact Lens Industry Volume Share (%), by Distribution Channel 2025 & 2033
- Figure 47: Asia Pacific Soft Contact Lens Industry Revenue (billion), by Country 2025 & 2033
- Figure 48: Asia Pacific Soft Contact Lens Industry Volume (K Units), by Country 2025 & 2033
- Figure 49: Asia Pacific Soft Contact Lens Industry Revenue Share (%), by Country 2025 & 2033
- Figure 50: Asia Pacific Soft Contact Lens Industry Volume Share (%), by Country 2025 & 2033
- Figure 51: South America Soft Contact Lens Industry Revenue (billion), by Product Type 2025 & 2033
- Figure 52: South America Soft Contact Lens Industry Volume (K Units), by Product Type 2025 & 2033
- Figure 53: South America Soft Contact Lens Industry Revenue Share (%), by Product Type 2025 & 2033
- Figure 54: South America Soft Contact Lens Industry Volume Share (%), by Product Type 2025 & 2033
- Figure 55: South America Soft Contact Lens Industry Revenue (billion), by Usages 2025 & 2033
- Figure 56: South America Soft Contact Lens Industry Volume (K Units), by Usages 2025 & 2033
- Figure 57: South America Soft Contact Lens Industry Revenue Share (%), by Usages 2025 & 2033
- Figure 58: South America Soft Contact Lens Industry Volume Share (%), by Usages 2025 & 2033
- Figure 59: South America Soft Contact Lens Industry Revenue (billion), by Distribution Channel 2025 & 2033
- Figure 60: South America Soft Contact Lens Industry Volume (K Units), by Distribution Channel 2025 & 2033
- Figure 61: South America Soft Contact Lens Industry Revenue Share (%), by Distribution Channel 2025 & 2033
- Figure 62: South America Soft Contact Lens Industry Volume Share (%), by Distribution Channel 2025 & 2033
- Figure 63: South America Soft Contact Lens Industry Revenue (billion), by Country 2025 & 2033
- Figure 64: South America Soft Contact Lens Industry Volume (K Units), by Country 2025 & 2033
- Figure 65: South America Soft Contact Lens Industry Revenue Share (%), by Country 2025 & 2033
- Figure 66: South America Soft Contact Lens Industry Volume Share (%), by Country 2025 & 2033
- Figure 67: Middle East and Africa Soft Contact Lens Industry Revenue (billion), by Product Type 2025 & 2033
- Figure 68: Middle East and Africa Soft Contact Lens Industry Volume (K Units), by Product Type 2025 & 2033
- Figure 69: Middle East and Africa Soft Contact Lens Industry Revenue Share (%), by Product Type 2025 & 2033
- Figure 70: Middle East and Africa Soft Contact Lens Industry Volume Share (%), by Product Type 2025 & 2033
- Figure 71: Middle East and Africa Soft Contact Lens Industry Revenue (billion), by Usages 2025 & 2033
- Figure 72: Middle East and Africa Soft Contact Lens Industry Volume (K Units), by Usages 2025 & 2033
- Figure 73: Middle East and Africa Soft Contact Lens Industry Revenue Share (%), by Usages 2025 & 2033
- Figure 74: Middle East and Africa Soft Contact Lens Industry Volume Share (%), by Usages 2025 & 2033
- Figure 75: Middle East and Africa Soft Contact Lens Industry Revenue (billion), by Distribution Channel 2025 & 2033
- Figure 76: Middle East and Africa Soft Contact Lens Industry Volume (K Units), by Distribution Channel 2025 & 2033
- Figure 77: Middle East and Africa Soft Contact Lens Industry Revenue Share (%), by Distribution Channel 2025 & 2033
- Figure 78: Middle East and Africa Soft Contact Lens Industry Volume Share (%), by Distribution Channel 2025 & 2033
- Figure 79: Middle East and Africa Soft Contact Lens Industry Revenue (billion), by Country 2025 & 2033
- Figure 80: Middle East and Africa Soft Contact Lens Industry Volume (K Units), by Country 2025 & 2033
- Figure 81: Middle East and Africa Soft Contact Lens Industry Revenue Share (%), by Country 2025 & 2033
- Figure 82: Middle East and Africa Soft Contact Lens Industry Volume Share (%), by Country 2025 & 2033
List of Tables
- Table 1: Global Soft Contact Lens Industry Revenue billion Forecast, by Product Type 2020 & 2033
- Table 2: Global Soft Contact Lens Industry Volume K Units Forecast, by Product Type 2020 & 2033
- Table 3: Global Soft Contact Lens Industry Revenue billion Forecast, by Usages 2020 & 2033
- Table 4: Global Soft Contact Lens Industry Volume K Units Forecast, by Usages 2020 & 2033
- Table 5: Global Soft Contact Lens Industry Revenue billion Forecast, by Distribution Channel 2020 & 2033
- Table 6: Global Soft Contact Lens Industry Volume K Units Forecast, by Distribution Channel 2020 & 2033
- Table 7: Global Soft Contact Lens Industry Revenue billion Forecast, by Region 2020 & 2033
- Table 8: Global Soft Contact Lens Industry Volume K Units Forecast, by Region 2020 & 2033
- Table 9: Global Soft Contact Lens Industry Revenue billion Forecast, by Product Type 2020 & 2033
- Table 10: Global Soft Contact Lens Industry Volume K Units Forecast, by Product Type 2020 & 2033
- Table 11: Global Soft Contact Lens Industry Revenue billion Forecast, by Usages 2020 & 2033
- Table 12: Global Soft Contact Lens Industry Volume K Units Forecast, by Usages 2020 & 2033
- Table 13: Global Soft Contact Lens Industry Revenue billion Forecast, by Distribution Channel 2020 & 2033
- Table 14: Global Soft Contact Lens Industry Volume K Units Forecast, by Distribution Channel 2020 & 2033
- Table 15: Global Soft Contact Lens Industry Revenue billion Forecast, by Country 2020 & 2033
- Table 16: Global Soft Contact Lens Industry Volume K Units Forecast, by Country 2020 & 2033
- Table 17: United States Soft Contact Lens Industry Revenue (billion) Forecast, by Application 2020 & 2033
- Table 18: United States Soft Contact Lens Industry Volume (K Units) Forecast, by Application 2020 & 2033
- Table 19: Canada Soft Contact Lens Industry Revenue (billion) Forecast, by Application 2020 & 2033
- Table 20: Canada Soft Contact Lens Industry Volume (K Units) Forecast, by Application 2020 & 2033
- Table 21: Mexico Soft Contact Lens Industry Revenue (billion) Forecast, by Application 2020 & 2033
- Table 22: Mexico Soft Contact Lens Industry Volume (K Units) Forecast, by Application 2020 & 2033
- Table 23: Rest of North America Soft Contact Lens Industry Revenue (billion) Forecast, by Application 2020 & 2033
- Table 24: Rest of North America Soft Contact Lens Industry Volume (K Units) Forecast, by Application 2020 & 2033
- Table 25: Global Soft Contact Lens Industry Revenue billion Forecast, by Product Type 2020 & 2033
- Table 26: Global Soft Contact Lens Industry Volume K Units Forecast, by Product Type 2020 & 2033
- Table 27: Global Soft Contact Lens Industry Revenue billion Forecast, by Usages 2020 & 2033
- Table 28: Global Soft Contact Lens Industry Volume K Units Forecast, by Usages 2020 & 2033
- Table 29: Global Soft Contact Lens Industry Revenue billion Forecast, by Distribution Channel 2020 & 2033
- Table 30: Global Soft Contact Lens Industry Volume K Units Forecast, by Distribution Channel 2020 & 2033
- Table 31: Global Soft Contact Lens Industry Revenue billion Forecast, by Country 2020 & 2033
- Table 32: Global Soft Contact Lens Industry Volume K Units Forecast, by Country 2020 & 2033
- Table 33: United Kingdom Soft Contact Lens Industry Revenue (billion) Forecast, by Application 2020 & 2033
- Table 34: United Kingdom Soft Contact Lens Industry Volume (K Units) Forecast, by Application 2020 & 2033
- Table 35: Germany Soft Contact Lens Industry Revenue (billion) Forecast, by Application 2020 & 2033
- Table 36: Germany Soft Contact Lens Industry Volume (K Units) Forecast, by Application 2020 & 2033
- Table 37: France Soft Contact Lens Industry Revenue (billion) Forecast, by Application 2020 & 2033
- Table 38: France Soft Contact Lens Industry Volume (K Units) Forecast, by Application 2020 & 2033
- Table 39: Italy Soft Contact Lens Industry Revenue (billion) Forecast, by Application 2020 & 2033
- Table 40: Italy Soft Contact Lens Industry Volume (K Units) Forecast, by Application 2020 & 2033
- Table 41: Russia Soft Contact Lens Industry Revenue (billion) Forecast, by Application 2020 & 2033
- Table 42: Russia Soft Contact Lens Industry Volume (K Units) Forecast, by Application 2020 & 2033
- Table 43: Rest of Europe Soft Contact Lens Industry Revenue (billion) Forecast, by Application 2020 & 2033
- Table 44: Rest of Europe Soft Contact Lens Industry Volume (K Units) Forecast, by Application 2020 & 2033
- Table 45: Global Soft Contact Lens Industry Revenue billion Forecast, by Product Type 2020 & 2033
- Table 46: Global Soft Contact Lens Industry Volume K Units Forecast, by Product Type 2020 & 2033
- Table 47: Global Soft Contact Lens Industry Revenue billion Forecast, by Usages 2020 & 2033
- Table 48: Global Soft Contact Lens Industry Volume K Units Forecast, by Usages 2020 & 2033
- Table 49: Global Soft Contact Lens Industry Revenue billion Forecast, by Distribution Channel 2020 & 2033
- Table 50: Global Soft Contact Lens Industry Volume K Units Forecast, by Distribution Channel 2020 & 2033
- Table 51: Global Soft Contact Lens Industry Revenue billion Forecast, by Country 2020 & 2033
- Table 52: Global Soft Contact Lens Industry Volume K Units Forecast, by Country 2020 & 2033
- Table 53: China Soft Contact Lens Industry Revenue (billion) Forecast, by Application 2020 & 2033
- Table 54: China Soft Contact Lens Industry Volume (K Units) Forecast, by Application 2020 & 2033
- Table 55: Japan Soft Contact Lens Industry Revenue (billion) Forecast, by Application 2020 & 2033
- Table 56: Japan Soft Contact Lens Industry Volume (K Units) Forecast, by Application 2020 & 2033
- Table 57: India Soft Contact Lens Industry Revenue (billion) Forecast, by Application 2020 & 2033
- Table 58: India Soft Contact Lens Industry Volume (K Units) Forecast, by Application 2020 & 2033
- Table 59: Australia Soft Contact Lens Industry Revenue (billion) Forecast, by Application 2020 & 2033
- Table 60: Australia Soft Contact Lens Industry Volume (K Units) Forecast, by Application 2020 & 2033
- Table 61: Rest of Asia Pacific Soft Contact Lens Industry Revenue (billion) Forecast, by Application 2020 & 2033
- Table 62: Rest of Asia Pacific Soft Contact Lens Industry Volume (K Units) Forecast, by Application 2020 & 2033
- Table 63: Global Soft Contact Lens Industry Revenue billion Forecast, by Product Type 2020 & 2033
- Table 64: Global Soft Contact Lens Industry Volume K Units Forecast, by Product Type 2020 & 2033
- Table 65: Global Soft Contact Lens Industry Revenue billion Forecast, by Usages 2020 & 2033
- Table 66: Global Soft Contact Lens Industry Volume K Units Forecast, by Usages 2020 & 2033
- Table 67: Global Soft Contact Lens Industry Revenue billion Forecast, by Distribution Channel 2020 & 2033
- Table 68: Global Soft Contact Lens Industry Volume K Units Forecast, by Distribution Channel 2020 & 2033
- Table 69: Global Soft Contact Lens Industry Revenue billion Forecast, by Country 2020 & 2033
- Table 70: Global Soft Contact Lens Industry Volume K Units Forecast, by Country 2020 & 2033
- Table 71: Brazil Soft Contact Lens Industry Revenue (billion) Forecast, by Application 2020 & 2033
- Table 72: Brazil Soft Contact Lens Industry Volume (K Units) Forecast, by Application 2020 & 2033
- Table 73: Argentina Soft Contact Lens Industry Revenue (billion) Forecast, by Application 2020 & 2033
- Table 74: Argentina Soft Contact Lens Industry Volume (K Units) Forecast, by Application 2020 & 2033
- Table 75: Rest of South America Soft Contact Lens Industry Revenue (billion) Forecast, by Application 2020 & 2033
- Table 76: Rest of South America Soft Contact Lens Industry Volume (K Units) Forecast, by Application 2020 & 2033
- Table 77: Global Soft Contact Lens Industry Revenue billion Forecast, by Product Type 2020 & 2033
- Table 78: Global Soft Contact Lens Industry Volume K Units Forecast, by Product Type 2020 & 2033
- Table 79: Global Soft Contact Lens Industry Revenue billion Forecast, by Usages 2020 & 2033
- Table 80: Global Soft Contact Lens Industry Volume K Units Forecast, by Usages 2020 & 2033
- Table 81: Global Soft Contact Lens Industry Revenue billion Forecast, by Distribution Channel 2020 & 2033
- Table 82: Global Soft Contact Lens Industry Volume K Units Forecast, by Distribution Channel 2020 & 2033
- Table 83: Global Soft Contact Lens Industry Revenue billion Forecast, by Country 2020 & 2033
- Table 84: Global Soft Contact Lens Industry Volume K Units Forecast, by Country 2020 & 2033
- Table 85: South Africa Soft Contact Lens Industry Revenue (billion) Forecast, by Application 2020 & 2033
- Table 86: South Africa Soft Contact Lens Industry Volume (K Units) Forecast, by Application 2020 & 2033
- Table 87: United Arab Emirates Soft Contact Lens Industry Revenue (billion) Forecast, by Application 2020 & 2033
- Table 88: United Arab Emirates Soft Contact Lens Industry Volume (K Units) Forecast, by Application 2020 & 2033
- Table 89: Rest of Middle East and Africa Soft Contact Lens Industry Revenue (billion) Forecast, by Application 2020 & 2033
- Table 90: Rest of Middle East and Africa Soft Contact Lens Industry Volume (K Units) Forecast, by Application 2020 & 2033
Frequently Asked Questions
1. What is the projected Compound Annual Growth Rate (CAGR) of the Soft Contact Lens Industry?
The projected CAGR is approximately 6.21%.
2. Which companies are prominent players in the Soft Contact Lens Industry?
Key companies in the market include Zeiss Group, Novartis AG, Essilor International SA, The Cooper Companies, Johnson & Johnson Vision Care Inc *List Not Exhaustive, Bausch Health Companies Inc, Hoya Corporation.
3. What are the main segments of the Soft Contact Lens Industry?
The market segments include Product Type, Usages, Distribution Channel.
4. Can you provide details about the market size?
The market size is estimated to be USD 97.6 billion as of 2022.
5. What are some drivers contributing to market growth?
Increasing Sports Participation is Boosting the Market Growth; Increasing Innovation and Upgradation in Merchandizing Products.
6. What are the notable trends driving market growth?
Rigid Gas Permeable Contact Lenses Segment is Expected to Exhibit the Fastest Growth Rate over the Forecast Period.
7. Are there any restraints impacting market growth?
Availability of Counterfeit Sports Merchandise Products.
8. Can you provide examples of recent developments in the market?
N/A
9. What pricing options are available for accessing the report?
Pricing options include single-user, multi-user, and enterprise licenses priced at USD 4750, USD 5250, and USD 8750 respectively.
10. Is the market size provided in terms of value or volume?
The market size is provided in terms of value, measured in billion and volume, measured in K Units.
11. Are there any specific market keywords associated with the report?
Yes, the market keyword associated with the report is "Soft Contact Lens Industry," which aids in identifying and referencing the specific market segment covered.
12. How do I determine which pricing option suits my needs best?
The pricing options vary based on user requirements and access needs. Individual users may opt for single-user licenses, while businesses requiring broader access may choose multi-user or enterprise licenses for cost-effective access to the report.
13. Are there any additional resources or data provided in the Soft Contact Lens Industry report?
While the report offers comprehensive insights, it's advisable to review the specific contents or supplementary materials provided to ascertain if additional resources or data are available.
14. How can I stay updated on further developments or reports in the Soft Contact Lens Industry?
To stay informed about further developments, trends, and reports in the Soft Contact Lens Industry, consider subscribing to industry newsletters, following relevant companies and organizations, or regularly checking reputable industry news sources and publications.
Methodology
Step 1 - Identification of Relevant Samples Size from Population Database


Step 2 - Approaches for Defining Global Market Size (Value, Volume* & Price*)

Note*: In applicable scenarios
Step 3 - Data Sources
Primary Research
- Web Analytics
- Survey Reports
- Research Institute
- Latest Research Reports
- Opinion Leaders
Secondary Research
- Annual Reports
- White Paper
- Latest Press Release
- Industry Association
- Paid Database
- Investor Presentations

Step 4 - Data Triangulation
Involves using different sources of information in order to increase the validity of a study
These sources are likely to be stakeholders in a program - participants, other researchers, program staff, other community members, and so on.
Then we put all data in single framework & apply various statistical tools to find out the dynamic on the market.
During the analysis stage, feedback from the stakeholder groups would be compared to determine areas of agreement as well as areas of divergence