Key Insights
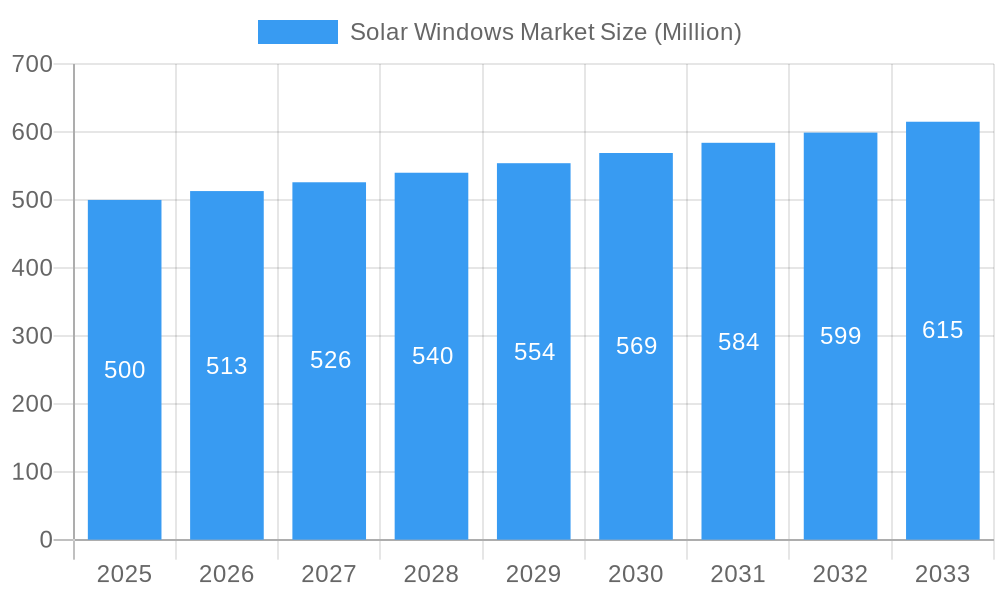
The global solar window market is set for robust expansion, projected to reach 138.4 million by 2033. Driven by a compound annual growth rate (CAGR) of 10.1% from a base year of 2023, this growth is fueled by increasing demand for sustainable energy and energy-efficient buildings. Supportive government policies promoting renewable energy integration and stringent building codes mandating energy conservation are significant accelerators. While the residential sector currently leads, commercial and emerging applications in smart buildings and automotive sectors show strong potential. Technological advancements in efficiency, aesthetics, and cost reduction further propel the market. Key players like Ubiquitous Energy Inc., Polysolar, and Onyx Solar Energy S.L., alongside new entrants, are driving innovation.
Solar Windows Market Market Size (In Million)
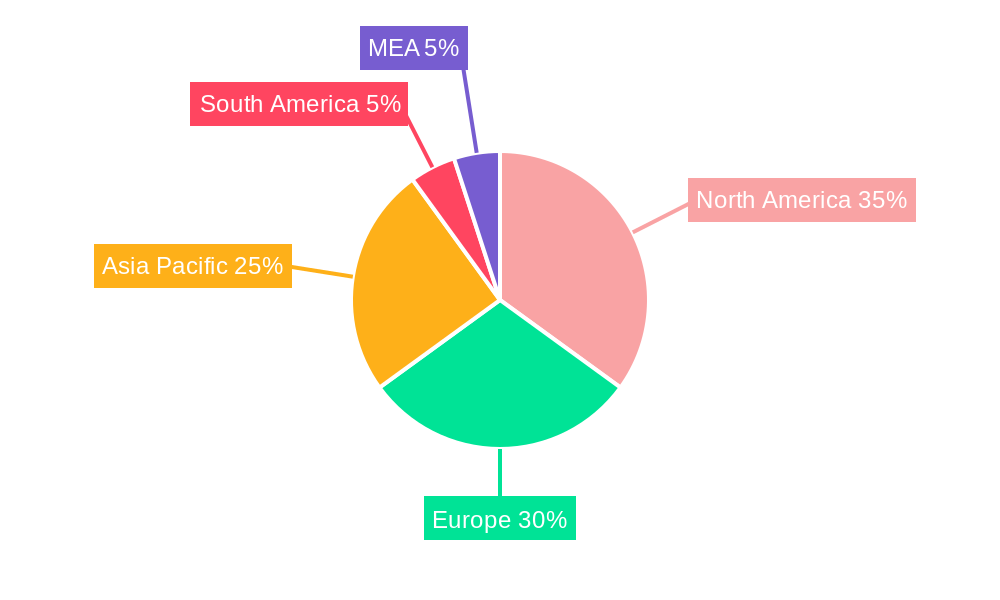
Despite a positive outlook, initial investment costs and the requirement for robust infrastructure present adoption barriers. Fluctuating raw material prices may also impact growth. However, ongoing R&D focused on enhancing durability, performance, and cost-effectiveness is expected to overcome these challenges. North America and Europe currently lead market share due to established renewable energy policies and high consumer awareness. The Asia-Pacific region is poised for substantial growth, driven by urbanization and government support for clean energy. Significant diversification across applications and regions is anticipated in the forecast period (2025-2033).
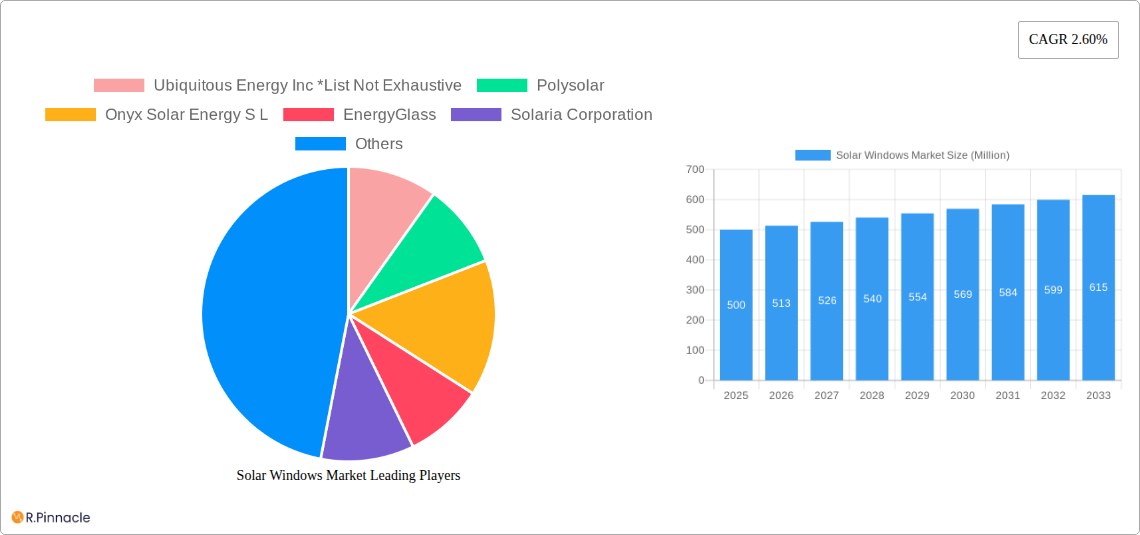
Solar Windows Market Company Market Share
Solar Windows Market: A Comprehensive Report (2019-2033)
This in-depth report provides a comprehensive analysis of the global Solar Windows Market, offering invaluable insights for industry professionals, investors, and strategists. The study period covers 2019-2033, with a base year of 2025 and a forecast period of 2025-2033. The report leverages extensive market research to deliver actionable intelligence on market size, growth drivers, competitive dynamics, and emerging trends. Discover key findings on market segmentation, leading players, technological advancements, and future growth potential. This report is essential for navigating the complexities of this rapidly evolving market and making informed business decisions.
Solar Windows Market Structure & Innovation Trends
The Solar Windows market is characterized by a moderately fragmented structure, with several key players vying for market share. While precise market share data for individual companies remains proprietary, key players such as Ubiquitous Energy Inc, Polysolar, Onyx Solar Energy S.L., EnergyGlass, Solaria Corporation, Solar Window Technologies Inc, Physee, and Brite Solar hold significant positions. The market is witnessing increased innovation driven by advancements in transparent solar cell technology, improved energy efficiency, and aesthetic design enhancements. Regulatory frameworks, such as building codes and incentives promoting renewable energy, play a crucial role in market growth. Product substitutes, including traditional window technologies and other renewable energy sources, present a competitive landscape. End-user demographics, particularly in residential and commercial sectors, are driving demand. M&A activities in the sector have been relatively modest, with deal values averaging xx Million in recent years. However, an increase in activity is anticipated as the market matures.
- Market Concentration: Moderately Fragmented
- Innovation Drivers: Advancements in transparent solar cell technology, aesthetic improvements.
- Regulatory Frameworks: Increasingly supportive policies promoting renewable energy adoption.
- Product Substitutes: Traditional windows, other renewable energy technologies.
- End-User Demographics: Growing demand from residential and commercial construction.
- M&A Activity: Moderate activity with an average deal value of xx Million.
Solar Windows Market Dynamics & Trends
The Solar Windows market is experiencing robust growth, driven by rising energy costs, increasing environmental awareness, and government initiatives promoting renewable energy integration. The Compound Annual Growth Rate (CAGR) during the forecast period (2025-2033) is projected to be xx%. This growth is fueled by technological disruptions, such as advancements in perovskite solar cell technology and the development of more efficient and aesthetically pleasing solar windows. Consumer preferences are shifting towards sustainable and energy-efficient building materials, further boosting market demand. Competitive dynamics are characterized by innovation and strategic partnerships, with companies focusing on developing unique product features and expanding market reach. Market penetration is currently low but is expected to increase significantly over the forecast period, reaching an estimated xx% by 2033. The increasing adoption of building integrated photovoltaics (BIPV) solutions is a significant contributor to this growth.
Dominant Regions & Segments in Solar Windows Market
The North American region is currently the dominant market for solar windows, primarily driven by strong government support for renewable energy and a high adoption rate in the residential and commercial sectors.
- Key Drivers in North America:
- Strong government incentives and subsidies for renewable energy adoption.
- Increasing consumer demand for energy-efficient and sustainable building solutions.
- Robust construction activity in both residential and commercial sectors.
Europe is also a significant market, with increasing adoption spurred by stringent environmental regulations and favorable government policies. The residential segment is currently the largest application area, driven by homeowner interest in reducing energy bills and lowering their carbon footprint. However, the commercial segment is expected to witness faster growth in the coming years, due to the larger scale of potential deployments and cost-saving opportunities. Other applications, including agriculture (greenhouses) and automotive (vehicle integration), are emerging as niche but promising market segments. Growth in these areas is limited by specific technological challenges and higher manufacturing costs.
Solar Windows Market Product Innovations
Recent innovations in solar window technology focus on enhancing efficiency, improving aesthetics, and reducing manufacturing costs. This includes the development of more transparent solar cells, improved light transmission capabilities, and the integration of smart functionalities like self-cleaning coatings and dimming capabilities. These innovations aim to increase the market appeal of solar windows by addressing some of the limitations of earlier generation products. The successful integration of these advancements into commercially viable solutions will determine the market’s trajectory in the years to come.
Report Scope & Segmentation Analysis
This report segments the solar windows market primarily by application:
Residential: This segment accounts for the largest market share currently, driven by individual homeowner demand for energy savings. The growth is projected to remain strong, with a CAGR of xx% during the forecast period. Competition is relatively fragmented in this segment.
Commercial: The commercial segment presents significant growth potential, with large-scale projects in office buildings, retail spaces, and industrial facilities offering opportunities for substantial revenue. The CAGR is projected at xx% during the forecast period. Competition in this segment is expected to become more intense.
Other Applications (Agriculture, Automotive, etc.): This segment comprises niche applications, each with its own unique challenges and opportunities. While currently smaller in size, it is expected to expand at a CAGR of xx% during the forecast period, driven by technological advancements tailored to specific use cases.
Key Drivers of Solar Windows Market Growth
Several key factors fuel the growth of the solar windows market. These include:
- Technological Advancements: Improvements in solar cell efficiency and aesthetic design.
- Government Policies: Incentives and regulations promoting renewable energy adoption.
- Rising Energy Costs: Increased energy prices make energy-efficient solutions more attractive.
- Growing Environmental Awareness: Increasing consumer preference for sustainable building materials.
Challenges in the Solar Windows Market Sector
The solar windows market faces several challenges that could hinder its growth:
- High Manufacturing Costs: The current manufacturing process can be expensive, limiting widespread adoption.
- Supply Chain Issues: The availability of key raw materials can influence production capacity.
- Competitive Pressures: Competition from traditional window manufacturers and other renewable energy technologies.
- Regulatory Hurdles: Differing regulations across regions may create market entry barriers.
Emerging Opportunities in Solar Windows Market
Several emerging opportunities exist within the solar windows market:
- Integration with Smart Building Systems: Combining solar windows with smart home technology.
- Expansion into New Markets: Targeting developing countries with high growth potential.
- Development of Novel Materials: Exploring new materials that further enhance efficiency and aesthetics.
Leading Players in the Solar Windows Market Market
- Ubiquitous Energy Inc
- Polysolar
- Onyx Solar Energy S.L.
- EnergyGlass
- Solaria Corporation
- Solar Window Technologies Inc
- Physee
- Brite Solar
Key Developments in Solar Windows Market Industry
- January 2023: Solaria Corporation launches a new high-efficiency solar window product.
- May 2022: Ubiquitous Energy Inc announces a strategic partnership with a major window manufacturer.
- October 2021: Onyx Solar Energy S.L. secures a large-scale contract for a commercial building project. (Further developments to be added)
Future Outlook for Solar Windows Market Market
The future of the solar windows market looks bright. Continued technological innovation, coupled with supportive government policies and rising consumer demand for sustainable energy solutions, is poised to propel significant market growth in the coming years. Strategic partnerships between solar technology providers and established window manufacturers will play a crucial role in expanding market reach and accelerating adoption. The market is expected to witness a substantial increase in market penetration, making solar windows a significant part of the renewable energy landscape.
Solar Windows Market Segmentation
-
1. Application
- 1.1. Residential
- 1.2. Commercial
- 1.3. Other Applications (Agriculture, Automotive, etc.)
Solar Windows Market Segmentation By Geography
-
1. North America
- 1.1. United States
- 1.2. Canada
- 1.3. Rest of North America
-
2. Europe
- 2.1. Germany
- 2.2. United Kingdom
- 2.3. Spain
- 2.4. Italy
- 2.5. Rest of Europe
-
3. Asia Pacific
- 3.1. China
- 3.2. India
- 3.3. Japan
- 3.4. Rest of Asia Pacific
-
4. Rest of the World
- 4.1. Brazil
- 4.2. Argentina
- 4.3. Saudi Arabia
- 4.4. United Arab Emirates
- 4.5. South Africa
- 4.6. Rest of the Countries
Solar Windows Market Regional Market Share
Geographic Coverage of Solar Windows Market
Solar Windows Market REPORT HIGHLIGHTS
| Aspects | Details |
|---|---|
| Study Period | 2020-2034 |
| Base Year | 2025 |
| Estimated Year | 2026 |
| Forecast Period | 2026-2034 |
| Historical Period | 2020-2025 |
| Growth Rate | CAGR of 10.1% from 2020-2034 |
| Segmentation |
|
Table of Contents
- 1. Introduction
- 1.1. Research Scope
- 1.2. Market Segmentation
- 1.3. Research Methodology
- 1.4. Definitions and Assumptions
- 2. Executive Summary
- 2.1. Introduction
- 3. Market Dynamics
- 3.1. Introduction
- 3.2. Market Drivers
- 3.2.1. 4.; Increasing Demand for Technology in the Industrial Sector for Large-scale Heating and Cooling Applications4.; Risising Demand for Energy Storage Systems
- 3.3. Market Restrains
- 3.3.1. 4.; Competition from Alternative Energy Storage Systems
- 3.4. Market Trends
- 3.4.1. Residential to Dominate the Market
- 4. Market Factor Analysis
- 4.1. Porters Five Forces
- 4.2. Supply/Value Chain
- 4.3. PESTEL analysis
- 4.4. Market Entropy
- 4.5. Patent/Trademark Analysis
- 5. Global Solar Windows Market Analysis, Insights and Forecast, 2020-2032
- 5.1. Market Analysis, Insights and Forecast - by Application
- 5.1.1. Residential
- 5.1.2. Commercial
- 5.1.3. Other Applications (Agriculture, Automotive, etc.)
- 5.2. Market Analysis, Insights and Forecast - by Region
- 5.2.1. North America
- 5.2.2. Europe
- 5.2.3. Asia Pacific
- 5.2.4. Rest of the World
- 5.1. Market Analysis, Insights and Forecast - by Application
- 6. North America Solar Windows Market Analysis, Insights and Forecast, 2020-2032
- 6.1. Market Analysis, Insights and Forecast - by Application
- 6.1.1. Residential
- 6.1.2. Commercial
- 6.1.3. Other Applications (Agriculture, Automotive, etc.)
- 6.1. Market Analysis, Insights and Forecast - by Application
- 7. Europe Solar Windows Market Analysis, Insights and Forecast, 2020-2032
- 7.1. Market Analysis, Insights and Forecast - by Application
- 7.1.1. Residential
- 7.1.2. Commercial
- 7.1.3. Other Applications (Agriculture, Automotive, etc.)
- 7.1. Market Analysis, Insights and Forecast - by Application
- 8. Asia Pacific Solar Windows Market Analysis, Insights and Forecast, 2020-2032
- 8.1. Market Analysis, Insights and Forecast - by Application
- 8.1.1. Residential
- 8.1.2. Commercial
- 8.1.3. Other Applications (Agriculture, Automotive, etc.)
- 8.1. Market Analysis, Insights and Forecast - by Application
- 9. Rest of the World Solar Windows Market Analysis, Insights and Forecast, 2020-2032
- 9.1. Market Analysis, Insights and Forecast - by Application
- 9.1.1. Residential
- 9.1.2. Commercial
- 9.1.3. Other Applications (Agriculture, Automotive, etc.)
- 9.1. Market Analysis, Insights and Forecast - by Application
- 10. Competitive Analysis
- 10.1. Global Market Share Analysis 2025
- 10.2. Company Profiles
- 10.2.1 Ubiquitous Energy Inc *List Not Exhaustive
- 10.2.1.1. Overview
- 10.2.1.2. Products
- 10.2.1.3. SWOT Analysis
- 10.2.1.4. Recent Developments
- 10.2.1.5. Financials (Based on Availability)
- 10.2.2 Polysolar
- 10.2.2.1. Overview
- 10.2.2.2. Products
- 10.2.2.3. SWOT Analysis
- 10.2.2.4. Recent Developments
- 10.2.2.5. Financials (Based on Availability)
- 10.2.3 Onyx Solar Energy S L
- 10.2.3.1. Overview
- 10.2.3.2. Products
- 10.2.3.3. SWOT Analysis
- 10.2.3.4. Recent Developments
- 10.2.3.5. Financials (Based on Availability)
- 10.2.4 EnergyGlass
- 10.2.4.1. Overview
- 10.2.4.2. Products
- 10.2.4.3. SWOT Analysis
- 10.2.4.4. Recent Developments
- 10.2.4.5. Financials (Based on Availability)
- 10.2.5 Solaria Corporation
- 10.2.5.1. Overview
- 10.2.5.2. Products
- 10.2.5.3. SWOT Analysis
- 10.2.5.4. Recent Developments
- 10.2.5.5. Financials (Based on Availability)
- 10.2.6 Solar Window Technologies Inc
- 10.2.6.1. Overview
- 10.2.6.2. Products
- 10.2.6.3. SWOT Analysis
- 10.2.6.4. Recent Developments
- 10.2.6.5. Financials (Based on Availability)
- 10.2.7 Physee
- 10.2.7.1. Overview
- 10.2.7.2. Products
- 10.2.7.3. SWOT Analysis
- 10.2.7.4. Recent Developments
- 10.2.7.5. Financials (Based on Availability)
- 10.2.8 Brite Solar
- 10.2.8.1. Overview
- 10.2.8.2. Products
- 10.2.8.3. SWOT Analysis
- 10.2.8.4. Recent Developments
- 10.2.8.5. Financials (Based on Availability)
- 10.2.1 Ubiquitous Energy Inc *List Not Exhaustive
List of Figures
- Figure 1: Global Solar Windows Market Revenue Breakdown (million, %) by Region 2025 & 2033
- Figure 2: Global Solar Windows Market Volume Breakdown (K Unit, %) by Region 2025 & 2033
- Figure 3: North America Solar Windows Market Revenue (million), by Application 2025 & 2033
- Figure 4: North America Solar Windows Market Volume (K Unit), by Application 2025 & 2033
- Figure 5: North America Solar Windows Market Revenue Share (%), by Application 2025 & 2033
- Figure 6: North America Solar Windows Market Volume Share (%), by Application 2025 & 2033
- Figure 7: North America Solar Windows Market Revenue (million), by Country 2025 & 2033
- Figure 8: North America Solar Windows Market Volume (K Unit), by Country 2025 & 2033
- Figure 9: North America Solar Windows Market Revenue Share (%), by Country 2025 & 2033
- Figure 10: North America Solar Windows Market Volume Share (%), by Country 2025 & 2033
- Figure 11: Europe Solar Windows Market Revenue (million), by Application 2025 & 2033
- Figure 12: Europe Solar Windows Market Volume (K Unit), by Application 2025 & 2033
- Figure 13: Europe Solar Windows Market Revenue Share (%), by Application 2025 & 2033
- Figure 14: Europe Solar Windows Market Volume Share (%), by Application 2025 & 2033
- Figure 15: Europe Solar Windows Market Revenue (million), by Country 2025 & 2033
- Figure 16: Europe Solar Windows Market Volume (K Unit), by Country 2025 & 2033
- Figure 17: Europe Solar Windows Market Revenue Share (%), by Country 2025 & 2033
- Figure 18: Europe Solar Windows Market Volume Share (%), by Country 2025 & 2033
- Figure 19: Asia Pacific Solar Windows Market Revenue (million), by Application 2025 & 2033
- Figure 20: Asia Pacific Solar Windows Market Volume (K Unit), by Application 2025 & 2033
- Figure 21: Asia Pacific Solar Windows Market Revenue Share (%), by Application 2025 & 2033
- Figure 22: Asia Pacific Solar Windows Market Volume Share (%), by Application 2025 & 2033
- Figure 23: Asia Pacific Solar Windows Market Revenue (million), by Country 2025 & 2033
- Figure 24: Asia Pacific Solar Windows Market Volume (K Unit), by Country 2025 & 2033
- Figure 25: Asia Pacific Solar Windows Market Revenue Share (%), by Country 2025 & 2033
- Figure 26: Asia Pacific Solar Windows Market Volume Share (%), by Country 2025 & 2033
- Figure 27: Rest of the World Solar Windows Market Revenue (million), by Application 2025 & 2033
- Figure 28: Rest of the World Solar Windows Market Volume (K Unit), by Application 2025 & 2033
- Figure 29: Rest of the World Solar Windows Market Revenue Share (%), by Application 2025 & 2033
- Figure 30: Rest of the World Solar Windows Market Volume Share (%), by Application 2025 & 2033
- Figure 31: Rest of the World Solar Windows Market Revenue (million), by Country 2025 & 2033
- Figure 32: Rest of the World Solar Windows Market Volume (K Unit), by Country 2025 & 2033
- Figure 33: Rest of the World Solar Windows Market Revenue Share (%), by Country 2025 & 2033
- Figure 34: Rest of the World Solar Windows Market Volume Share (%), by Country 2025 & 2033
List of Tables
- Table 1: Global Solar Windows Market Revenue million Forecast, by Application 2020 & 2033
- Table 2: Global Solar Windows Market Volume K Unit Forecast, by Application 2020 & 2033
- Table 3: Global Solar Windows Market Revenue million Forecast, by Region 2020 & 2033
- Table 4: Global Solar Windows Market Volume K Unit Forecast, by Region 2020 & 2033
- Table 5: Global Solar Windows Market Revenue million Forecast, by Application 2020 & 2033
- Table 6: Global Solar Windows Market Volume K Unit Forecast, by Application 2020 & 2033
- Table 7: Global Solar Windows Market Revenue million Forecast, by Country 2020 & 2033
- Table 8: Global Solar Windows Market Volume K Unit Forecast, by Country 2020 & 2033
- Table 9: United States Solar Windows Market Revenue (million) Forecast, by Application 2020 & 2033
- Table 10: United States Solar Windows Market Volume (K Unit) Forecast, by Application 2020 & 2033
- Table 11: Canada Solar Windows Market Revenue (million) Forecast, by Application 2020 & 2033
- Table 12: Canada Solar Windows Market Volume (K Unit) Forecast, by Application 2020 & 2033
- Table 13: Rest of North America Solar Windows Market Revenue (million) Forecast, by Application 2020 & 2033
- Table 14: Rest of North America Solar Windows Market Volume (K Unit) Forecast, by Application 2020 & 2033
- Table 15: Global Solar Windows Market Revenue million Forecast, by Application 2020 & 2033
- Table 16: Global Solar Windows Market Volume K Unit Forecast, by Application 2020 & 2033
- Table 17: Global Solar Windows Market Revenue million Forecast, by Country 2020 & 2033
- Table 18: Global Solar Windows Market Volume K Unit Forecast, by Country 2020 & 2033
- Table 19: Germany Solar Windows Market Revenue (million) Forecast, by Application 2020 & 2033
- Table 20: Germany Solar Windows Market Volume (K Unit) Forecast, by Application 2020 & 2033
- Table 21: United Kingdom Solar Windows Market Revenue (million) Forecast, by Application 2020 & 2033
- Table 22: United Kingdom Solar Windows Market Volume (K Unit) Forecast, by Application 2020 & 2033
- Table 23: Spain Solar Windows Market Revenue (million) Forecast, by Application 2020 & 2033
- Table 24: Spain Solar Windows Market Volume (K Unit) Forecast, by Application 2020 & 2033
- Table 25: Italy Solar Windows Market Revenue (million) Forecast, by Application 2020 & 2033
- Table 26: Italy Solar Windows Market Volume (K Unit) Forecast, by Application 2020 & 2033
- Table 27: Rest of Europe Solar Windows Market Revenue (million) Forecast, by Application 2020 & 2033
- Table 28: Rest of Europe Solar Windows Market Volume (K Unit) Forecast, by Application 2020 & 2033
- Table 29: Global Solar Windows Market Revenue million Forecast, by Application 2020 & 2033
- Table 30: Global Solar Windows Market Volume K Unit Forecast, by Application 2020 & 2033
- Table 31: Global Solar Windows Market Revenue million Forecast, by Country 2020 & 2033
- Table 32: Global Solar Windows Market Volume K Unit Forecast, by Country 2020 & 2033
- Table 33: China Solar Windows Market Revenue (million) Forecast, by Application 2020 & 2033
- Table 34: China Solar Windows Market Volume (K Unit) Forecast, by Application 2020 & 2033
- Table 35: India Solar Windows Market Revenue (million) Forecast, by Application 2020 & 2033
- Table 36: India Solar Windows Market Volume (K Unit) Forecast, by Application 2020 & 2033
- Table 37: Japan Solar Windows Market Revenue (million) Forecast, by Application 2020 & 2033
- Table 38: Japan Solar Windows Market Volume (K Unit) Forecast, by Application 2020 & 2033
- Table 39: Rest of Asia Pacific Solar Windows Market Revenue (million) Forecast, by Application 2020 & 2033
- Table 40: Rest of Asia Pacific Solar Windows Market Volume (K Unit) Forecast, by Application 2020 & 2033
- Table 41: Global Solar Windows Market Revenue million Forecast, by Application 2020 & 2033
- Table 42: Global Solar Windows Market Volume K Unit Forecast, by Application 2020 & 2033
- Table 43: Global Solar Windows Market Revenue million Forecast, by Country 2020 & 2033
- Table 44: Global Solar Windows Market Volume K Unit Forecast, by Country 2020 & 2033
- Table 45: Brazil Solar Windows Market Revenue (million) Forecast, by Application 2020 & 2033
- Table 46: Brazil Solar Windows Market Volume (K Unit) Forecast, by Application 2020 & 2033
- Table 47: Argentina Solar Windows Market Revenue (million) Forecast, by Application 2020 & 2033
- Table 48: Argentina Solar Windows Market Volume (K Unit) Forecast, by Application 2020 & 2033
- Table 49: Saudi Arabia Solar Windows Market Revenue (million) Forecast, by Application 2020 & 2033
- Table 50: Saudi Arabia Solar Windows Market Volume (K Unit) Forecast, by Application 2020 & 2033
- Table 51: United Arab Emirates Solar Windows Market Revenue (million) Forecast, by Application 2020 & 2033
- Table 52: United Arab Emirates Solar Windows Market Volume (K Unit) Forecast, by Application 2020 & 2033
- Table 53: South Africa Solar Windows Market Revenue (million) Forecast, by Application 2020 & 2033
- Table 54: South Africa Solar Windows Market Volume (K Unit) Forecast, by Application 2020 & 2033
- Table 55: Rest of the Countries Solar Windows Market Revenue (million) Forecast, by Application 2020 & 2033
- Table 56: Rest of the Countries Solar Windows Market Volume (K Unit) Forecast, by Application 2020 & 2033
Frequently Asked Questions
1. What is the projected Compound Annual Growth Rate (CAGR) of the Solar Windows Market?
The projected CAGR is approximately 10.1%.
2. Which companies are prominent players in the Solar Windows Market?
Key companies in the market include Ubiquitous Energy Inc *List Not Exhaustive, Polysolar, Onyx Solar Energy S L, EnergyGlass, Solaria Corporation, Solar Window Technologies Inc, Physee, Brite Solar.
3. What are the main segments of the Solar Windows Market?
The market segments include Application.
4. Can you provide details about the market size?
The market size is estimated to be USD 138.4 million as of 2022.
5. What are some drivers contributing to market growth?
4.; Increasing Demand for Technology in the Industrial Sector for Large-scale Heating and Cooling Applications4.; Risising Demand for Energy Storage Systems.
6. What are the notable trends driving market growth?
Residential to Dominate the Market.
7. Are there any restraints impacting market growth?
4.; Competition from Alternative Energy Storage Systems.
8. Can you provide examples of recent developments in the market?
N/A
9. What pricing options are available for accessing the report?
Pricing options include single-user, multi-user, and enterprise licenses priced at USD 4750, USD 5250, and USD 8750 respectively.
10. Is the market size provided in terms of value or volume?
The market size is provided in terms of value, measured in million and volume, measured in K Unit.
11. Are there any specific market keywords associated with the report?
Yes, the market keyword associated with the report is "Solar Windows Market," which aids in identifying and referencing the specific market segment covered.
12. How do I determine which pricing option suits my needs best?
The pricing options vary based on user requirements and access needs. Individual users may opt for single-user licenses, while businesses requiring broader access may choose multi-user or enterprise licenses for cost-effective access to the report.
13. Are there any additional resources or data provided in the Solar Windows Market report?
While the report offers comprehensive insights, it's advisable to review the specific contents or supplementary materials provided to ascertain if additional resources or data are available.
14. How can I stay updated on further developments or reports in the Solar Windows Market?
To stay informed about further developments, trends, and reports in the Solar Windows Market, consider subscribing to industry newsletters, following relevant companies and organizations, or regularly checking reputable industry news sources and publications.
Methodology
Step 1 - Identification of Relevant Samples Size from Population Database


Step 2 - Approaches for Defining Global Market Size (Value, Volume* & Price*)

Note*: In applicable scenarios
Step 3 - Data Sources
Primary Research
- Web Analytics
- Survey Reports
- Research Institute
- Latest Research Reports
- Opinion Leaders
Secondary Research
- Annual Reports
- White Paper
- Latest Press Release
- Industry Association
- Paid Database
- Investor Presentations

Step 4 - Data Triangulation
Involves using different sources of information in order to increase the validity of a study
These sources are likely to be stakeholders in a program - participants, other researchers, program staff, other community members, and so on.
Then we put all data in single framework & apply various statistical tools to find out the dynamic on the market.
During the analysis stage, feedback from the stakeholder groups would be compared to determine areas of agreement as well as areas of divergence

