

Key Insights
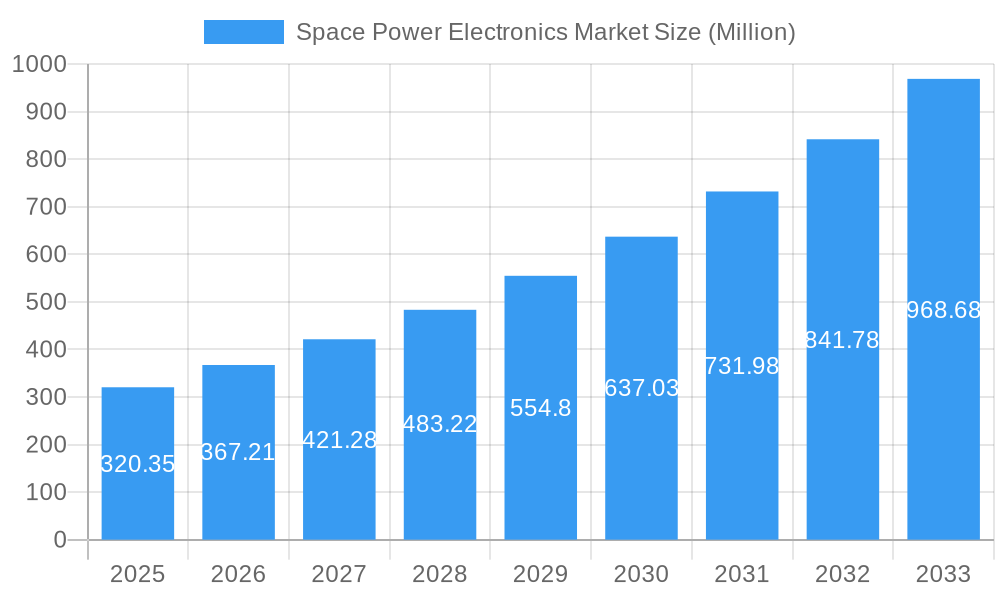
The space power electronics market, valued at $320.35 million in 2025, is projected to experience robust growth, driven by increasing demand for reliable power systems in space exploration and satellite communication. A Compound Annual Growth Rate (CAGR) of 14.68% from 2025 to 2033 indicates a significant expansion of this market. Key drivers include the burgeoning satellite constellation market, the growing adoption of electric propulsion systems for spacecraft, and the increasing need for miniaturized and highly efficient power electronics for smaller, more agile satellites. Technological advancements in radiation-hardened and radiation-tolerant components are further fueling market expansion. The segment breakdown reveals strong demand across various applications, including communication satellites, Earth observation, navigation systems (including GPS), and surveillance technologies. The market is geographically diverse, with North America, Europe, and the Asia-Pacific region emerging as prominent players. Competition is fierce, with major players like Honeywell, Microchip Technology, and Texas Instruments vying for market share through innovation and strategic partnerships. Continued investment in space exploration initiatives and the rising adoption of advanced technologies will continue to propel the growth trajectory of this market in the coming years.
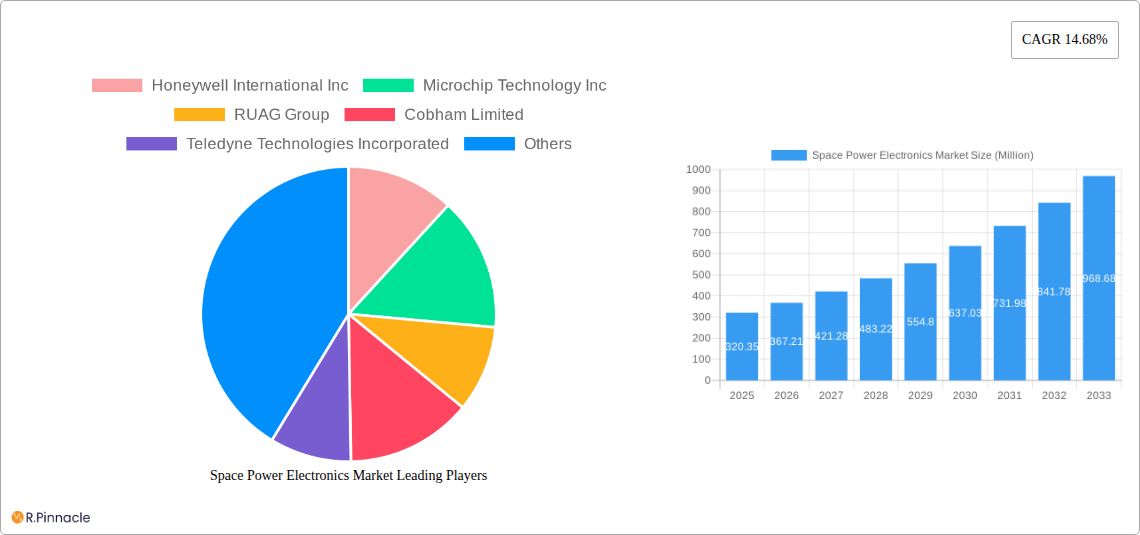
Space Power Electronics Market Market Size (In Million)
The market segmentation further reveals significant opportunities within specific technology types. Radiation-hardened components, crucial for withstanding the harsh space environment, hold a substantial market share. Similarly, the demand for advanced power electronics in communication and Earth observation applications is driving substantial growth in these segments. However, regulatory hurdles and the high cost associated with space-qualified components present challenges to market expansion. Despite these challenges, the long-term outlook remains positive, fueled by ongoing government investments in space programs, commercial space exploration initiatives, and the increasing reliance on space-based infrastructure for various applications worldwide. The consistent improvement in efficiency and miniaturization of power electronics will further contribute to market expansion over the forecast period.
Space Power Electronics Market Company Market Share
Space Power Electronics Market Report: 2019-2033
This comprehensive report provides an in-depth analysis of the Space Power Electronics Market, offering invaluable insights for industry professionals, investors, and strategic decision-makers. Covering the period from 2019 to 2033, with a base year of 2025 and a forecast period of 2025-2033, this report meticulously examines market dynamics, technological advancements, and competitive landscapes. The market is projected to reach xx Million by 2033, exhibiting a CAGR of xx% during the forecast period.
Space Power Electronics Market Structure & Innovation Trends
This section analyzes the competitive landscape of the space power electronics market, examining market concentration, innovation drivers, regulatory frameworks, and M&A activities. The market is moderately fragmented, with key players such as Honeywell International Inc, Microchip Technology Inc, and RUAG Group holding significant market share. However, smaller niche players are also making considerable contributions, especially in specialized technologies.
- Market Concentration: The Herfindahl-Hirschman Index (HHI) is estimated at xx, suggesting a moderately concentrated market.
- Innovation Drivers: Miniaturization, increased power density, and enhanced radiation hardness are key innovation drivers. Government funding for space exploration and commercialization initiatives further fuels innovation.
- Regulatory Frameworks: International space regulations and national space policies significantly influence market growth and technological advancements. Compliance requirements for radiation-hardened components drive market demand.
- Product Substitutes: While limited, alternative power sources and energy storage technologies pose potential challenges to existing market players.
- End-User Demographics: Government space agencies, private space companies, and research institutions represent the primary end-users. The increasing participation of private companies has significantly diversified demand.
- M&A Activities: The past five years have witnessed xx M&A deals in the space power electronics sector, with a total value of approximately xx Million. These activities mainly aim at expanding product portfolios, acquiring specialized technologies, and strengthening market positions.
Space Power Electronics Market Dynamics & Trends
The space power electronics market is experiencing robust growth, driven by several factors. The increasing demand for advanced satellite technology, the expansion of global navigation satellite systems (GNSS), and the rise of commercial space activities are key growth catalysts.
Technological advancements, such as the development of more efficient power converters and energy storage solutions, are constantly pushing the boundaries of what is possible. The market is witnessing a shift towards higher power density and radiation-hardened components, driven by the need for reliable and efficient power systems in harsh space environments. Consumer preferences are shifting towards improved performance, reduced weight, and enhanced reliability. Competitive dynamics are characterized by intense innovation, strategic partnerships, and acquisitions, fueling further market growth. The market penetration of radiation-hardened components is expected to reach xx% by 2033.
Dominant Regions & Segments in Space Power Electronics Market
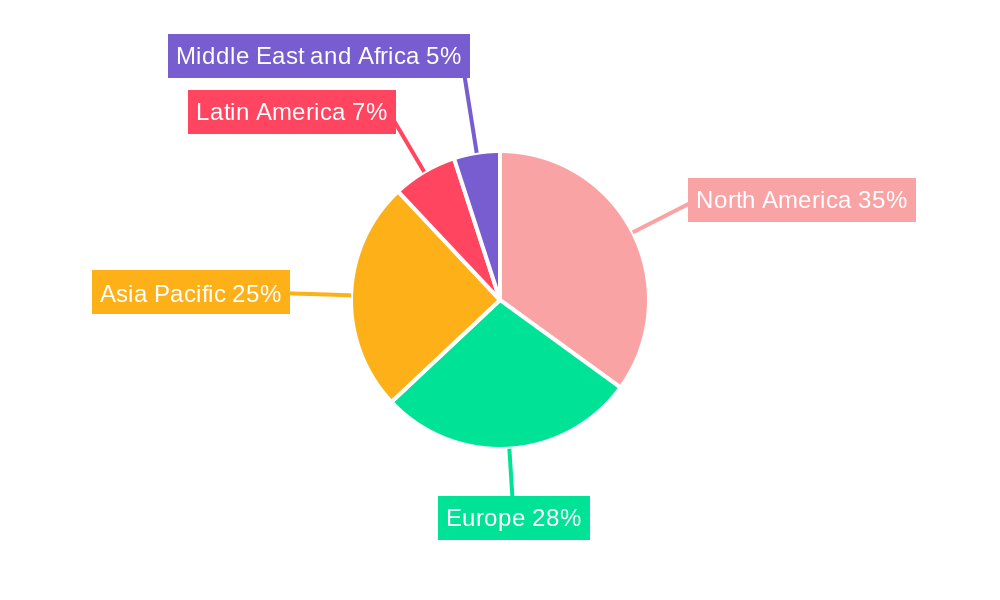
North America currently dominates the space power electronics market, driven by a strong presence of major players, robust government funding, and a well-established aerospace industry. Europe and Asia-Pacific are also experiencing significant growth, fueled by increasing investments in space exploration and commercialization.
- Leading Region: North America
- Key Drivers (North America): Strong government support for space exploration, presence of major industry players, advanced technological capabilities.
- Key Drivers (Europe): Growing investments in satellite technology, robust R&D efforts, increasing collaboration between public and private entities.
- Key Drivers (Asia-Pacific): Rapid growth in commercial space activities, government initiatives to promote space technology, increasing demand for communication and navigation satellites.
Dominant Segments:
- Platform: Satellites account for the largest market share, driven by the ever-increasing demand for advanced communication, earth observation, and navigation satellites.
- Type: Radiation-hardened components are the dominant type, owing to their ability to withstand the harsh radiation environment in space.
- Application: Communication, Earth observation, and navigation applications dominate the market, reflecting the high demand for reliable power systems in these sectors.
Space Power Electronics Market Product Innovations
Recent product innovations include the development of high-efficiency power converters with improved radiation tolerance and advanced energy storage solutions with increased power density and longer lifespan. These innovations provide significant competitive advantages in terms of improved performance, reduced weight, and enhanced reliability, enabling more complex and sophisticated space missions. The integration of AI and machine learning into power management systems is also an emerging trend, promising improved efficiency and autonomy.
Report Scope & Segmentation Analysis
This report segments the space power electronics market based on platform (Satellites, Spacecraft and Launch Vehicles, Others), type (Radiation-Hardened, Radiation-Tolerant), and application (Communication, Earth Observation, Navigation, Global Positioning System (GPS) and Surveillance, Technology Development and Education, Others). Each segment's growth projections, market size, and competitive dynamics are thoroughly analyzed. The Satellites segment holds the largest market share, followed by Spacecraft and Launch Vehicles. Radiation-hardened components constitute the largest share within the type segment. Communication applications dominate the market amongst the applications.
Key Drivers of Space Power Electronics Market Growth
Several factors drive the growth of the space power electronics market. These include increasing demand for space-based services, technological advancements in power electronics, growing government investments in space exploration, and the rise of commercial space activities. Stringent regulations regarding reliability and radiation resistance are further fueling demand for specialized components.
Challenges in the Space Power Electronics Market Sector
The space power electronics market faces challenges such as high development costs, stringent regulatory requirements, supply chain complexities, and intense competition. These factors influence the overall market growth and require significant investments in research and development to overcome them. The impact of these challenges on market growth is estimated at xx% annually.
Emerging Opportunities in Space Power Electronics Market
Emerging opportunities include the development of miniaturized and highly efficient power electronics for small satellites, the integration of renewable energy sources into space power systems, and the expansion of commercial space tourism. These opportunities represent significant potential for market growth.
Leading Players in the Space Power Electronics Market Market
Key Developments in Space Power Electronics Market Industry
- Jan 2023: Company X launched a new generation of radiation-hardened power converters.
- May 2022: Company Y and Company Z announced a strategic partnership to develop advanced energy storage solutions.
- Oct 2021: Company A acquired Company B, expanding its product portfolio in the space power electronics sector. (Further details would be added here for each development.)
Future Outlook for Space Power Electronics Market Market
The future of the space power electronics market is bright, driven by continued growth in space exploration and commercialization. Technological advancements, increasing demand for reliable and efficient power systems, and expanding government and private investments will further fuel market expansion. Strategic partnerships and collaborations will play a crucial role in shaping the future landscape of this dynamic sector.
Space Power Electronics Market Segmentation
-
1. Platform
- 1.1. Satellites
- 1.2. Spacecraft and Launch Vehicles
- 1.3. Others
-
2. Type
- 2.1. Radiation-Hardened
- 2.2. Radiation-Tolerant
-
3. Application
- 3.1. Communication
- 3.2. Earth Observation
- 3.3. Navigati
- 3.4. Technology Development and Education
- 3.5. Others
Space Power Electronics Market Segmentation By Geography
-
1. North America
- 1.1. United States
- 1.2. Canada
-
2. Europe
- 2.1. United Kingdom
- 2.2. France
- 2.3. Germany
- 2.4. Russia
- 2.5. Rest of Europe
-
3. Asia Pacific
- 3.1. China
- 3.2. India
- 3.3. Japan
- 3.4. South Korea
- 3.5. Rest of Asia Pacific
-
4. Latin America
- 4.1. Brazil
- 4.2. Rest of Latin America
-
5. Middle East and Africa
- 5.1. Saudi Arabia
- 5.2. United Arab Emirates
- 5.3. Rest of Middle East and Africa
Space Power Electronics Market Regional Market Share
Geographic Coverage of Space Power Electronics Market
Space Power Electronics Market REPORT HIGHLIGHTS
| Aspects | Details |
|---|---|
| Study Period | 2020-2034 |
| Base Year | 2025 |
| Estimated Year | 2026 |
| Forecast Period | 2026-2034 |
| Historical Period | 2020-2025 |
| Growth Rate | CAGR of 14.68% from 2020-2034 |
| Segmentation |
|
Table of Contents
- 1. Introduction
- 1.1. Research Scope
- 1.2. Market Segmentation
- 1.3. Research Objective
- 1.4. Definitions and Assumptions
- 2. Executive Summary
- 2.1. Market Snapshot
- 3. Market Dynamics
- 3.1. Market Drivers
- 3.2. Market Restrains
- 3.3. Market Trends
- 3.4. Market Opportunities
- 4. Market Factor Analysis
- 4.1. Porters Five Forces
- 4.1.1. Bargaining Power of Suppliers
- 4.1.2. Bargaining Power of Buyers
- 4.1.3. Threat of New Entrants
- 4.1.4. Threat of Substitutes
- 4.1.5. Competitive Rivalry
- 4.2. PESTEL analysis
- 4.3. BCG Analysis
- 4.3.1. Stars (High Growth, High Market Share)
- 4.3.2. Cash Cows (Low Growth, High Market Share)
- 4.3.3. Question Mark (High Growth, Low Market Share)
- 4.3.4. Dogs (Low Growth, Low Market Share)
- 4.4. Ansoff Matrix Analysis
- 4.5. Supply Chain Analysis
- 4.6. Regulatory Landscape
- 4.7. Current Market Potential and Opportunity Assessment (TAM–SAM–SOM Framework)
- 4.8. PRI Analyst Note
- 4.1. Porters Five Forces
- 5. Market Analysis, Insights and Forecast 2021-2033
- 5.1. Market Analysis, Insights and Forecast - by Platform
- 5.1.1. Satellites
- 5.1.2. Spacecraft and Launch Vehicles
- 5.1.3. Others
- 5.2. Market Analysis, Insights and Forecast - by Type
- 5.2.1. Radiation-Hardened
- 5.2.2. Radiation-Tolerant
- 5.3. Market Analysis, Insights and Forecast - by Application
- 5.3.1. Communication
- 5.3.2. Earth Observation
- 5.3.3. Navigati
- 5.3.4. Technology Development and Education
- 5.3.5. Others
- 5.4. Market Analysis, Insights and Forecast - by Region
- 5.4.1. North America
- 5.4.2. Europe
- 5.4.3. Asia Pacific
- 5.4.4. Latin America
- 5.4.5. Middle East and Africa
- 5.1. Market Analysis, Insights and Forecast - by Platform
- 6. Global Space Power Electronics Market Analysis, Insights and Forecast, 2021-2033
- 6.1. Market Analysis, Insights and Forecast - by Platform
- 6.1.1. Satellites
- 6.1.2. Spacecraft and Launch Vehicles
- 6.1.3. Others
- 6.2. Market Analysis, Insights and Forecast - by Type
- 6.2.1. Radiation-Hardened
- 6.2.2. Radiation-Tolerant
- 6.3. Market Analysis, Insights and Forecast - by Application
- 6.3.1. Communication
- 6.3.2. Earth Observation
- 6.3.3. Navigati
- 6.3.4. Technology Development and Education
- 6.3.5. Others
- 6.1. Market Analysis, Insights and Forecast - by Platform
- 7. North America Space Power Electronics Market Analysis, Insights and Forecast, 2020-2032
- 7.1. Market Analysis, Insights and Forecast - by Platform
- 7.1.1. Satellites
- 7.1.2. Spacecraft and Launch Vehicles
- 7.1.3. Others
- 7.2. Market Analysis, Insights and Forecast - by Type
- 7.2.1. Radiation-Hardened
- 7.2.2. Radiation-Tolerant
- 7.3. Market Analysis, Insights and Forecast - by Application
- 7.3.1. Communication
- 7.3.2. Earth Observation
- 7.3.3. Navigati
- 7.3.4. Technology Development and Education
- 7.3.5. Others
- 7.1. Market Analysis, Insights and Forecast - by Platform
- 8. Europe Space Power Electronics Market Analysis, Insights and Forecast, 2020-2032
- 8.1. Market Analysis, Insights and Forecast - by Platform
- 8.1.1. Satellites
- 8.1.2. Spacecraft and Launch Vehicles
- 8.1.3. Others
- 8.2. Market Analysis, Insights and Forecast - by Type
- 8.2.1. Radiation-Hardened
- 8.2.2. Radiation-Tolerant
- 8.3. Market Analysis, Insights and Forecast - by Application
- 8.3.1. Communication
- 8.3.2. Earth Observation
- 8.3.3. Navigati
- 8.3.4. Technology Development and Education
- 8.3.5. Others
- 8.1. Market Analysis, Insights and Forecast - by Platform
- 9. Asia Pacific Space Power Electronics Market Analysis, Insights and Forecast, 2020-2032
- 9.1. Market Analysis, Insights and Forecast - by Platform
- 9.1.1. Satellites
- 9.1.2. Spacecraft and Launch Vehicles
- 9.1.3. Others
- 9.2. Market Analysis, Insights and Forecast - by Type
- 9.2.1. Radiation-Hardened
- 9.2.2. Radiation-Tolerant
- 9.3. Market Analysis, Insights and Forecast - by Application
- 9.3.1. Communication
- 9.3.2. Earth Observation
- 9.3.3. Navigati
- 9.3.4. Technology Development and Education
- 9.3.5. Others
- 9.1. Market Analysis, Insights and Forecast - by Platform
- 10. Latin America Space Power Electronics Market Analysis, Insights and Forecast, 2020-2032
- 10.1. Market Analysis, Insights and Forecast - by Platform
- 10.1.1. Satellites
- 10.1.2. Spacecraft and Launch Vehicles
- 10.1.3. Others
- 10.2. Market Analysis, Insights and Forecast - by Type
- 10.2.1. Radiation-Hardened
- 10.2.2. Radiation-Tolerant
- 10.3. Market Analysis, Insights and Forecast - by Application
- 10.3.1. Communication
- 10.3.2. Earth Observation
- 10.3.3. Navigati
- 10.3.4. Technology Development and Education
- 10.3.5. Others
- 10.1. Market Analysis, Insights and Forecast - by Platform
- 11. Middle East and Africa Space Power Electronics Market Analysis, Insights and Forecast, 2020-2032
- 11.1. Market Analysis, Insights and Forecast - by Platform
- 11.1.1. Satellites
- 11.1.2. Spacecraft and Launch Vehicles
- 11.1.3. Others
- 11.2. Market Analysis, Insights and Forecast - by Type
- 11.2.1. Radiation-Hardened
- 11.2.2. Radiation-Tolerant
- 11.3. Market Analysis, Insights and Forecast - by Application
- 11.3.1. Communication
- 11.3.2. Earth Observation
- 11.3.3. Navigati
- 11.3.4. Technology Development and Education
- 11.3.5. Others
- 11.1. Market Analysis, Insights and Forecast - by Platform
- 12. Competitive Analysis
- 12.1. Company Profiles
- 12.1.1 Honeywell International Inc
- 12.1.1.1. Company Overview
- 12.1.1.2. Products
- 12.1.1.3. Company Financials
- 12.1.1.4. SWOT Analysis
- 12.1.2 Microchip Technology Inc
- 12.1.2.1. Company Overview
- 12.1.2.2. Products
- 12.1.2.3. Company Financials
- 12.1.2.4. SWOT Analysis
- 12.1.3 RUAG Group
- 12.1.3.1. Company Overview
- 12.1.3.2. Products
- 12.1.3.3. Company Financials
- 12.1.3.4. SWOT Analysis
- 12.1.4 Cobham Limited
- 12.1.4.1. Company Overview
- 12.1.4.2. Products
- 12.1.4.3. Company Financials
- 12.1.4.4. SWOT Analysis
- 12.1.5 Teledyne Technologies Incorporated
- 12.1.5.1. Company Overview
- 12.1.5.2. Products
- 12.1.5.3. Company Financials
- 12.1.5.4. SWOT Analysis
- 12.1.6 BAE Systems PLC
- 12.1.6.1. Company Overview
- 12.1.6.2. Products
- 12.1.6.3. Company Financials
- 12.1.6.4. SWOT Analysis
- 12.1.7 STMicroelectronics NV
- 12.1.7.1. Company Overview
- 12.1.7.2. Products
- 12.1.7.3. Company Financials
- 12.1.7.4. SWOT Analysis
- 12.1.8 ON Semiconductor
- 12.1.8.1. Company Overview
- 12.1.8.2. Products
- 12.1.8.3. Company Financials
- 12.1.8.4. SWOT Analysis
- 12.1.9 Renesas Electronics Corporation
- 12.1.9.1. Company Overview
- 12.1.9.2. Products
- 12.1.9.3. Company Financials
- 12.1.9.4. SWOT Analysis
- 12.1.10 Infineon Technologies A
- 12.1.10.1. Company Overview
- 12.1.10.2. Products
- 12.1.10.3. Company Financials
- 12.1.10.4. SWOT Analysis
- 12.1.11 Texas Instruments Incorporated
- 12.1.11.1. Company Overview
- 12.1.11.2. Products
- 12.1.11.3. Company Financials
- 12.1.11.4. SWOT Analysis
- 12.1.12 Microsemi Conduction
- 12.1.12.1. Company Overview
- 12.1.12.2. Products
- 12.1.12.3. Company Financials
- 12.1.12.4. SWOT Analysis
- 12.1.13 Analog Devices Inc
- 12.1.13.1. Company Overview
- 12.1.13.2. Products
- 12.1.13.3. Company Financials
- 12.1.13.4. SWOT Analysis
- 12.1.1 Honeywell International Inc
- 12.2. Market Entropy
- 12.2.1 Company's Key Areas Served
- 12.2.2 Recent Developments
- 12.3. Company Market Share Analysis 2025
- 12.3.1 Top 5 Companies Market Share Analysis
- 12.3.2 Top 3 Companies Market Share Analysis
- 12.4. List of Potential Customers
- 13. Research Methodology
List of Figures
- Figure 1: Global Space Power Electronics Market Revenue Breakdown (Million, %) by Region 2025 & 2033
- Figure 2: North America Space Power Electronics Market Revenue (Million), by Platform 2025 & 2033
- Figure 3: North America Space Power Electronics Market Revenue Share (%), by Platform 2025 & 2033
- Figure 4: North America Space Power Electronics Market Revenue (Million), by Type 2025 & 2033
- Figure 5: North America Space Power Electronics Market Revenue Share (%), by Type 2025 & 2033
- Figure 6: North America Space Power Electronics Market Revenue (Million), by Application 2025 & 2033
- Figure 7: North America Space Power Electronics Market Revenue Share (%), by Application 2025 & 2033
- Figure 8: North America Space Power Electronics Market Revenue (Million), by Country 2025 & 2033
- Figure 9: North America Space Power Electronics Market Revenue Share (%), by Country 2025 & 2033
- Figure 10: Europe Space Power Electronics Market Revenue (Million), by Platform 2025 & 2033
- Figure 11: Europe Space Power Electronics Market Revenue Share (%), by Platform 2025 & 2033
- Figure 12: Europe Space Power Electronics Market Revenue (Million), by Type 2025 & 2033
- Figure 13: Europe Space Power Electronics Market Revenue Share (%), by Type 2025 & 2033
- Figure 14: Europe Space Power Electronics Market Revenue (Million), by Application 2025 & 2033
- Figure 15: Europe Space Power Electronics Market Revenue Share (%), by Application 2025 & 2033
- Figure 16: Europe Space Power Electronics Market Revenue (Million), by Country 2025 & 2033
- Figure 17: Europe Space Power Electronics Market Revenue Share (%), by Country 2025 & 2033
- Figure 18: Asia Pacific Space Power Electronics Market Revenue (Million), by Platform 2025 & 2033
- Figure 19: Asia Pacific Space Power Electronics Market Revenue Share (%), by Platform 2025 & 2033
- Figure 20: Asia Pacific Space Power Electronics Market Revenue (Million), by Type 2025 & 2033
- Figure 21: Asia Pacific Space Power Electronics Market Revenue Share (%), by Type 2025 & 2033
- Figure 22: Asia Pacific Space Power Electronics Market Revenue (Million), by Application 2025 & 2033
- Figure 23: Asia Pacific Space Power Electronics Market Revenue Share (%), by Application 2025 & 2033
- Figure 24: Asia Pacific Space Power Electronics Market Revenue (Million), by Country 2025 & 2033
- Figure 25: Asia Pacific Space Power Electronics Market Revenue Share (%), by Country 2025 & 2033
- Figure 26: Latin America Space Power Electronics Market Revenue (Million), by Platform 2025 & 2033
- Figure 27: Latin America Space Power Electronics Market Revenue Share (%), by Platform 2025 & 2033
- Figure 28: Latin America Space Power Electronics Market Revenue (Million), by Type 2025 & 2033
- Figure 29: Latin America Space Power Electronics Market Revenue Share (%), by Type 2025 & 2033
- Figure 30: Latin America Space Power Electronics Market Revenue (Million), by Application 2025 & 2033
- Figure 31: Latin America Space Power Electronics Market Revenue Share (%), by Application 2025 & 2033
- Figure 32: Latin America Space Power Electronics Market Revenue (Million), by Country 2025 & 2033
- Figure 33: Latin America Space Power Electronics Market Revenue Share (%), by Country 2025 & 2033
- Figure 34: Middle East and Africa Space Power Electronics Market Revenue (Million), by Platform 2025 & 2033
- Figure 35: Middle East and Africa Space Power Electronics Market Revenue Share (%), by Platform 2025 & 2033
- Figure 36: Middle East and Africa Space Power Electronics Market Revenue (Million), by Type 2025 & 2033
- Figure 37: Middle East and Africa Space Power Electronics Market Revenue Share (%), by Type 2025 & 2033
- Figure 38: Middle East and Africa Space Power Electronics Market Revenue (Million), by Application 2025 & 2033
- Figure 39: Middle East and Africa Space Power Electronics Market Revenue Share (%), by Application 2025 & 2033
- Figure 40: Middle East and Africa Space Power Electronics Market Revenue (Million), by Country 2025 & 2033
- Figure 41: Middle East and Africa Space Power Electronics Market Revenue Share (%), by Country 2025 & 2033
List of Tables
- Table 1: Global Space Power Electronics Market Revenue Million Forecast, by Platform 2020 & 2033
- Table 2: Global Space Power Electronics Market Revenue Million Forecast, by Type 2020 & 2033
- Table 3: Global Space Power Electronics Market Revenue Million Forecast, by Application 2020 & 2033
- Table 4: Global Space Power Electronics Market Revenue Million Forecast, by Region 2020 & 2033
- Table 5: Global Space Power Electronics Market Revenue Million Forecast, by Platform 2020 & 2033
- Table 6: Global Space Power Electronics Market Revenue Million Forecast, by Type 2020 & 2033
- Table 7: Global Space Power Electronics Market Revenue Million Forecast, by Application 2020 & 2033
- Table 8: Global Space Power Electronics Market Revenue Million Forecast, by Country 2020 & 2033
- Table 9: United States Space Power Electronics Market Revenue (Million) Forecast, by Application 2020 & 2033
- Table 10: Canada Space Power Electronics Market Revenue (Million) Forecast, by Application 2020 & 2033
- Table 11: Global Space Power Electronics Market Revenue Million Forecast, by Platform 2020 & 2033
- Table 12: Global Space Power Electronics Market Revenue Million Forecast, by Type 2020 & 2033
- Table 13: Global Space Power Electronics Market Revenue Million Forecast, by Application 2020 & 2033
- Table 14: Global Space Power Electronics Market Revenue Million Forecast, by Country 2020 & 2033
- Table 15: United Kingdom Space Power Electronics Market Revenue (Million) Forecast, by Application 2020 & 2033
- Table 16: France Space Power Electronics Market Revenue (Million) Forecast, by Application 2020 & 2033
- Table 17: Germany Space Power Electronics Market Revenue (Million) Forecast, by Application 2020 & 2033
- Table 18: Russia Space Power Electronics Market Revenue (Million) Forecast, by Application 2020 & 2033
- Table 19: Rest of Europe Space Power Electronics Market Revenue (Million) Forecast, by Application 2020 & 2033
- Table 20: Global Space Power Electronics Market Revenue Million Forecast, by Platform 2020 & 2033
- Table 21: Global Space Power Electronics Market Revenue Million Forecast, by Type 2020 & 2033
- Table 22: Global Space Power Electronics Market Revenue Million Forecast, by Application 2020 & 2033
- Table 23: Global Space Power Electronics Market Revenue Million Forecast, by Country 2020 & 2033
- Table 24: China Space Power Electronics Market Revenue (Million) Forecast, by Application 2020 & 2033
- Table 25: India Space Power Electronics Market Revenue (Million) Forecast, by Application 2020 & 2033
- Table 26: Japan Space Power Electronics Market Revenue (Million) Forecast, by Application 2020 & 2033
- Table 27: South Korea Space Power Electronics Market Revenue (Million) Forecast, by Application 2020 & 2033
- Table 28: Rest of Asia Pacific Space Power Electronics Market Revenue (Million) Forecast, by Application 2020 & 2033
- Table 29: Global Space Power Electronics Market Revenue Million Forecast, by Platform 2020 & 2033
- Table 30: Global Space Power Electronics Market Revenue Million Forecast, by Type 2020 & 2033
- Table 31: Global Space Power Electronics Market Revenue Million Forecast, by Application 2020 & 2033
- Table 32: Global Space Power Electronics Market Revenue Million Forecast, by Country 2020 & 2033
- Table 33: Brazil Space Power Electronics Market Revenue (Million) Forecast, by Application 2020 & 2033
- Table 34: Rest of Latin America Space Power Electronics Market Revenue (Million) Forecast, by Application 2020 & 2033
- Table 35: Global Space Power Electronics Market Revenue Million Forecast, by Platform 2020 & 2033
- Table 36: Global Space Power Electronics Market Revenue Million Forecast, by Type 2020 & 2033
- Table 37: Global Space Power Electronics Market Revenue Million Forecast, by Application 2020 & 2033
- Table 38: Global Space Power Electronics Market Revenue Million Forecast, by Country 2020 & 2033
- Table 39: Saudi Arabia Space Power Electronics Market Revenue (Million) Forecast, by Application 2020 & 2033
- Table 40: United Arab Emirates Space Power Electronics Market Revenue (Million) Forecast, by Application 2020 & 2033
- Table 41: Rest of Middle East and Africa Space Power Electronics Market Revenue (Million) Forecast, by Application 2020 & 2033
Frequently Asked Questions
1. What is the projected Compound Annual Growth Rate (CAGR) of the Space Power Electronics Market?
The projected CAGR is approximately 14.68%.
2. Which companies are prominent players in the Space Power Electronics Market?
Key companies in the market include Honeywell International Inc, Microchip Technology Inc, RUAG Group, Cobham Limited, Teledyne Technologies Incorporated, BAE Systems PLC, STMicroelectronics NV, ON Semiconductor, Renesas Electronics Corporation, Infineon Technologies A, Texas Instruments Incorporated, Microsemi Conduction, Analog Devices Inc.
3. What are the main segments of the Space Power Electronics Market?
The market segments include Platform, Type, Application.
4. Can you provide details about the market size?
The market size is estimated to be USD 320.35 Million as of 2022.
5. What are some drivers contributing to market growth?
N/A
6. What are the notable trends driving market growth?
Satellites are Expected to Dominate the Market During the Forecast Period.
7. Are there any restraints impacting market growth?
N/A
8. Can you provide examples of recent developments in the market?
N/A
9. What pricing options are available for accessing the report?
Pricing options include single-user, multi-user, and enterprise licenses priced at USD 4750, USD 5250, and USD 8750 respectively.
10. Is the market size provided in terms of value or volume?
The market size is provided in terms of value, measured in Million.
11. Are there any specific market keywords associated with the report?
Yes, the market keyword associated with the report is "Space Power Electronics Market," which aids in identifying and referencing the specific market segment covered.
12. How do I determine which pricing option suits my needs best?
The pricing options vary based on user requirements and access needs. Individual users may opt for single-user licenses, while businesses requiring broader access may choose multi-user or enterprise licenses for cost-effective access to the report.
13. Are there any additional resources or data provided in the Space Power Electronics Market report?
While the report offers comprehensive insights, it's advisable to review the specific contents or supplementary materials provided to ascertain if additional resources or data are available.
14. How can I stay updated on further developments or reports in the Space Power Electronics Market?
To stay informed about further developments, trends, and reports in the Space Power Electronics Market, consider subscribing to industry newsletters, following relevant companies and organizations, or regularly checking reputable industry news sources and publications.
Methodology
Step 1 - Identification of Relevant Samples Size from Population Database


Step 2 - Approaches for Defining Global Market Size (Value, Volume* & Price*)

Note*: In applicable scenarios
Step 3 - Data Sources
Primary Research
- Web Analytics
- Survey Reports
- Research Institute
- Latest Research Reports
- Opinion Leaders
Secondary Research
- Annual Reports
- White Paper
- Latest Press Release
- Industry Association
- Paid Database
- Investor Presentations

Step 4 - Data Triangulation
Involves using different sources of information in order to increase the validity of a study
These sources are likely to be stakeholders in a program - participants, other researchers, program staff, other community members, and so on.
Then we put all data in single framework & apply various statistical tools to find out the dynamic on the market.
During the analysis stage, feedback from the stakeholder groups would be compared to determine areas of agreement as well as areas of divergence