

Key Insights
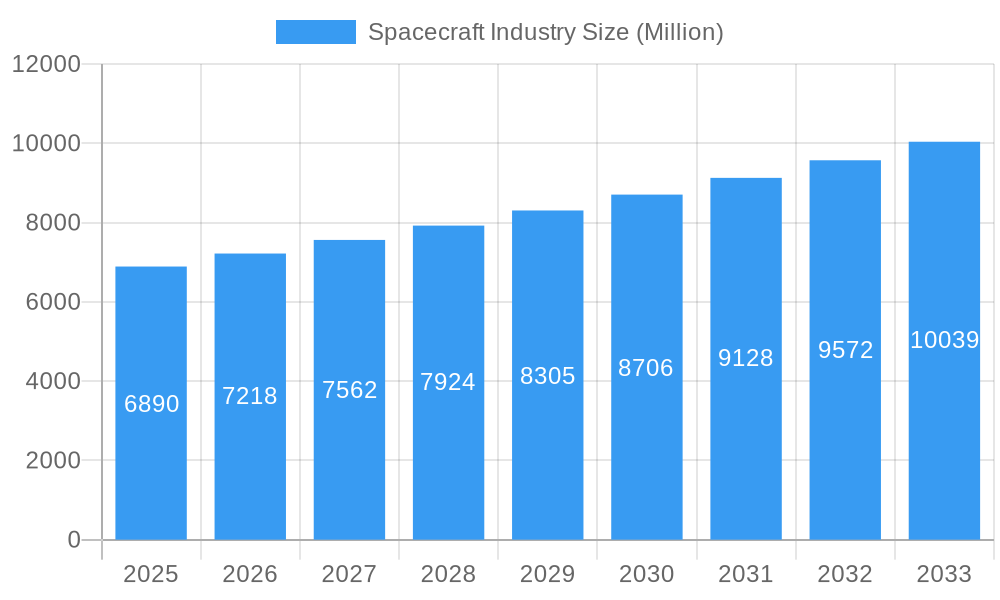
The global spacecraft industry, valued at $6.89 billion in 2025, is projected to experience robust growth, driven by increasing government and private sector investment in space exploration and satellite technology. A compound annual growth rate (CAGR) of 4.74% from 2025 to 2033 indicates a significant expansion of the market, exceeding $10 billion by the end of the forecast period. Key drivers include the burgeoning need for advanced satellite-based communication systems, earth observation, and navigation, as well as the growing commercialization of space through activities like satellite constellation deployments and space tourism. Technological advancements in areas such as propulsion systems, lightweight materials, and miniaturization are also fueling market expansion. The segment encompassing unmanned spacecraft is expected to dominate market share due to cost-effectiveness and increased flexibility compared to manned missions. Competition is fierce, with established aerospace giants like Boeing and Lockheed Martin alongside innovative newcomers such as SpaceX and Blue Origin vying for market share. Geographical distribution shows a strong concentration in North America, due to significant government spending and a robust private space sector, followed by Europe and the Asia-Pacific region, which are experiencing rapid growth fueled by government initiatives and emerging private companies. While regulatory hurdles and high development costs remain constraints, the long-term outlook for the spacecraft industry remains positive, promising further expansion and innovation in the coming decade.
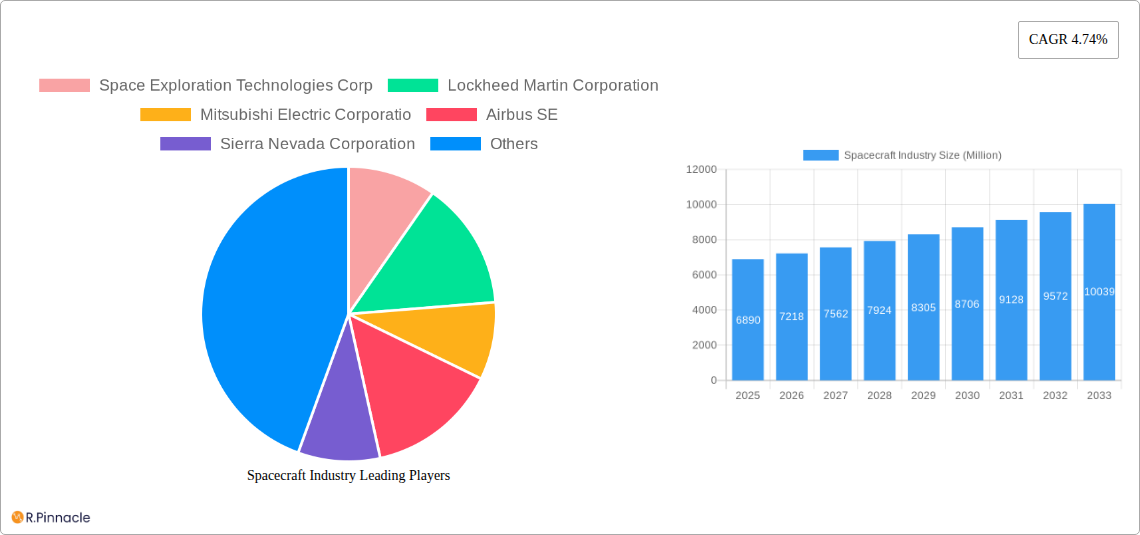
Spacecraft Industry Market Size (In Billion)
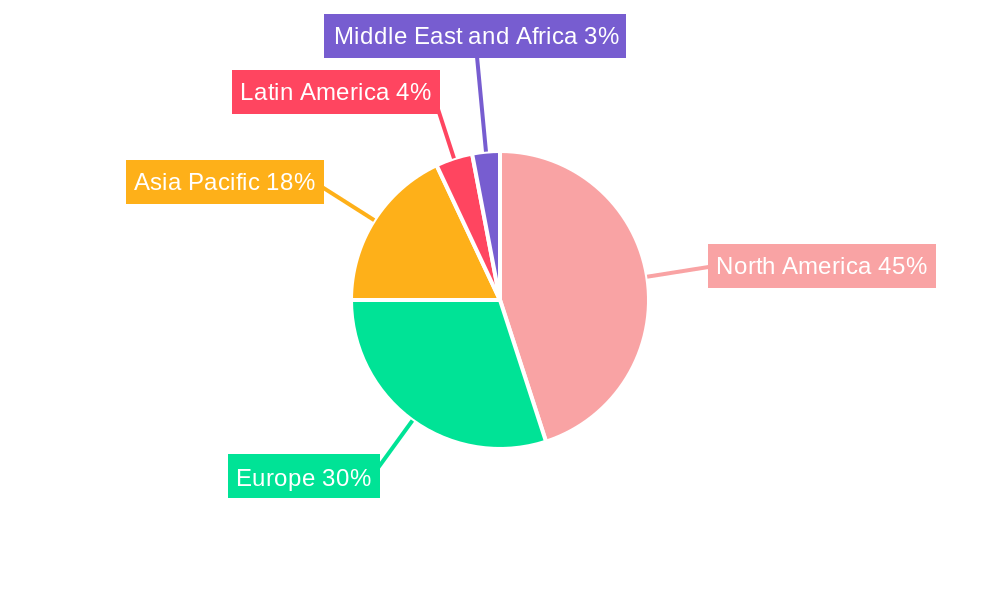
The regional distribution reflects established and emerging space capabilities. North America holds a leading position, driven by substantial government investment and the presence of industry pioneers like SpaceX and Boeing. Europe, with its strong space agency (ESA) and established aerospace industries, also contributes significantly. The Asia-Pacific region is witnessing a surge in activity due to government initiatives and the expansion of private space companies, particularly in China, India, and Japan. Latin America and the Middle East and Africa are emerging markets, with potential for future growth as investments in space technology and infrastructure increase. The market segmentation by type (manned vs. unmanned spacecraft) highlights the dominant role of unmanned spacecraft, reflective of the cost-effectiveness and increasing sophistication of this technology in applications like Earth observation, communication, and scientific research. Further growth is anticipated due to the growing demand for miniaturized satellites and the increased use of constellations for improved coverage and capabilities.
Spacecraft Industry Company Market Share
Spacecraft Industry Market Report: 2019-2033
This comprehensive report provides a detailed analysis of the global spacecraft industry, encompassing market size, growth drivers, competitive landscape, and future outlook. The study period covers 2019-2033, with 2025 as the base and estimated year. The report offers actionable insights for industry professionals, investors, and policymakers involved in this rapidly evolving sector. The market is projected to reach xx Million by 2033, exhibiting a CAGR of xx% during the forecast period (2025-2033).
Spacecraft Industry Market Structure & Innovation Trends
The global spacecraft industry is characterized by a moderately concentrated market structure, where a few established giants hold substantial market share. Key players like Space Exploration Technologies Corp (SpaceX), Lockheed Martin Corporation, and Boeing collectively accounted for an estimated [Insert XX]% of the market in 2025. However, this landscape is increasingly being reshaped by dynamic competition from burgeoning companies such as Blue Origin and Sierra Nevada Corporation, acting as powerful catalysts for innovation and fostering a vibrant, evolving ecosystem.
Key Innovation Drivers:
- Significant and sustained increases in government allocations for ambitious space exploration programs.
- Breakthroughs in launch vehicle technology, leading to substantial reductions in the cost of access to space.
- A burgeoning demand for advanced satellite services, particularly in Earth observation, global communication networks, and sophisticated navigation systems.
- The pioneering development and widespread adoption of reusable spacecraft technologies, dramatically lowering operational expenditures and enhancing mission affordability.
Regulatory Frameworks: The industry's operations are profoundly influenced by a complex interplay of international space law and diverse national regulations. The adherence to stringent safety protocols and comprehensive environmental standards contributes to substantial barriers to entry for new participants.
Mergers & Acquisitions (M&A) Activities: The sector has experienced a notable surge in M&A activity over the past several years, with deal values exceeding [Insert XX] Million during the 2019-2024 period. These strategic acquisitions are largely driven by the pursuit of market consolidation and the integration of highly specialized, cutting-edge technologies.
Spacecraft Industry Market Dynamics & Trends
The spacecraft industry is currently experiencing a phase of vigorous and sustained growth, propelled by a confluence of influential factors. Paramount among these are substantial government investments in space exploration, particularly emanating from leading nations like the United States and China, which serve as foundational pillars for expansion. Concurrently, the escalating demand for a diverse array of satellite-based services—encompassing critical applications in Earth observation, global communication, precise navigation, and vital defense capabilities—is acting as a significant accelerant for market development. Furthermore, the accelerating commercialization of space travel and the burgeoning interest in space tourism are actively carving out novel and lucrative market segments. Technological advancements, notably in the realm of reusable launch vehicles and the miniaturization of satellites, are also making substantial contributions to the industry's upward trajectory. Projections indicate that the market is poised to reach [Insert XX] Million by 2033, exhibiting a Compound Annual Growth Rate (CAGR) of [Insert XX]% during the 2025-2033 forecast period. The penetration of commercial satellite services is steadily increasing, with particularly strong growth observed in emerging economies. The competitive landscape is exceptionally intense, characterized by established industry leaders who are in a perpetual state of striving to maintain their market dominance through relentless innovation, the pursuit of technological superiority, and the cultivation of strategic alliances.
Dominant Regions & Segments in Spacecraft Industry
The North American region holds a dominant position in the global spacecraft industry, accounting for an estimated xx% of the market in 2025. This dominance is driven by substantial government funding, a strong technological base, and a large pool of skilled workforce. Europe is another significant market, with notable contributions from countries like France and Germany.
By Type:
- Manned Spacecraft: This segment is characterized by high technological complexity and significant capital investment. Growth is driven by space tourism initiatives and ongoing international space station programs.
- Unmanned Spacecraft: This segment demonstrates rapid growth owing to the increasing demand for Earth observation, communication, and navigation satellites. The cost-effectiveness and ease of deployment of unmanned spacecraft contribute to their widespread adoption.
Key Drivers for North American Dominance:
- High government spending on space exploration and defense.
- Strong aerospace industry infrastructure and expertise.
- A culture of innovation and entrepreneurship.
Spacecraft Industry Product Innovations
Recent innovations include reusable launch vehicles, advanced satellite technologies (e.g., miniaturization and increased capabilities), and improved spacecraft navigation and control systems. These innovations are leading to reduced launch costs, improved payload capacity, and increased operational efficiency. The market is witnessing the emergence of new applications for spacecraft, including space-based internet services and resource exploration.
Report Scope & Segmentation Analysis
By Type:
- Manned Spacecraft: This segment is expected to witness moderate growth, driven by space tourism and government programs. The market is characterized by a high barrier to entry, with established players like Boeing and SpaceX holding dominant positions.
- Unmanned Spacecraft: This segment is experiencing substantial growth, driven by the increasing demand for satellite-based services. The competitive landscape is more fragmented, with a larger number of companies vying for market share.
Key Drivers of Spacecraft Industry Growth
The spacecraft industry's growth is driven by several factors:
- Increased government spending on space exploration and defense.
- Growing demand for satellite-based services (communication, navigation, earth observation).
- Technological advancements, leading to cost reductions and improved capabilities.
- Commercialization of space activities, including space tourism and resource extraction.
Challenges in the Spacecraft Industry Sector
The spacecraft industry navigates a complex terrain marked by several significant challenges:
- The substantial financial outlays required for spacecraft development and launch operations.
- Navigating intricate regulatory environments and the imperative for effective international cooperation to facilitate operations.
- Potential vulnerabilities within the supply chain and a reliance on highly specialized, sometimes scarce, materials.
- Intensified competition from both established giants and agile emerging enterprises vying for market share.
Emerging Opportunities in Spacecraft Industry
- The expanding potential and increasing consumer interest in the space tourism market.
- The ongoing development and deployment of large-scale, space-based internet constellations promising global connectivity.
- The exploration and eventual utilization of extraterrestrial resources, opening new frontiers for economic activity.
- Significant advancements in artificial intelligence (AI) and machine learning (ML) to enhance the efficiency, autonomy, and capabilities of spacecraft operations.
Leading Players in the Spacecraft Industry Market
Key Developments in Spacecraft Industry
- November 2023: Sierra Space unveiled its latest iteration of the "Dream Chaser" space shuttle. This advanced vehicle is designed to accommodate up to seven astronauts and has secured contracts for seven cargo missions to the International Space Station (ISS). This milestone represents a critical advancement towards the realization of reusable spacecraft and a significant boost to commercial space endeavors.
- January 2024: Japan's successful SLIM lunar landing showcased remarkable progress in precision landing technology. This achievement has the potential to dramatically reduce the cost and complexity associated with future lunar missions, thereby unlocking new avenues for lunar exploration and resource exploitation.
Future Outlook for Spacecraft Industry Market
The spacecraft industry's future is bright, with significant growth potential driven by continued government investment, burgeoning commercial space activities, and technological innovations. The increasing demand for satellite-based services, coupled with the emergence of new applications, will fuel market expansion in the coming years. Strategic partnerships and technological collaborations will play a crucial role in shaping the industry's trajectory.
Spacecraft Industry Segmentation
- 1. Production Analysis
- 2. Consumption Analysis
- 3. Import Market Analysis (Value & Volume)
- 4. Export Market Analysis (Value & Volume)
- 5. Price Trend Analysis
Spacecraft Industry Segmentation By Geography
-
1. North America
- 1.1. United States
- 1.2. Canada
- 1.3. Mexico
-
2. South America
- 2.1. Brazil
- 2.2. Argentina
- 2.3. Rest of South America
-
3. Europe
- 3.1. United Kingdom
- 3.2. Germany
- 3.3. France
- 3.4. Italy
- 3.5. Spain
- 3.6. Russia
- 3.7. Benelux
- 3.8. Nordics
- 3.9. Rest of Europe
-
4. Middle East & Africa
- 4.1. Turkey
- 4.2. Israel
- 4.3. GCC
- 4.4. North Africa
- 4.5. South Africa
- 4.6. Rest of Middle East & Africa
-
5. Asia Pacific
- 5.1. China
- 5.2. India
- 5.3. Japan
- 5.4. South Korea
- 5.5. ASEAN
- 5.6. Oceania
- 5.7. Rest of Asia Pacific
Spacecraft Industry Regional Market Share
Geographic Coverage of Spacecraft Industry
Spacecraft Industry REPORT HIGHLIGHTS
| Aspects | Details |
|---|---|
| Study Period | 2020-2034 |
| Base Year | 2025 |
| Estimated Year | 2026 |
| Forecast Period | 2026-2034 |
| Historical Period | 2020-2025 |
| Growth Rate | CAGR of 4.74% from 2020-2034 |
| Segmentation |
|
Table of Contents
- 1. Introduction
- 1.1. Research Scope
- 1.2. Market Segmentation
- 1.3. Research Objective
- 1.4. Definitions and Assumptions
- 2. Executive Summary
- 2.1. Market Snapshot
- 3. Market Dynamics
- 3.1. Market Drivers
- 3.2. Market Restrains
- 3.3. Market Trends
- 3.4. Market Opportunities
- 4. Market Factor Analysis
- 4.1. Porters Five Forces
- 4.1.1. Bargaining Power of Suppliers
- 4.1.2. Bargaining Power of Buyers
- 4.1.3. Threat of New Entrants
- 4.1.4. Threat of Substitutes
- 4.1.5. Competitive Rivalry
- 4.2. PESTEL analysis
- 4.3. BCG Analysis
- 4.3.1. Stars (High Growth, High Market Share)
- 4.3.2. Cash Cows (Low Growth, High Market Share)
- 4.3.3. Question Mark (High Growth, Low Market Share)
- 4.3.4. Dogs (Low Growth, Low Market Share)
- 4.4. Ansoff Matrix Analysis
- 4.5. Supply Chain Analysis
- 4.6. Regulatory Landscape
- 4.7. Current Market Potential and Opportunity Assessment (TAM–SAM–SOM Framework)
- 4.8. PRI Analyst Note
- 4.1. Porters Five Forces
- 5. Market Analysis, Insights and Forecast 2021-2033
- 5.1. Market Analysis, Insights and Forecast - by Production Analysis
- 5.2. Market Analysis, Insights and Forecast - by Consumption Analysis
- 5.3. Market Analysis, Insights and Forecast - by Import Market Analysis (Value & Volume)
- 5.4. Market Analysis, Insights and Forecast - by Export Market Analysis (Value & Volume)
- 5.5. Market Analysis, Insights and Forecast - by Price Trend Analysis
- 5.6. Market Analysis, Insights and Forecast - by Region
- 5.6.1. North America
- 5.6.2. South America
- 5.6.3. Europe
- 5.6.4. Middle East & Africa
- 5.6.5. Asia Pacific
- 6. Global Spacecraft Industry Analysis, Insights and Forecast, 2021-2033
- 6.1. Market Analysis, Insights and Forecast - by Production Analysis
- 6.2. Market Analysis, Insights and Forecast - by Consumption Analysis
- 6.3. Market Analysis, Insights and Forecast - by Import Market Analysis (Value & Volume)
- 6.4. Market Analysis, Insights and Forecast - by Export Market Analysis (Value & Volume)
- 6.5. Market Analysis, Insights and Forecast - by Price Trend Analysis
- 7. North America Spacecraft Industry Analysis, Insights and Forecast, 2020-2032
- 7.1. Market Analysis, Insights and Forecast - by Production Analysis
- 7.2. Market Analysis, Insights and Forecast - by Consumption Analysis
- 7.3. Market Analysis, Insights and Forecast - by Import Market Analysis (Value & Volume)
- 7.4. Market Analysis, Insights and Forecast - by Export Market Analysis (Value & Volume)
- 7.5. Market Analysis, Insights and Forecast - by Price Trend Analysis
- 8. South America Spacecraft Industry Analysis, Insights and Forecast, 2020-2032
- 8.1. Market Analysis, Insights and Forecast - by Production Analysis
- 8.2. Market Analysis, Insights and Forecast - by Consumption Analysis
- 8.3. Market Analysis, Insights and Forecast - by Import Market Analysis (Value & Volume)
- 8.4. Market Analysis, Insights and Forecast - by Export Market Analysis (Value & Volume)
- 8.5. Market Analysis, Insights and Forecast - by Price Trend Analysis
- 9. Europe Spacecraft Industry Analysis, Insights and Forecast, 2020-2032
- 9.1. Market Analysis, Insights and Forecast - by Production Analysis
- 9.2. Market Analysis, Insights and Forecast - by Consumption Analysis
- 9.3. Market Analysis, Insights and Forecast - by Import Market Analysis (Value & Volume)
- 9.4. Market Analysis, Insights and Forecast - by Export Market Analysis (Value & Volume)
- 9.5. Market Analysis, Insights and Forecast - by Price Trend Analysis
- 10. Middle East & Africa Spacecraft Industry Analysis, Insights and Forecast, 2020-2032
- 10.1. Market Analysis, Insights and Forecast - by Production Analysis
- 10.2. Market Analysis, Insights and Forecast - by Consumption Analysis
- 10.3. Market Analysis, Insights and Forecast - by Import Market Analysis (Value & Volume)
- 10.4. Market Analysis, Insights and Forecast - by Export Market Analysis (Value & Volume)
- 10.5. Market Analysis, Insights and Forecast - by Price Trend Analysis
- 11. Asia Pacific Spacecraft Industry Analysis, Insights and Forecast, 2020-2032
- 11.1. Market Analysis, Insights and Forecast - by Production Analysis
- 11.2. Market Analysis, Insights and Forecast - by Consumption Analysis
- 11.3. Market Analysis, Insights and Forecast - by Import Market Analysis (Value & Volume)
- 11.4. Market Analysis, Insights and Forecast - by Export Market Analysis (Value & Volume)
- 11.5. Market Analysis, Insights and Forecast - by Price Trend Analysis
- 12. Competitive Analysis
- 12.1. Company Profiles
- 12.1.1 Space Exploration Technologies Corp
- 12.1.1.1. Company Overview
- 12.1.1.2. Products
- 12.1.1.3. Company Financials
- 12.1.1.4. SWOT Analysis
- 12.1.2 Lockheed Martin Corporation
- 12.1.2.1. Company Overview
- 12.1.2.2. Products
- 12.1.2.3. Company Financials
- 12.1.2.4. SWOT Analysis
- 12.1.3 Mitsubishi Electric Corporatio
- 12.1.3.1. Company Overview
- 12.1.3.2. Products
- 12.1.3.3. Company Financials
- 12.1.3.4. SWOT Analysis
- 12.1.4 Airbus SE
- 12.1.4.1. Company Overview
- 12.1.4.2. Products
- 12.1.4.3. Company Financials
- 12.1.4.4. SWOT Analysis
- 12.1.5 Sierra Nevada Corporation
- 12.1.5.1. Company Overview
- 12.1.5.2. Products
- 12.1.5.3. Company Financials
- 12.1.5.4. SWOT Analysis
- 12.1.6 QinetiQ Group
- 12.1.6.1. Company Overview
- 12.1.6.2. Products
- 12.1.6.3. Company Financials
- 12.1.6.4. SWOT Analysis
- 12.1.7 OHB SE
- 12.1.7.1. Company Overview
- 12.1.7.2. Products
- 12.1.7.3. Company Financials
- 12.1.7.4. SWOT Analysis
- 12.1.8 Maxar Technologies Inc
- 12.1.8.1. Company Overview
- 12.1.8.2. Products
- 12.1.8.3. Company Financials
- 12.1.8.4. SWOT Analysis
- 12.1.9 Blue Origin LLC
- 12.1.9.1. Company Overview
- 12.1.9.2. Products
- 12.1.9.3. Company Financials
- 12.1.9.4. SWOT Analysis
- 12.1.10 Berlin Space Technologies GmbH
- 12.1.10.1. Company Overview
- 12.1.10.2. Products
- 12.1.10.3. Company Financials
- 12.1.10.4. SWOT Analysis
- 12.1.11 Northrop Grumman Corporation
- 12.1.11.1. Company Overview
- 12.1.11.2. Products
- 12.1.11.3. Company Financials
- 12.1.11.4. SWOT Analysis
- 12.1.12 The Boeing Company
- 12.1.12.1. Company Overview
- 12.1.12.2. Products
- 12.1.12.3. Company Financials
- 12.1.12.4. SWOT Analysis
- 12.1.1 Space Exploration Technologies Corp
- 12.2. Market Entropy
- 12.2.1 Company's Key Areas Served
- 12.2.2 Recent Developments
- 12.3. Company Market Share Analysis 2025
- 12.3.1 Top 5 Companies Market Share Analysis
- 12.3.2 Top 3 Companies Market Share Analysis
- 12.4. List of Potential Customers
- 13. Research Methodology
List of Figures
- Figure 1: Global Spacecraft Industry Revenue Breakdown (Million, %) by Region 2025 & 2033
- Figure 2: North America Spacecraft Industry Revenue (Million), by Production Analysis 2025 & 2033
- Figure 3: North America Spacecraft Industry Revenue Share (%), by Production Analysis 2025 & 2033
- Figure 4: North America Spacecraft Industry Revenue (Million), by Consumption Analysis 2025 & 2033
- Figure 5: North America Spacecraft Industry Revenue Share (%), by Consumption Analysis 2025 & 2033
- Figure 6: North America Spacecraft Industry Revenue (Million), by Import Market Analysis (Value & Volume) 2025 & 2033
- Figure 7: North America Spacecraft Industry Revenue Share (%), by Import Market Analysis (Value & Volume) 2025 & 2033
- Figure 8: North America Spacecraft Industry Revenue (Million), by Export Market Analysis (Value & Volume) 2025 & 2033
- Figure 9: North America Spacecraft Industry Revenue Share (%), by Export Market Analysis (Value & Volume) 2025 & 2033
- Figure 10: North America Spacecraft Industry Revenue (Million), by Price Trend Analysis 2025 & 2033
- Figure 11: North America Spacecraft Industry Revenue Share (%), by Price Trend Analysis 2025 & 2033
- Figure 12: North America Spacecraft Industry Revenue (Million), by Country 2025 & 2033
- Figure 13: North America Spacecraft Industry Revenue Share (%), by Country 2025 & 2033
- Figure 14: South America Spacecraft Industry Revenue (Million), by Production Analysis 2025 & 2033
- Figure 15: South America Spacecraft Industry Revenue Share (%), by Production Analysis 2025 & 2033
- Figure 16: South America Spacecraft Industry Revenue (Million), by Consumption Analysis 2025 & 2033
- Figure 17: South America Spacecraft Industry Revenue Share (%), by Consumption Analysis 2025 & 2033
- Figure 18: South America Spacecraft Industry Revenue (Million), by Import Market Analysis (Value & Volume) 2025 & 2033
- Figure 19: South America Spacecraft Industry Revenue Share (%), by Import Market Analysis (Value & Volume) 2025 & 2033
- Figure 20: South America Spacecraft Industry Revenue (Million), by Export Market Analysis (Value & Volume) 2025 & 2033
- Figure 21: South America Spacecraft Industry Revenue Share (%), by Export Market Analysis (Value & Volume) 2025 & 2033
- Figure 22: South America Spacecraft Industry Revenue (Million), by Price Trend Analysis 2025 & 2033
- Figure 23: South America Spacecraft Industry Revenue Share (%), by Price Trend Analysis 2025 & 2033
- Figure 24: South America Spacecraft Industry Revenue (Million), by Country 2025 & 2033
- Figure 25: South America Spacecraft Industry Revenue Share (%), by Country 2025 & 2033
- Figure 26: Europe Spacecraft Industry Revenue (Million), by Production Analysis 2025 & 2033
- Figure 27: Europe Spacecraft Industry Revenue Share (%), by Production Analysis 2025 & 2033
- Figure 28: Europe Spacecraft Industry Revenue (Million), by Consumption Analysis 2025 & 2033
- Figure 29: Europe Spacecraft Industry Revenue Share (%), by Consumption Analysis 2025 & 2033
- Figure 30: Europe Spacecraft Industry Revenue (Million), by Import Market Analysis (Value & Volume) 2025 & 2033
- Figure 31: Europe Spacecraft Industry Revenue Share (%), by Import Market Analysis (Value & Volume) 2025 & 2033
- Figure 32: Europe Spacecraft Industry Revenue (Million), by Export Market Analysis (Value & Volume) 2025 & 2033
- Figure 33: Europe Spacecraft Industry Revenue Share (%), by Export Market Analysis (Value & Volume) 2025 & 2033
- Figure 34: Europe Spacecraft Industry Revenue (Million), by Price Trend Analysis 2025 & 2033
- Figure 35: Europe Spacecraft Industry Revenue Share (%), by Price Trend Analysis 2025 & 2033
- Figure 36: Europe Spacecraft Industry Revenue (Million), by Country 2025 & 2033
- Figure 37: Europe Spacecraft Industry Revenue Share (%), by Country 2025 & 2033
- Figure 38: Middle East & Africa Spacecraft Industry Revenue (Million), by Production Analysis 2025 & 2033
- Figure 39: Middle East & Africa Spacecraft Industry Revenue Share (%), by Production Analysis 2025 & 2033
- Figure 40: Middle East & Africa Spacecraft Industry Revenue (Million), by Consumption Analysis 2025 & 2033
- Figure 41: Middle East & Africa Spacecraft Industry Revenue Share (%), by Consumption Analysis 2025 & 2033
- Figure 42: Middle East & Africa Spacecraft Industry Revenue (Million), by Import Market Analysis (Value & Volume) 2025 & 2033
- Figure 43: Middle East & Africa Spacecraft Industry Revenue Share (%), by Import Market Analysis (Value & Volume) 2025 & 2033
- Figure 44: Middle East & Africa Spacecraft Industry Revenue (Million), by Export Market Analysis (Value & Volume) 2025 & 2033
- Figure 45: Middle East & Africa Spacecraft Industry Revenue Share (%), by Export Market Analysis (Value & Volume) 2025 & 2033
- Figure 46: Middle East & Africa Spacecraft Industry Revenue (Million), by Price Trend Analysis 2025 & 2033
- Figure 47: Middle East & Africa Spacecraft Industry Revenue Share (%), by Price Trend Analysis 2025 & 2033
- Figure 48: Middle East & Africa Spacecraft Industry Revenue (Million), by Country 2025 & 2033
- Figure 49: Middle East & Africa Spacecraft Industry Revenue Share (%), by Country 2025 & 2033
- Figure 50: Asia Pacific Spacecraft Industry Revenue (Million), by Production Analysis 2025 & 2033
- Figure 51: Asia Pacific Spacecraft Industry Revenue Share (%), by Production Analysis 2025 & 2033
- Figure 52: Asia Pacific Spacecraft Industry Revenue (Million), by Consumption Analysis 2025 & 2033
- Figure 53: Asia Pacific Spacecraft Industry Revenue Share (%), by Consumption Analysis 2025 & 2033
- Figure 54: Asia Pacific Spacecraft Industry Revenue (Million), by Import Market Analysis (Value & Volume) 2025 & 2033
- Figure 55: Asia Pacific Spacecraft Industry Revenue Share (%), by Import Market Analysis (Value & Volume) 2025 & 2033
- Figure 56: Asia Pacific Spacecraft Industry Revenue (Million), by Export Market Analysis (Value & Volume) 2025 & 2033
- Figure 57: Asia Pacific Spacecraft Industry Revenue Share (%), by Export Market Analysis (Value & Volume) 2025 & 2033
- Figure 58: Asia Pacific Spacecraft Industry Revenue (Million), by Price Trend Analysis 2025 & 2033
- Figure 59: Asia Pacific Spacecraft Industry Revenue Share (%), by Price Trend Analysis 2025 & 2033
- Figure 60: Asia Pacific Spacecraft Industry Revenue (Million), by Country 2025 & 2033
- Figure 61: Asia Pacific Spacecraft Industry Revenue Share (%), by Country 2025 & 2033
List of Tables
- Table 1: Global Spacecraft Industry Revenue Million Forecast, by Production Analysis 2020 & 2033
- Table 2: Global Spacecraft Industry Revenue Million Forecast, by Consumption Analysis 2020 & 2033
- Table 3: Global Spacecraft Industry Revenue Million Forecast, by Import Market Analysis (Value & Volume) 2020 & 2033
- Table 4: Global Spacecraft Industry Revenue Million Forecast, by Export Market Analysis (Value & Volume) 2020 & 2033
- Table 5: Global Spacecraft Industry Revenue Million Forecast, by Price Trend Analysis 2020 & 2033
- Table 6: Global Spacecraft Industry Revenue Million Forecast, by Region 2020 & 2033
- Table 7: Global Spacecraft Industry Revenue Million Forecast, by Production Analysis 2020 & 2033
- Table 8: Global Spacecraft Industry Revenue Million Forecast, by Consumption Analysis 2020 & 2033
- Table 9: Global Spacecraft Industry Revenue Million Forecast, by Import Market Analysis (Value & Volume) 2020 & 2033
- Table 10: Global Spacecraft Industry Revenue Million Forecast, by Export Market Analysis (Value & Volume) 2020 & 2033
- Table 11: Global Spacecraft Industry Revenue Million Forecast, by Price Trend Analysis 2020 & 2033
- Table 12: Global Spacecraft Industry Revenue Million Forecast, by Country 2020 & 2033
- Table 13: United States Spacecraft Industry Revenue (Million) Forecast, by Application 2020 & 2033
- Table 14: Canada Spacecraft Industry Revenue (Million) Forecast, by Application 2020 & 2033
- Table 15: Mexico Spacecraft Industry Revenue (Million) Forecast, by Application 2020 & 2033
- Table 16: Global Spacecraft Industry Revenue Million Forecast, by Production Analysis 2020 & 2033
- Table 17: Global Spacecraft Industry Revenue Million Forecast, by Consumption Analysis 2020 & 2033
- Table 18: Global Spacecraft Industry Revenue Million Forecast, by Import Market Analysis (Value & Volume) 2020 & 2033
- Table 19: Global Spacecraft Industry Revenue Million Forecast, by Export Market Analysis (Value & Volume) 2020 & 2033
- Table 20: Global Spacecraft Industry Revenue Million Forecast, by Price Trend Analysis 2020 & 2033
- Table 21: Global Spacecraft Industry Revenue Million Forecast, by Country 2020 & 2033
- Table 22: Brazil Spacecraft Industry Revenue (Million) Forecast, by Application 2020 & 2033
- Table 23: Argentina Spacecraft Industry Revenue (Million) Forecast, by Application 2020 & 2033
- Table 24: Rest of South America Spacecraft Industry Revenue (Million) Forecast, by Application 2020 & 2033
- Table 25: Global Spacecraft Industry Revenue Million Forecast, by Production Analysis 2020 & 2033
- Table 26: Global Spacecraft Industry Revenue Million Forecast, by Consumption Analysis 2020 & 2033
- Table 27: Global Spacecraft Industry Revenue Million Forecast, by Import Market Analysis (Value & Volume) 2020 & 2033
- Table 28: Global Spacecraft Industry Revenue Million Forecast, by Export Market Analysis (Value & Volume) 2020 & 2033
- Table 29: Global Spacecraft Industry Revenue Million Forecast, by Price Trend Analysis 2020 & 2033
- Table 30: Global Spacecraft Industry Revenue Million Forecast, by Country 2020 & 2033
- Table 31: United Kingdom Spacecraft Industry Revenue (Million) Forecast, by Application 2020 & 2033
- Table 32: Germany Spacecraft Industry Revenue (Million) Forecast, by Application 2020 & 2033
- Table 33: France Spacecraft Industry Revenue (Million) Forecast, by Application 2020 & 2033
- Table 34: Italy Spacecraft Industry Revenue (Million) Forecast, by Application 2020 & 2033
- Table 35: Spain Spacecraft Industry Revenue (Million) Forecast, by Application 2020 & 2033
- Table 36: Russia Spacecraft Industry Revenue (Million) Forecast, by Application 2020 & 2033
- Table 37: Benelux Spacecraft Industry Revenue (Million) Forecast, by Application 2020 & 2033
- Table 38: Nordics Spacecraft Industry Revenue (Million) Forecast, by Application 2020 & 2033
- Table 39: Rest of Europe Spacecraft Industry Revenue (Million) Forecast, by Application 2020 & 2033
- Table 40: Global Spacecraft Industry Revenue Million Forecast, by Production Analysis 2020 & 2033
- Table 41: Global Spacecraft Industry Revenue Million Forecast, by Consumption Analysis 2020 & 2033
- Table 42: Global Spacecraft Industry Revenue Million Forecast, by Import Market Analysis (Value & Volume) 2020 & 2033
- Table 43: Global Spacecraft Industry Revenue Million Forecast, by Export Market Analysis (Value & Volume) 2020 & 2033
- Table 44: Global Spacecraft Industry Revenue Million Forecast, by Price Trend Analysis 2020 & 2033
- Table 45: Global Spacecraft Industry Revenue Million Forecast, by Country 2020 & 2033
- Table 46: Turkey Spacecraft Industry Revenue (Million) Forecast, by Application 2020 & 2033
- Table 47: Israel Spacecraft Industry Revenue (Million) Forecast, by Application 2020 & 2033
- Table 48: GCC Spacecraft Industry Revenue (Million) Forecast, by Application 2020 & 2033
- Table 49: North Africa Spacecraft Industry Revenue (Million) Forecast, by Application 2020 & 2033
- Table 50: South Africa Spacecraft Industry Revenue (Million) Forecast, by Application 2020 & 2033
- Table 51: Rest of Middle East & Africa Spacecraft Industry Revenue (Million) Forecast, by Application 2020 & 2033
- Table 52: Global Spacecraft Industry Revenue Million Forecast, by Production Analysis 2020 & 2033
- Table 53: Global Spacecraft Industry Revenue Million Forecast, by Consumption Analysis 2020 & 2033
- Table 54: Global Spacecraft Industry Revenue Million Forecast, by Import Market Analysis (Value & Volume) 2020 & 2033
- Table 55: Global Spacecraft Industry Revenue Million Forecast, by Export Market Analysis (Value & Volume) 2020 & 2033
- Table 56: Global Spacecraft Industry Revenue Million Forecast, by Price Trend Analysis 2020 & 2033
- Table 57: Global Spacecraft Industry Revenue Million Forecast, by Country 2020 & 2033
- Table 58: China Spacecraft Industry Revenue (Million) Forecast, by Application 2020 & 2033
- Table 59: India Spacecraft Industry Revenue (Million) Forecast, by Application 2020 & 2033
- Table 60: Japan Spacecraft Industry Revenue (Million) Forecast, by Application 2020 & 2033
- Table 61: South Korea Spacecraft Industry Revenue (Million) Forecast, by Application 2020 & 2033
- Table 62: ASEAN Spacecraft Industry Revenue (Million) Forecast, by Application 2020 & 2033
- Table 63: Oceania Spacecraft Industry Revenue (Million) Forecast, by Application 2020 & 2033
- Table 64: Rest of Asia Pacific Spacecraft Industry Revenue (Million) Forecast, by Application 2020 & 2033
Frequently Asked Questions
1. What is the projected Compound Annual Growth Rate (CAGR) of the Spacecraft Industry?
The projected CAGR is approximately 4.74%.
2. Which companies are prominent players in the Spacecraft Industry?
Key companies in the market include Space Exploration Technologies Corp, Lockheed Martin Corporation, Mitsubishi Electric Corporatio, Airbus SE, Sierra Nevada Corporation, QinetiQ Group, OHB SE, Maxar Technologies Inc, Blue Origin LLC, Berlin Space Technologies GmbH, Northrop Grumman Corporation, The Boeing Company.
3. What are the main segments of the Spacecraft Industry?
The market segments include Production Analysis, Consumption Analysis, Import Market Analysis (Value & Volume), Export Market Analysis (Value & Volume), Price Trend Analysis.
4. Can you provide details about the market size?
The market size is estimated to be USD 6.89 Million as of 2022.
5. What are some drivers contributing to market growth?
Increase in Internet of Things (IoT) and Autonomous Systems; Rise in Demand for Military and Defense Satellite Communication Solutions.
6. What are the notable trends driving market growth?
Unmanned Spacecraft to Dominate Market Share During the Forecast Period.
7. Are there any restraints impacting market growth?
Cybersecurity Threats to Satellite Communication; Interference in Transmission of Data.
8. Can you provide examples of recent developments in the market?
January 2024: Japan launched a spacecraft on the Moon to demonstrate precision landing technology and reinvigorate its space program. The Japan Aerospace Exploration Agency's (JAXA) Smart Lander for Investigating Moon (SLIM) landed on the Moon's surface and re-established communication with Earth. By reducing the cost of launching, Japan aims to carry out more frequent missions in the future.
9. What pricing options are available for accessing the report?
Pricing options include single-user, multi-user, and enterprise licenses priced at USD 4750, USD 5250, and USD 8750 respectively.
10. Is the market size provided in terms of value or volume?
The market size is provided in terms of value, measured in Million.
11. Are there any specific market keywords associated with the report?
Yes, the market keyword associated with the report is "Spacecraft Industry," which aids in identifying and referencing the specific market segment covered.
12. How do I determine which pricing option suits my needs best?
The pricing options vary based on user requirements and access needs. Individual users may opt for single-user licenses, while businesses requiring broader access may choose multi-user or enterprise licenses for cost-effective access to the report.
13. Are there any additional resources or data provided in the Spacecraft Industry report?
While the report offers comprehensive insights, it's advisable to review the specific contents or supplementary materials provided to ascertain if additional resources or data are available.
14. How can I stay updated on further developments or reports in the Spacecraft Industry?
To stay informed about further developments, trends, and reports in the Spacecraft Industry, consider subscribing to industry newsletters, following relevant companies and organizations, or regularly checking reputable industry news sources and publications.
Methodology
Step 1 - Identification of Relevant Samples Size from Population Database


Step 2 - Approaches for Defining Global Market Size (Value, Volume* & Price*)

Note*: In applicable scenarios
Step 3 - Data Sources
Primary Research
- Web Analytics
- Survey Reports
- Research Institute
- Latest Research Reports
- Opinion Leaders
Secondary Research
- Annual Reports
- White Paper
- Latest Press Release
- Industry Association
- Paid Database
- Investor Presentations

Step 4 - Data Triangulation
Involves using different sources of information in order to increase the validity of a study
These sources are likely to be stakeholders in a program - participants, other researchers, program staff, other community members, and so on.
Then we put all data in single framework & apply various statistical tools to find out the dynamic on the market.
During the analysis stage, feedback from the stakeholder groups would be compared to determine areas of agreement as well as areas of divergence