


Key Insights into the Specialty Insurance Market
The global Specialty Insurance Market, a critical component of the broader financial services landscape, was valued at USD 100.4 billion in 2024. Projections indicate robust expansion, with the market anticipated to reach approximately USD 197.5 billion by 2034, exhibiting a compound annual growth rate (CAGR) of 7% over the forecast period. This significant growth is primarily underpinned by an escalating global risk landscape characterized by heightened geopolitical instability, climate change impacts, and sophisticated cyber threats. The inherent complexity of modern business operations, coupled with the increasing demand for highly customized and niche risk transfer solutions, serves as a primary demand driver.
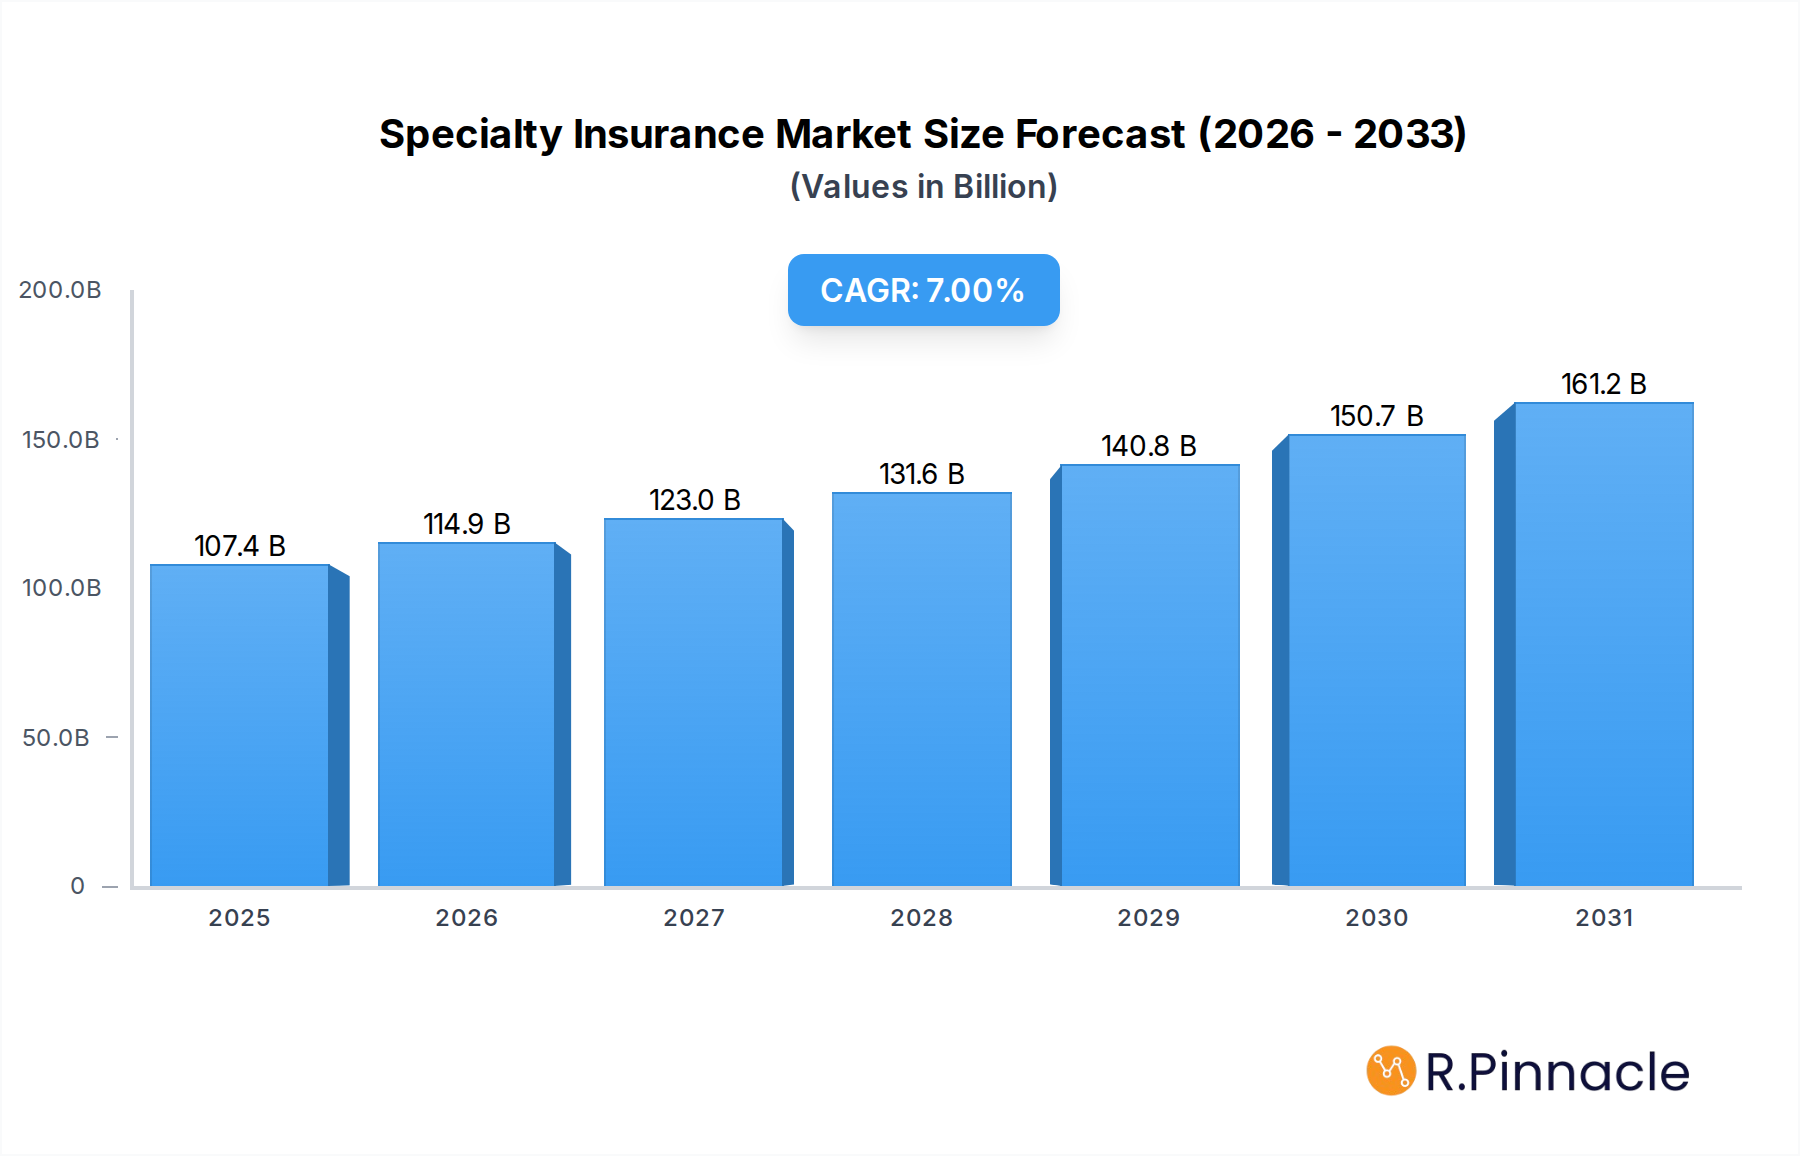
Specialty Insurance Market Size (In Billion)

Macroeconomic tailwinds include sustained global economic expansion, albeit with regional variations, driving capital-intensive projects and specialized industrial operations that require bespoke coverage. The rapid pace of technological innovation, particularly within the Technology, Media, and Telecom (TMT) sector, introduces novel risks that traditional insurance products cannot adequately address. This fuels demand for specialized policies covering areas such as intellectual property, advanced robotics, and data breaches, thereby expanding the addressable Specialty Insurance Market. Furthermore, evolving regulatory frameworks across various jurisdictions are mandating specific insurance coverages, particularly in sectors like environmental protection, professional liabilities, and data privacy. This regulatory push compels enterprises to seek out specialized insurance products that ensure compliance and mitigate potential legal and financial repercussions. The increasing awareness among businesses, from large multinational corporations to Small & Medium Enterprises (SMEs), regarding their unique risk exposures, also contributes significantly to market buoyancy. As businesses digitalize and integrate advanced technologies, the reliance on robust and innovative insurance solutions for areas like cyber resilience, supply chain disruptions, and operational technology (OT) risks becomes paramount. The forward-looking outlook suggests that the Specialty Insurance Market will continue to be a dynamic and adaptive sector, driven by its capacity to innovate and provide tailored risk management strategies for an increasingly interconnected and risk-prone world.
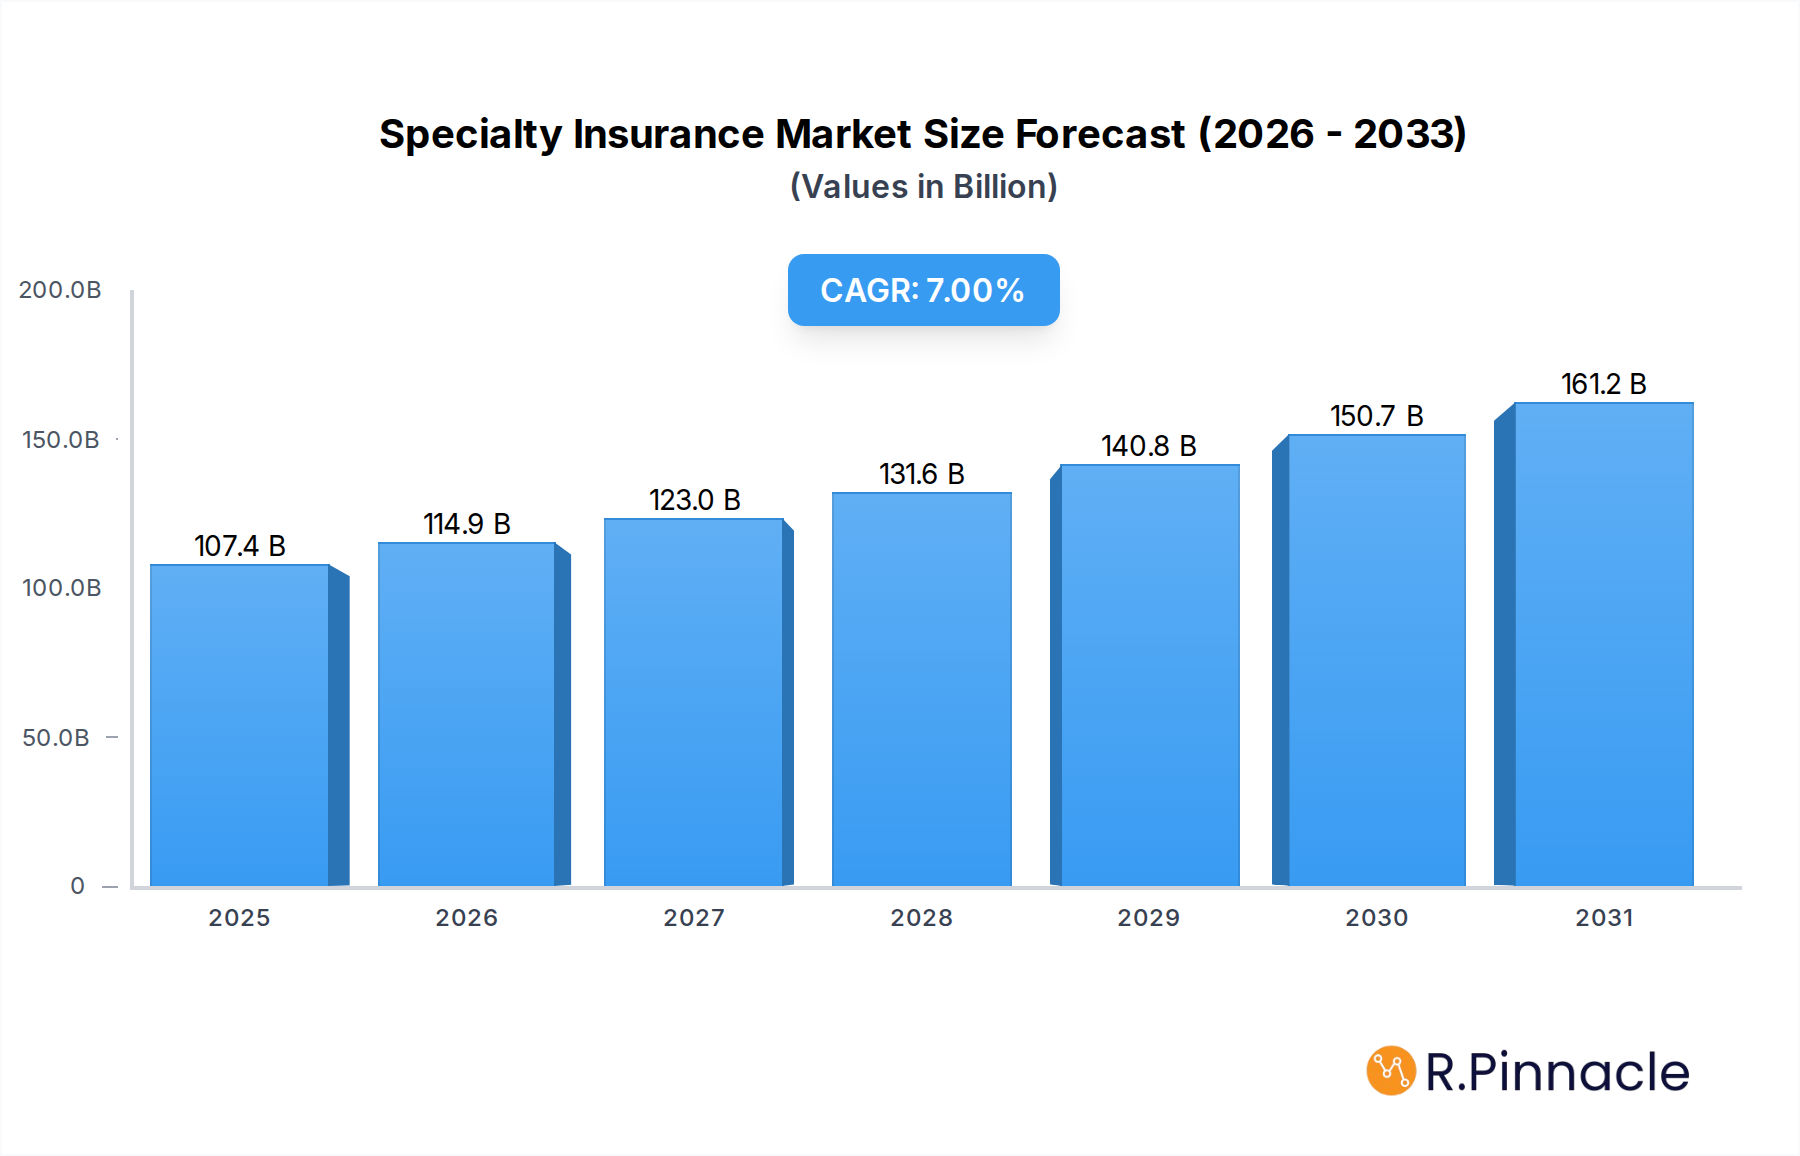
Specialty Insurance Company Market Share
Dominant Distribution Channels in Specialty Insurance Market
Within the highly specialized landscape of the Specialty Insurance Market, distribution channels play a pivotal role in connecting complex risk profiles with tailored underwriting expertise. Among these, the 'Brokers & Agents' segment consistently commands the largest revenue share, acting as the primary conduit for the vast majority of specialty insurance placements. This dominance stems from several fundamental characteristics inherent to specialty insurance. Unlike commoditized insurance products, specialty lines often involve unique, complex, and high-value risks that require deep domain expertise to assess, structure, and place. Brokers and agents possess this specialized knowledge, acting as trusted advisors to clients, guiding them through intricate policy terms, and navigating the often-fragmented global insurance capacity.
Their value proposition is multi-faceted. Brokers offer clients comprehensive risk assessments, helping them identify exposures that might otherwise be overlooked. They leverage extensive networks with multiple specialty insurers, including key players in the Specialty Insurance Market such as AIG, Chubb, Zurich Insurance Group, and Lloyd's of London, to source the most appropriate coverage and competitive terms. This access to a wide array of underwriters is crucial for risks that require syndicated capacity or highly customized wordings, which are common in areas like aviation, marine, professional lines, and complex property risks. The expertise of brokers also extends to claims advocacy, where they assist clients in navigating the claims process, often leading to more favorable outcomes. While 'Direct Sales' channels are growing, particularly with the proliferation of Digital Platforms Market and InsurTech innovations, they typically cater to less complex or more standardized specialty offerings. Bancassurance and digital platforms, while expanding rapidly, have yet to fully replicate the bespoke advisory and placement capabilities that brokers provide for truly unique and challenging risks. Therefore, the 'Brokers & Agents' segment is not only dominant but is also characterized by continuous innovation in service delivery, leveraging Data Analytics Market and other technologies to enhance client value, even as the broader Specialty Insurance Market undergoes digital transformation. While their share may face some erosion from the rise of direct digital channels, the inherent need for expert intermediation in complex risk transfer is expected to ensure the continued prominence of brokers and agents in the foreseeable future.
Key Market Drivers and Constraints in Specialty Insurance Market
The Specialty Insurance Market is profoundly influenced by a confluence of drivers and constraints that shape its trajectory and operational dynamics. A primary driver is the escalating complexity and interconnectedness of global risks. Modern businesses face an increasingly intricate web of threats, ranging from sophisticated cyberattacks to supply chain disruptions and climate-related perils. For instance, the growing frequency and severity of ransomware incidents drive significant demand for sophisticated Cyber Liability Insurance Market policies, with companies in the Technology, Media, and Telecom (TMT) sector being particularly exposed. Similarly, the increasing global trade volumes and the expanding Ocean Marine Insurance Market underscore the need for advanced marine and cargo coverages.
Another significant driver is technological integration and advancement. The rapid adoption of emerging technologies such such as the Internet of Things Market and Cloud Computing Market across industries creates new insurable exposures. This necessitates innovative product development by insurers, leveraging advanced analytics and telematics to assess and price these novel risks. The continuous evolution of Data Analytics Market capabilities allows insurers to gain deeper insights into risk patterns, leading to more granular underwriting and personalized policy offerings. Conversely, the high capital requirements and underwriting expertise act as a significant constraint. Specialty insurance often involves large, infrequent losses and requires substantial capital reserves, limiting the number of participants. The specialized nature of underwriting, requiring deep industry-specific knowledge in areas like aviation, energy, or professional liability, contributes to a talent gap, making it challenging for new entrants to compete effectively. Furthermore, regulatory changes and compliance costs can restrain growth, as insurers must constantly adapt to evolving international and local regulations concerning solvency, data privacy, and market conduct. For example, stringent data protection laws impact how insurers collect and process customer data, adding to operational complexities within the Healthcare & Life Sciences Market and other sensitive sectors. Lastly, pricing volatility due to large-scale catastrophic events or sudden shifts in market capacity can create instability, making long-term planning difficult for both insurers and policyholders in various segments, including the Commercial Auto Insurance Market where accident severity and frequency can fluctuate.
Competitive Ecosystem of Specialty Insurance Market
The Specialty Insurance Market is characterized by a diverse competitive landscape, featuring global insurance giants and specialized underwriters. Key players constantly adapt to evolving risks and capitalize on emerging opportunities:
- AIG: A leading global insurer known for its extensive portfolio of specialty products, including executive liability, political risk, and environmental insurance, catering to large corporate clients.
- Chubb: Recognized for its broad range of specialty property & casualty insurance products and services, serving high-net-worth individuals, small and mid-size businesses, and large corporations.
- Zurich Insurance Group: A significant player globally, offering a wide array of specialty lines such as professional liability, aviation, and marine insurance, often through its commercial and corporate divisions.
- Allianz: One of the largest insurers worldwide, with a strong presence in specialty segments like corporate risk, marine, and engineering insurance, supported by its global network.
- AXA XL: The property & casualty and specialty risk division of AXA, providing complex risk solutions for various industries, including professional and financial lines, aviation, and energy.
- Munich Re: A prominent global reinsurer that also underwrites specialty primary insurance, particularly in large industrial risks, cyber, and specialty property and casualty lines.
- Swiss Re: Another leading global reinsurer with a significant primary insurance arm, offering bespoke solutions for complex corporate and specialty risks worldwide.
- The Hartford: Provides a diverse portfolio of specialty insurance products, including professional liability, marine, and excess casualty, primarily serving the U.S. market.
- Travelers: Offers a comprehensive suite of specialty insurance, including commercial property, general liability, and professional liability, catering to various business sectors.
- Liberty Mutual: A global insurer providing a wide range of specialty coverages, such as marine, aviation, and specialty construction, for businesses of all sizes.
- Tokio Marine Holdings: A major Japanese insurance group with a strong international presence in specialty lines, including marine, energy, and aviation insurance.
- Lloyd's of London: A unique insurance market recognized globally for its capacity to underwrite complex, unusual, and specialized risks, often acting as a hub for global specialty insurance.
- Sompo Holdings: A Japanese insurance group expanding its global specialty footprint, offering solutions in areas like marine, property, and casualty insurance to international clients.
Recent Developments & Milestones in Specialty Insurance Market
The dynamic Specialty Insurance Market is continually shaped by strategic initiatives, technological integrations, and evolving risk landscapes. The following developments highlight key trends:
- Jan 2024: Several leading insurers within the Specialty Insurance Market announced the launch of advanced AI-driven underwriting platforms, aiming to enhance the speed and accuracy of risk assessment for complex policies, particularly those related to niche technological risks.
- Apr 2024: A major global insurer completed the acquisition of a prominent insurtech startup specializing in parametric insurance solutions for climate-related risks, expanding its offering in environmental specialty lines.
- Jul 2024: New regulatory guidance on data privacy and cybersecurity standards was introduced in key European markets, compelling insurers to adapt their underwriting processes and influencing product design in the
Cyber Liability Insurance Marketand the broaderData Analytics Marketfor risk assessment. - Oct 2024: A consortium of specialty insurers partnered with technology providers to develop bespoke insurance products specifically designed for the growing
Internet of Things Market, addressing liability and operational risks associated with interconnected devices. - Dec 2024: A significant expansion into emerging economies for
Ocean Marine Insurance Marketofferings was announced by a global player, capitalizing on increasing trade flows and infrastructure development in Southeast Asia. - Feb 2025: Introduction of innovative coverage solutions targeting risks associated with the burgeoning
Pet Insurance Marketacross North America, reflecting a shift towards more diverse consumer specialty lines. - May 2025: Strategic investments in robust
Cloud Computing Marketinfrastructure were reported by several insurers to support enhanced data storage, processing, and analytical capabilities, crucial for handling large volumes of specialty risk data. - Aug 2025: A new partnership was forged between an insurer and a automotive tech firm to develop tailored policies for autonomous vehicle fleets, signifying evolution within the
Commercial Auto Insurance Marketto address future mobility risks.
Regional Market Breakdown for Specialty Insurance Market
The global Specialty Insurance Market exhibits distinct regional variations in terms of maturity, growth drivers, and dominant segments. North America holds the largest revenue share, representing a mature but highly sophisticated market. The region's robust economic infrastructure, high corporate risk awareness, and complex legal and regulatory environment drive strong demand for specialized coverages such as Cyber Liability Insurance Market, professional liability, and directors' & officers' insurance. The United States, in particular, leads in innovation and adoption, with a well-developed brokerage system and a high concentration of specialized underwriters. Growth here is steady, driven by increasing risk complexity and the continuous evolution of technological risks. Demand in the Healthcare & Life Sciences Market is also significant, fueled by advanced R&D and strict regulatory compliance.
Europe constitutes the second-largest market, characterized by a highly integrated, yet diverse regulatory landscape. Countries like the United Kingdom, Germany, and France are key contributors, with London remaining a global hub for complex specialty risks through Lloyd's. The European market is driven by stringent environmental regulations, growing demand for Commercial Auto Insurance Market in the logistics sector, and a strong focus on compliance-driven products like D&O and professional indemnity. The region also sees significant activity in Ocean Marine Insurance Market due to extensive shipping lanes and industrial activities. Growth is stable, propelled by regulatory harmonization efforts and expanding cross-border trade.
Asia Pacific is identified as the fastest-growing region in the Specialty Insurance Market. This growth is primarily fueled by rapid economic development, industrialization, and increasing foreign direct investment in countries like China, India, and Japan. Emerging economies within ASEAN are experiencing significant infrastructure development, leading to demand for construction all-risk, energy, and engineering insurance. Rising affluence and greater awareness are also stimulating growth in consumer-oriented segments like the Pet Insurance Market. The region is poised for substantial expansion as businesses become more aware of complex risks and seek specialized solutions, often leveraging Digital Platforms Market for distribution.
Latin America and the Middle East & Africa (MEA) represent nascent but promising markets. In Latin America, growth is driven by infrastructure projects, natural resource extraction, and expanding industrial bases in Brazil and Mexico. The MEA region, particularly the GCC countries, sees demand from large-scale energy projects, maritime trade, and burgeoning urban development. While smaller in absolute terms, these regions present significant growth potential as their economies mature and risk management practices become more sophisticated, often influenced by international players entering these markets.
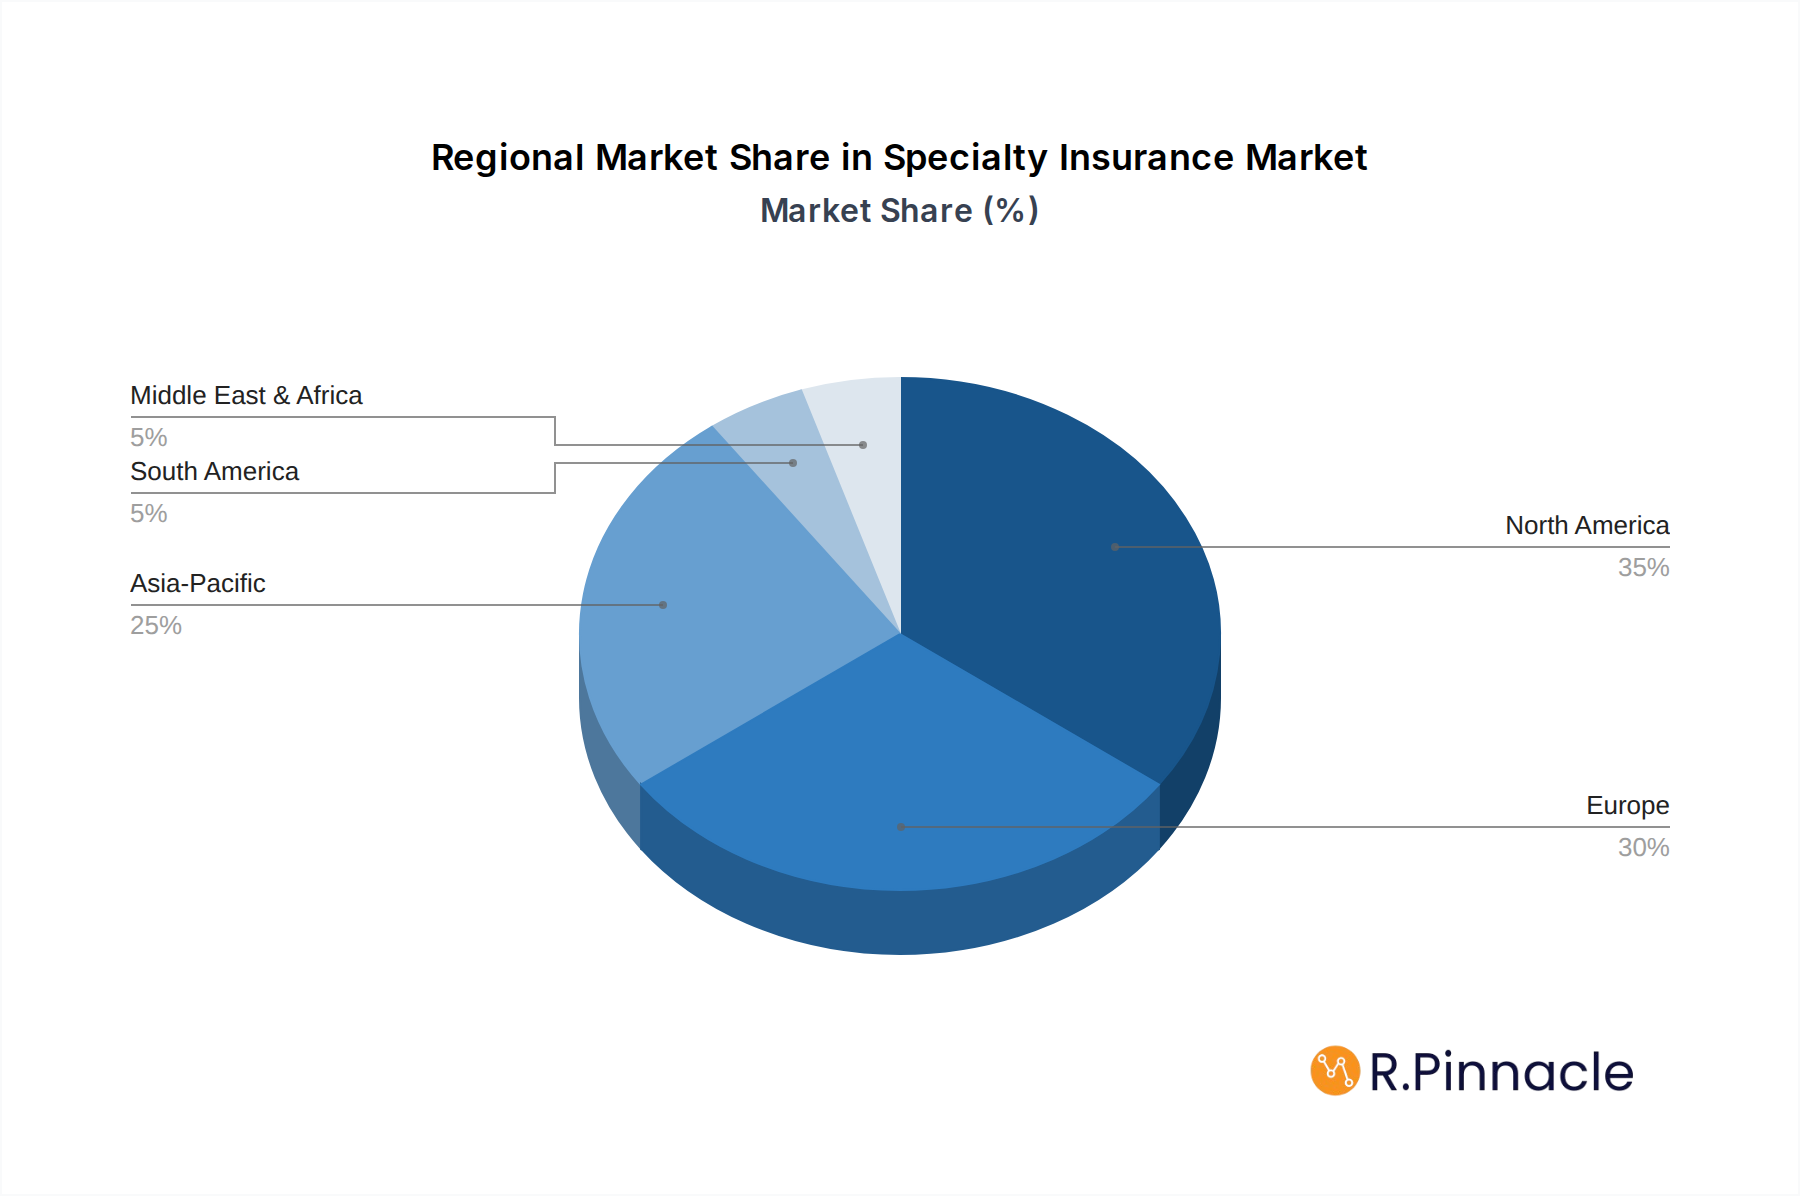
Specialty Insurance Regional Market Share
Regulatory & Policy Landscape Shaping Specialty Insurance Market
The Specialty Insurance Market operates within a highly intricate and evolving global regulatory and policy landscape, which profoundly impacts underwriting, capital requirements, and market conduct. Key regulatory frameworks include Solvency II in the European Union, which mandates stringent capital requirements and risk management frameworks for insurers, and the National Association of Insurance Commissioners (NAIC) system in the United States, providing state-level regulation with some degree of national coordination. These frameworks aim to ensure insurer solvency and protect policyholders, directly influencing pricing, product design, and market entry for specialty carriers.
Recent policy changes have particularly focused on data privacy and cybersecurity. Regulations like the General Data Protection Regulation (GDPR) in Europe and the California Consumer Privacy Act (CCPA) in the US have significant implications for the Cyber Liability Insurance Market, dictating how personal data is handled and increasing corporate accountability for data breaches. This, in turn, drives demand for policies covering regulatory fines and data breach response costs. Climate change policy and sustainability initiatives are also gaining traction, prompting regulators to consider integrating climate risk disclosures into solvency requirements. This influences the underwriting of environmental liability and natural catastrophe risks, pushing insurers to develop more sophisticated models for assessing long-term climate impacts. Furthermore, anti-money laundering (AML) and counter-terrorist financing (CTF) regulations necessitate rigorous due diligence in client onboarding, particularly for global specialty lines involving cross-border transactions. These regulatory pressures compel insurers to invest heavily in compliance, often leveraging advanced Data Analytics Market tools to monitor adherence and assess regulatory exposure. The projected market impact includes increased operational costs for compliance, a drive towards greater transparency, and an acceleration of product innovation to meet evolving regulatory demands for specialized coverage.
Export, Trade Flow & Tariff Impact on Specialty Insurance Market
The Specialty Insurance Market is intrinsically linked to global trade flows, export dynamics, and the impact of tariffs and non-tariff barriers, particularly for lines like Ocean Marine Insurance Market, trade credit, political risk, and supply chain interruption. Major trade corridors, such as those connecting Asia with Europe and North America, or intra-European and intra-Asian routes, generate substantial demand for cargo, hull, and P&I (Protection & Indemnity) insurance. The United Kingdom, particularly the Lloyd's market, remains a leading exporter of specialized insurance services globally, given its deep expertise in complex and niche risks. Other significant exporting nations include the United States, Switzerland, and Germany, which deploy their global networks to underwrite international specialty risks.
Recent trade policy shifts have had quantifiable impacts on cross-border volume and associated insurance demand. The uncertainty surrounding trade agreements, such as the implications of Brexit on London's access to the EU single market, has necessitated restructuring of insurance operations and increased compliance burdens, influencing the flow of specialty insurance capital and services. US-China trade tensions, characterized by tariffs and retaliatory measures, have directly affected global supply chains, leading to a heightened demand for trade credit insurance and political risk coverage as businesses seek to mitigate increased commercial and sovereign risks. Non-tariff barriers, such as data localization requirements, capital restrictions, and differing regulatory standards, also significantly impede the seamless export and import of insurance services. For instance, some countries mandate that data relevant to local insurance policies must be stored within their borders, impacting the global data management strategies of insurers and potentially fragmenting the Cloud Computing Market infrastructure used for underwriting. These barriers often necessitate local licensing and operational setups, adding to the cost and complexity of offering specialty insurance across borders, thereby influencing market competition and the pricing of international risks. As geopolitical and economic landscapes continue to evolve, the Specialty Insurance Market must remain agile in adapting its offerings to reflect changes in global trade and associated risk exposures.
Specialty Insurance Segmentation
-
1. Type
- 1.1. Ocean Marine Insurance
- 1.2. Commercial Auto Insurance
- 1.3. Flood Insurance
- 1.4. Pet Insurance
- 1.5. Wedding Insurance
- 1.6. Jewelry Insurance
- 1.7. Cyber Liability Insurance
- 1.8. Commercial Umbrella Insurance
- 1.9. Others
-
2. Enterprise Size
- 2.1. Large Enterprises
- 2.2. Small & Medium Enterprises (SMEs)
-
3. Distribution Channel
- 3.1. Direct Sales
- 3.2. Brokers & Agents
- 3.3. Bancassurance
- 3.4. Digital Platforms
-
4. End User Industry
- 4.1. BFSI
- 4.2. Healthcare & Life Sciences
- 4.3. Manufacturing
- 4.4. Energy & Utilities
- 4.5. Construction & Infrastructure
- 4.6. Transportation & Logistics
- 4.7. Aerospace & Defense
- 4.8. Marine & Shipping
- 4.9. Others
Specialty Insurance Segmentation By Geography
-
1. North America
- 1.1. United States
- 1.2. Canada
- 1.3. Mexico
-
2. South America
- 2.1. Brazil
- 2.2. Argentina
- 2.3. Rest of South America
-
3. Europe
- 3.1. United Kingdom
- 3.2. Germany
- 3.3. France
- 3.4. Italy
- 3.5. Spain
- 3.6. Russia
- 3.7. Benelux
- 3.8. Nordics
- 3.9. Rest of Europe
-
4. Middle East & Africa
- 4.1. Turkey
- 4.2. Israel
- 4.3. GCC
- 4.4. North Africa
- 4.5. South Africa
- 4.6. Rest of Middle East & Africa
-
5. Asia Pacific
- 5.1. China
- 5.2. India
- 5.3. Japan
- 5.4. South Korea
- 5.5. ASEAN
- 5.6. Oceania
- 5.7. Rest of Asia Pacific
Specialty Insurance Regional Market Share
Geographic Coverage of Specialty Insurance
Specialty Insurance REPORT HIGHLIGHTS
| Aspects | Details |
|---|---|
| Study Period | 2020-2034 |
| Base Year | 2025 |
| Estimated Year | 2026 |
| Forecast Period | 2026-2034 |
| Historical Period | 2020-2025 |
| Growth Rate | CAGR of 7% from 2020-2034 |
| Segmentation |
|
Table of Contents
- 1. Introduction
- 1.1. Research Scope
- 1.2. Market Segmentation
- 1.3. Research Objective
- 1.4. Definitions and Assumptions
- 2. Executive Summary
- 2.1. Market Snapshot
- 3. Market Dynamics
- 3.1. Market Drivers
- 3.2. Market Restrains
- 3.3. Market Trends
- 3.4. Market Opportunities
- 4. Market Factor Analysis
- 4.1. Porters Five Forces
- 4.1.1. Bargaining Power of Suppliers
- 4.1.2. Bargaining Power of Buyers
- 4.1.3. Threat of New Entrants
- 4.1.4. Threat of Substitutes
- 4.1.5. Competitive Rivalry
- 4.2. PESTEL analysis
- 4.3. BCG Analysis
- 4.3.1. Stars (High Growth, High Market Share)
- 4.3.2. Cash Cows (Low Growth, High Market Share)
- 4.3.3. Question Mark (High Growth, Low Market Share)
- 4.3.4. Dogs (Low Growth, Low Market Share)
- 4.4. Ansoff Matrix Analysis
- 4.5. Supply Chain Analysis
- 4.6. Regulatory Landscape
- 4.7. Current Market Potential and Opportunity Assessment (TAM–SAM–SOM Framework)
- 4.8. PRI Analyst Note
- 4.1. Porters Five Forces
- 5. Market Analysis, Insights and Forecast 2021-2033
- 5.1. Market Analysis, Insights and Forecast - by Type
- 5.1.1. Ocean Marine Insurance
- 5.1.2. Commercial Auto Insurance
- 5.1.3. Flood Insurance
- 5.1.4. Pet Insurance
- 5.1.5. Wedding Insurance
- 5.1.6. Jewelry Insurance
- 5.1.7. Cyber Liability Insurance
- 5.1.8. Commercial Umbrella Insurance
- 5.1.9. Others
- 5.2. Market Analysis, Insights and Forecast - by Enterprise Size
- 5.2.1. Large Enterprises
- 5.2.2. Small & Medium Enterprises (SMEs)
- 5.3. Market Analysis, Insights and Forecast - by Distribution Channel
- 5.3.1. Direct Sales
- 5.3.2. Brokers & Agents
- 5.3.3. Bancassurance
- 5.3.4. Digital Platforms
- 5.4. Market Analysis, Insights and Forecast - by End User Industry
- 5.4.1. BFSI
- 5.4.2. Healthcare & Life Sciences
- 5.4.3. Manufacturing
- 5.4.4. Energy & Utilities
- 5.4.5. Construction & Infrastructure
- 5.4.6. Transportation & Logistics
- 5.4.7. Aerospace & Defense
- 5.4.8. Marine & Shipping
- 5.4.9. Others
- 5.5. Market Analysis, Insights and Forecast - by Region
- 5.5.1. North America
- 5.5.2. South America
- 5.5.3. Europe
- 5.5.4. Middle East & Africa
- 5.5.5. Asia Pacific
- 5.1. Market Analysis, Insights and Forecast - by Type
- 6. Global Specialty Insurance Analysis, Insights and Forecast, 2021-2033
- 6.1. Market Analysis, Insights and Forecast - by Type
- 6.1.1. Ocean Marine Insurance
- 6.1.2. Commercial Auto Insurance
- 6.1.3. Flood Insurance
- 6.1.4. Pet Insurance
- 6.1.5. Wedding Insurance
- 6.1.6. Jewelry Insurance
- 6.1.7. Cyber Liability Insurance
- 6.1.8. Commercial Umbrella Insurance
- 6.1.9. Others
- 6.2. Market Analysis, Insights and Forecast - by Enterprise Size
- 6.2.1. Large Enterprises
- 6.2.2. Small & Medium Enterprises (SMEs)
- 6.3. Market Analysis, Insights and Forecast - by Distribution Channel
- 6.3.1. Direct Sales
- 6.3.2. Brokers & Agents
- 6.3.3. Bancassurance
- 6.3.4. Digital Platforms
- 6.4. Market Analysis, Insights and Forecast - by End User Industry
- 6.4.1. BFSI
- 6.4.2. Healthcare & Life Sciences
- 6.4.3. Manufacturing
- 6.4.4. Energy & Utilities
- 6.4.5. Construction & Infrastructure
- 6.4.6. Transportation & Logistics
- 6.4.7. Aerospace & Defense
- 6.4.8. Marine & Shipping
- 6.4.9. Others
- 6.1. Market Analysis, Insights and Forecast - by Type
- 7. North America Specialty Insurance Analysis, Insights and Forecast, 2020-2032
- 7.1. Market Analysis, Insights and Forecast - by Type
- 7.1.1. Ocean Marine Insurance
- 7.1.2. Commercial Auto Insurance
- 7.1.3. Flood Insurance
- 7.1.4. Pet Insurance
- 7.1.5. Wedding Insurance
- 7.1.6. Jewelry Insurance
- 7.1.7. Cyber Liability Insurance
- 7.1.8. Commercial Umbrella Insurance
- 7.1.9. Others
- 7.2. Market Analysis, Insights and Forecast - by Enterprise Size
- 7.2.1. Large Enterprises
- 7.2.2. Small & Medium Enterprises (SMEs)
- 7.3. Market Analysis, Insights and Forecast - by Distribution Channel
- 7.3.1. Direct Sales
- 7.3.2. Brokers & Agents
- 7.3.3. Bancassurance
- 7.3.4. Digital Platforms
- 7.4. Market Analysis, Insights and Forecast - by End User Industry
- 7.4.1. BFSI
- 7.4.2. Healthcare & Life Sciences
- 7.4.3. Manufacturing
- 7.4.4. Energy & Utilities
- 7.4.5. Construction & Infrastructure
- 7.4.6. Transportation & Logistics
- 7.4.7. Aerospace & Defense
- 7.4.8. Marine & Shipping
- 7.4.9. Others
- 7.1. Market Analysis, Insights and Forecast - by Type
- 8. South America Specialty Insurance Analysis, Insights and Forecast, 2020-2032
- 8.1. Market Analysis, Insights and Forecast - by Type
- 8.1.1. Ocean Marine Insurance
- 8.1.2. Commercial Auto Insurance
- 8.1.3. Flood Insurance
- 8.1.4. Pet Insurance
- 8.1.5. Wedding Insurance
- 8.1.6. Jewelry Insurance
- 8.1.7. Cyber Liability Insurance
- 8.1.8. Commercial Umbrella Insurance
- 8.1.9. Others
- 8.2. Market Analysis, Insights and Forecast - by Enterprise Size
- 8.2.1. Large Enterprises
- 8.2.2. Small & Medium Enterprises (SMEs)
- 8.3. Market Analysis, Insights and Forecast - by Distribution Channel
- 8.3.1. Direct Sales
- 8.3.2. Brokers & Agents
- 8.3.3. Bancassurance
- 8.3.4. Digital Platforms
- 8.4. Market Analysis, Insights and Forecast - by End User Industry
- 8.4.1. BFSI
- 8.4.2. Healthcare & Life Sciences
- 8.4.3. Manufacturing
- 8.4.4. Energy & Utilities
- 8.4.5. Construction & Infrastructure
- 8.4.6. Transportation & Logistics
- 8.4.7. Aerospace & Defense
- 8.4.8. Marine & Shipping
- 8.4.9. Others
- 8.1. Market Analysis, Insights and Forecast - by Type
- 9. Europe Specialty Insurance Analysis, Insights and Forecast, 2020-2032
- 9.1. Market Analysis, Insights and Forecast - by Type
- 9.1.1. Ocean Marine Insurance
- 9.1.2. Commercial Auto Insurance
- 9.1.3. Flood Insurance
- 9.1.4. Pet Insurance
- 9.1.5. Wedding Insurance
- 9.1.6. Jewelry Insurance
- 9.1.7. Cyber Liability Insurance
- 9.1.8. Commercial Umbrella Insurance
- 9.1.9. Others
- 9.2. Market Analysis, Insights and Forecast - by Enterprise Size
- 9.2.1. Large Enterprises
- 9.2.2. Small & Medium Enterprises (SMEs)
- 9.3. Market Analysis, Insights and Forecast - by Distribution Channel
- 9.3.1. Direct Sales
- 9.3.2. Brokers & Agents
- 9.3.3. Bancassurance
- 9.3.4. Digital Platforms
- 9.4. Market Analysis, Insights and Forecast - by End User Industry
- 9.4.1. BFSI
- 9.4.2. Healthcare & Life Sciences
- 9.4.3. Manufacturing
- 9.4.4. Energy & Utilities
- 9.4.5. Construction & Infrastructure
- 9.4.6. Transportation & Logistics
- 9.4.7. Aerospace & Defense
- 9.4.8. Marine & Shipping
- 9.4.9. Others
- 9.1. Market Analysis, Insights and Forecast - by Type
- 10. Middle East & Africa Specialty Insurance Analysis, Insights and Forecast, 2020-2032
- 10.1. Market Analysis, Insights and Forecast - by Type
- 10.1.1. Ocean Marine Insurance
- 10.1.2. Commercial Auto Insurance
- 10.1.3. Flood Insurance
- 10.1.4. Pet Insurance
- 10.1.5. Wedding Insurance
- 10.1.6. Jewelry Insurance
- 10.1.7. Cyber Liability Insurance
- 10.1.8. Commercial Umbrella Insurance
- 10.1.9. Others
- 10.2. Market Analysis, Insights and Forecast - by Enterprise Size
- 10.2.1. Large Enterprises
- 10.2.2. Small & Medium Enterprises (SMEs)
- 10.3. Market Analysis, Insights and Forecast - by Distribution Channel
- 10.3.1. Direct Sales
- 10.3.2. Brokers & Agents
- 10.3.3. Bancassurance
- 10.3.4. Digital Platforms
- 10.4. Market Analysis, Insights and Forecast - by End User Industry
- 10.4.1. BFSI
- 10.4.2. Healthcare & Life Sciences
- 10.4.3. Manufacturing
- 10.4.4. Energy & Utilities
- 10.4.5. Construction & Infrastructure
- 10.4.6. Transportation & Logistics
- 10.4.7. Aerospace & Defense
- 10.4.8. Marine & Shipping
- 10.4.9. Others
- 10.1. Market Analysis, Insights and Forecast - by Type
- 11. Asia Pacific Specialty Insurance Analysis, Insights and Forecast, 2020-2032
- 11.1. Market Analysis, Insights and Forecast - by Type
- 11.1.1. Ocean Marine Insurance
- 11.1.2. Commercial Auto Insurance
- 11.1.3. Flood Insurance
- 11.1.4. Pet Insurance
- 11.1.5. Wedding Insurance
- 11.1.6. Jewelry Insurance
- 11.1.7. Cyber Liability Insurance
- 11.1.8. Commercial Umbrella Insurance
- 11.1.9. Others
- 11.2. Market Analysis, Insights and Forecast - by Enterprise Size
- 11.2.1. Large Enterprises
- 11.2.2. Small & Medium Enterprises (SMEs)
- 11.3. Market Analysis, Insights and Forecast - by Distribution Channel
- 11.3.1. Direct Sales
- 11.3.2. Brokers & Agents
- 11.3.3. Bancassurance
- 11.3.4. Digital Platforms
- 11.4. Market Analysis, Insights and Forecast - by End User Industry
- 11.4.1. BFSI
- 11.4.2. Healthcare & Life Sciences
- 11.4.3. Manufacturing
- 11.4.4. Energy & Utilities
- 11.4.5. Construction & Infrastructure
- 11.4.6. Transportation & Logistics
- 11.4.7. Aerospace & Defense
- 11.4.8. Marine & Shipping
- 11.4.9. Others
- 11.1. Market Analysis, Insights and Forecast - by Type
- 12. Competitive Analysis
- 12.1. Company Profiles
- 12.1.1 AIG
- 12.1.1.1. Company Overview
- 12.1.1.2. Products
- 12.1.1.3. Company Financials
- 12.1.1.4. SWOT Analysis
- 12.1.2 Chubb
- 12.1.2.1. Company Overview
- 12.1.2.2. Products
- 12.1.2.3. Company Financials
- 12.1.2.4. SWOT Analysis
- 12.1.3 Zurich Insurance Group
- 12.1.3.1. Company Overview
- 12.1.3.2. Products
- 12.1.3.3. Company Financials
- 12.1.3.4. SWOT Analysis
- 12.1.4 Allianz
- 12.1.4.1. Company Overview
- 12.1.4.2. Products
- 12.1.4.3. Company Financials
- 12.1.4.4. SWOT Analysis
- 12.1.5 AXA XL
- 12.1.5.1. Company Overview
- 12.1.5.2. Products
- 12.1.5.3. Company Financials
- 12.1.5.4. SWOT Analysis
- 12.1.6 Munich Re
- 12.1.6.1. Company Overview
- 12.1.6.2. Products
- 12.1.6.3. Company Financials
- 12.1.6.4. SWOT Analysis
- 12.1.7 Swiss Re
- 12.1.7.1. Company Overview
- 12.1.7.2. Products
- 12.1.7.3. Company Financials
- 12.1.7.4. SWOT Analysis
- 12.1.8 The Hartford
- 12.1.8.1. Company Overview
- 12.1.8.2. Products
- 12.1.8.3. Company Financials
- 12.1.8.4. SWOT Analysis
- 12.1.9 Travelers
- 12.1.9.1. Company Overview
- 12.1.9.2. Products
- 12.1.9.3. Company Financials
- 12.1.9.4. SWOT Analysis
- 12.1.10 Liberty Mutual
- 12.1.10.1. Company Overview
- 12.1.10.2. Products
- 12.1.10.3. Company Financials
- 12.1.10.4. SWOT Analysis
- 12.1.11 Tokio Marine Holdings
- 12.1.11.1. Company Overview
- 12.1.11.2. Products
- 12.1.11.3. Company Financials
- 12.1.11.4. SWOT Analysis
- 12.1.12 Lloyd's of London
- 12.1.12.1. Company Overview
- 12.1.12.2. Products
- 12.1.12.3. Company Financials
- 12.1.12.4. SWOT Analysis
- 12.1.13 Sompo Holdings
- 12.1.13.1. Company Overview
- 12.1.13.2. Products
- 12.1.13.3. Company Financials
- 12.1.13.4. SWOT Analysis
- 12.1.14 Others
- 12.1.14.1. Company Overview
- 12.1.14.2. Products
- 12.1.14.3. Company Financials
- 12.1.14.4. SWOT Analysis
- 12.1.1 AIG
- 12.2. Market Entropy
- 12.2.1 Company's Key Areas Served
- 12.2.2 Recent Developments
- 12.3. Company Market Share Analysis 2025
- 12.3.1 Top 5 Companies Market Share Analysis
- 12.3.2 Top 3 Companies Market Share Analysis
- 12.4. List of Potential Customers
- 13. Research Methodology
List of Figures
- Figure 1: Global Specialty Insurance Revenue Breakdown (billion, %) by Region 2025 & 2033
- Figure 2: North America Specialty Insurance Revenue (billion), by Type 2025 & 2033
- Figure 3: North America Specialty Insurance Revenue Share (%), by Type 2025 & 2033
- Figure 4: North America Specialty Insurance Revenue (billion), by Enterprise Size 2025 & 2033
- Figure 5: North America Specialty Insurance Revenue Share (%), by Enterprise Size 2025 & 2033
- Figure 6: North America Specialty Insurance Revenue (billion), by Distribution Channel 2025 & 2033
- Figure 7: North America Specialty Insurance Revenue Share (%), by Distribution Channel 2025 & 2033
- Figure 8: North America Specialty Insurance Revenue (billion), by End User Industry 2025 & 2033
- Figure 9: North America Specialty Insurance Revenue Share (%), by End User Industry 2025 & 2033
- Figure 10: North America Specialty Insurance Revenue (billion), by Country 2025 & 2033
- Figure 11: North America Specialty Insurance Revenue Share (%), by Country 2025 & 2033
- Figure 12: South America Specialty Insurance Revenue (billion), by Type 2025 & 2033
- Figure 13: South America Specialty Insurance Revenue Share (%), by Type 2025 & 2033
- Figure 14: South America Specialty Insurance Revenue (billion), by Enterprise Size 2025 & 2033
- Figure 15: South America Specialty Insurance Revenue Share (%), by Enterprise Size 2025 & 2033
- Figure 16: South America Specialty Insurance Revenue (billion), by Distribution Channel 2025 & 2033
- Figure 17: South America Specialty Insurance Revenue Share (%), by Distribution Channel 2025 & 2033
- Figure 18: South America Specialty Insurance Revenue (billion), by End User Industry 2025 & 2033
- Figure 19: South America Specialty Insurance Revenue Share (%), by End User Industry 2025 & 2033
- Figure 20: South America Specialty Insurance Revenue (billion), by Country 2025 & 2033
- Figure 21: South America Specialty Insurance Revenue Share (%), by Country 2025 & 2033
- Figure 22: Europe Specialty Insurance Revenue (billion), by Type 2025 & 2033
- Figure 23: Europe Specialty Insurance Revenue Share (%), by Type 2025 & 2033
- Figure 24: Europe Specialty Insurance Revenue (billion), by Enterprise Size 2025 & 2033
- Figure 25: Europe Specialty Insurance Revenue Share (%), by Enterprise Size 2025 & 2033
- Figure 26: Europe Specialty Insurance Revenue (billion), by Distribution Channel 2025 & 2033
- Figure 27: Europe Specialty Insurance Revenue Share (%), by Distribution Channel 2025 & 2033
- Figure 28: Europe Specialty Insurance Revenue (billion), by End User Industry 2025 & 2033
- Figure 29: Europe Specialty Insurance Revenue Share (%), by End User Industry 2025 & 2033
- Figure 30: Europe Specialty Insurance Revenue (billion), by Country 2025 & 2033
- Figure 31: Europe Specialty Insurance Revenue Share (%), by Country 2025 & 2033
- Figure 32: Middle East & Africa Specialty Insurance Revenue (billion), by Type 2025 & 2033
- Figure 33: Middle East & Africa Specialty Insurance Revenue Share (%), by Type 2025 & 2033
- Figure 34: Middle East & Africa Specialty Insurance Revenue (billion), by Enterprise Size 2025 & 2033
- Figure 35: Middle East & Africa Specialty Insurance Revenue Share (%), by Enterprise Size 2025 & 2033
- Figure 36: Middle East & Africa Specialty Insurance Revenue (billion), by Distribution Channel 2025 & 2033
- Figure 37: Middle East & Africa Specialty Insurance Revenue Share (%), by Distribution Channel 2025 & 2033
- Figure 38: Middle East & Africa Specialty Insurance Revenue (billion), by End User Industry 2025 & 2033
- Figure 39: Middle East & Africa Specialty Insurance Revenue Share (%), by End User Industry 2025 & 2033
- Figure 40: Middle East & Africa Specialty Insurance Revenue (billion), by Country 2025 & 2033
- Figure 41: Middle East & Africa Specialty Insurance Revenue Share (%), by Country 2025 & 2033
- Figure 42: Asia Pacific Specialty Insurance Revenue (billion), by Type 2025 & 2033
- Figure 43: Asia Pacific Specialty Insurance Revenue Share (%), by Type 2025 & 2033
- Figure 44: Asia Pacific Specialty Insurance Revenue (billion), by Enterprise Size 2025 & 2033
- Figure 45: Asia Pacific Specialty Insurance Revenue Share (%), by Enterprise Size 2025 & 2033
- Figure 46: Asia Pacific Specialty Insurance Revenue (billion), by Distribution Channel 2025 & 2033
- Figure 47: Asia Pacific Specialty Insurance Revenue Share (%), by Distribution Channel 2025 & 2033
- Figure 48: Asia Pacific Specialty Insurance Revenue (billion), by End User Industry 2025 & 2033
- Figure 49: Asia Pacific Specialty Insurance Revenue Share (%), by End User Industry 2025 & 2033
- Figure 50: Asia Pacific Specialty Insurance Revenue (billion), by Country 2025 & 2033
- Figure 51: Asia Pacific Specialty Insurance Revenue Share (%), by Country 2025 & 2033
List of Tables
- Table 1: Global Specialty Insurance Revenue billion Forecast, by Type 2020 & 2033
- Table 2: Global Specialty Insurance Revenue billion Forecast, by Enterprise Size 2020 & 2033
- Table 3: Global Specialty Insurance Revenue billion Forecast, by Distribution Channel 2020 & 2033
- Table 4: Global Specialty Insurance Revenue billion Forecast, by End User Industry 2020 & 2033
- Table 5: Global Specialty Insurance Revenue billion Forecast, by Region 2020 & 2033
- Table 6: Global Specialty Insurance Revenue billion Forecast, by Type 2020 & 2033
- Table 7: Global Specialty Insurance Revenue billion Forecast, by Enterprise Size 2020 & 2033
- Table 8: Global Specialty Insurance Revenue billion Forecast, by Distribution Channel 2020 & 2033
- Table 9: Global Specialty Insurance Revenue billion Forecast, by End User Industry 2020 & 2033
- Table 10: Global Specialty Insurance Revenue billion Forecast, by Country 2020 & 2033
- Table 11: United States Specialty Insurance Revenue (billion) Forecast, by Application 2020 & 2033
- Table 12: Canada Specialty Insurance Revenue (billion) Forecast, by Application 2020 & 2033
- Table 13: Mexico Specialty Insurance Revenue (billion) Forecast, by Application 2020 & 2033
- Table 14: Global Specialty Insurance Revenue billion Forecast, by Type 2020 & 2033
- Table 15: Global Specialty Insurance Revenue billion Forecast, by Enterprise Size 2020 & 2033
- Table 16: Global Specialty Insurance Revenue billion Forecast, by Distribution Channel 2020 & 2033
- Table 17: Global Specialty Insurance Revenue billion Forecast, by End User Industry 2020 & 2033
- Table 18: Global Specialty Insurance Revenue billion Forecast, by Country 2020 & 2033
- Table 19: Brazil Specialty Insurance Revenue (billion) Forecast, by Application 2020 & 2033
- Table 20: Argentina Specialty Insurance Revenue (billion) Forecast, by Application 2020 & 2033
- Table 21: Rest of South America Specialty Insurance Revenue (billion) Forecast, by Application 2020 & 2033
- Table 22: Global Specialty Insurance Revenue billion Forecast, by Type 2020 & 2033
- Table 23: Global Specialty Insurance Revenue billion Forecast, by Enterprise Size 2020 & 2033
- Table 24: Global Specialty Insurance Revenue billion Forecast, by Distribution Channel 2020 & 2033
- Table 25: Global Specialty Insurance Revenue billion Forecast, by End User Industry 2020 & 2033
- Table 26: Global Specialty Insurance Revenue billion Forecast, by Country 2020 & 2033
- Table 27: United Kingdom Specialty Insurance Revenue (billion) Forecast, by Application 2020 & 2033
- Table 28: Germany Specialty Insurance Revenue (billion) Forecast, by Application 2020 & 2033
- Table 29: France Specialty Insurance Revenue (billion) Forecast, by Application 2020 & 2033
- Table 30: Italy Specialty Insurance Revenue (billion) Forecast, by Application 2020 & 2033
- Table 31: Spain Specialty Insurance Revenue (billion) Forecast, by Application 2020 & 2033
- Table 32: Russia Specialty Insurance Revenue (billion) Forecast, by Application 2020 & 2033
- Table 33: Benelux Specialty Insurance Revenue (billion) Forecast, by Application 2020 & 2033
- Table 34: Nordics Specialty Insurance Revenue (billion) Forecast, by Application 2020 & 2033
- Table 35: Rest of Europe Specialty Insurance Revenue (billion) Forecast, by Application 2020 & 2033
- Table 36: Global Specialty Insurance Revenue billion Forecast, by Type 2020 & 2033
- Table 37: Global Specialty Insurance Revenue billion Forecast, by Enterprise Size 2020 & 2033
- Table 38: Global Specialty Insurance Revenue billion Forecast, by Distribution Channel 2020 & 2033
- Table 39: Global Specialty Insurance Revenue billion Forecast, by End User Industry 2020 & 2033
- Table 40: Global Specialty Insurance Revenue billion Forecast, by Country 2020 & 2033
- Table 41: Turkey Specialty Insurance Revenue (billion) Forecast, by Application 2020 & 2033
- Table 42: Israel Specialty Insurance Revenue (billion) Forecast, by Application 2020 & 2033
- Table 43: GCC Specialty Insurance Revenue (billion) Forecast, by Application 2020 & 2033
- Table 44: North Africa Specialty Insurance Revenue (billion) Forecast, by Application 2020 & 2033
- Table 45: South Africa Specialty Insurance Revenue (billion) Forecast, by Application 2020 & 2033
- Table 46: Rest of Middle East & Africa Specialty Insurance Revenue (billion) Forecast, by Application 2020 & 2033
- Table 47: Global Specialty Insurance Revenue billion Forecast, by Type 2020 & 2033
- Table 48: Global Specialty Insurance Revenue billion Forecast, by Enterprise Size 2020 & 2033
- Table 49: Global Specialty Insurance Revenue billion Forecast, by Distribution Channel 2020 & 2033
- Table 50: Global Specialty Insurance Revenue billion Forecast, by End User Industry 2020 & 2033
- Table 51: Global Specialty Insurance Revenue billion Forecast, by Country 2020 & 2033
- Table 52: China Specialty Insurance Revenue (billion) Forecast, by Application 2020 & 2033
- Table 53: India Specialty Insurance Revenue (billion) Forecast, by Application 2020 & 2033
- Table 54: Japan Specialty Insurance Revenue (billion) Forecast, by Application 2020 & 2033
- Table 55: South Korea Specialty Insurance Revenue (billion) Forecast, by Application 2020 & 2033
- Table 56: ASEAN Specialty Insurance Revenue (billion) Forecast, by Application 2020 & 2033
- Table 57: Oceania Specialty Insurance Revenue (billion) Forecast, by Application 2020 & 2033
- Table 58: Rest of Asia Pacific Specialty Insurance Revenue (billion) Forecast, by Application 2020 & 2033
Frequently Asked Questions
1. What is the projected Compound Annual Growth Rate (CAGR) of the Specialty Insurance?
The projected CAGR is approximately 7%.
2. Which companies are prominent players in the Specialty Insurance?
Key companies in the market include AIG, Chubb, Zurich Insurance Group, Allianz, AXA XL, Munich Re, Swiss Re, The Hartford, Travelers, Liberty Mutual, Tokio Marine Holdings, Lloyd's of London, Sompo Holdings, Others.
3. What are the main segments of the Specialty Insurance?
The market segments include Type, Enterprise Size, Distribution Channel, End User Industry.
4. Can you provide details about the market size?
The market size is estimated to be USD 100.4 billion as of 2022.
5. What are some drivers contributing to market growth?
N/A
6. What are the notable trends driving market growth?
N/A
7. Are there any restraints impacting market growth?
N/A
8. Can you provide examples of recent developments in the market?
N/A
9. What pricing options are available for accessing the report?
Pricing options include single-user, multi-user, and enterprise licenses priced at USD 4900.00, USD 7350.00, and USD 9800.00 respectively.
10. Is the market size provided in terms of value or volume?
The market size is provided in terms of value, measured in billion.
11. Are there any specific market keywords associated with the report?
Yes, the market keyword associated with the report is "Specialty Insurance," which aids in identifying and referencing the specific market segment covered.
12. How do I determine which pricing option suits my needs best?
The pricing options vary based on user requirements and access needs. Individual users may opt for single-user licenses, while businesses requiring broader access may choose multi-user or enterprise licenses for cost-effective access to the report.
13. Are there any additional resources or data provided in the Specialty Insurance report?
While the report offers comprehensive insights, it's advisable to review the specific contents or supplementary materials provided to ascertain if additional resources or data are available.
14. How can I stay updated on further developments or reports in the Specialty Insurance?
To stay informed about further developments, trends, and reports in the Specialty Insurance, consider subscribing to industry newsletters, following relevant companies and organizations, or regularly checking reputable industry news sources and publications.
Methodology
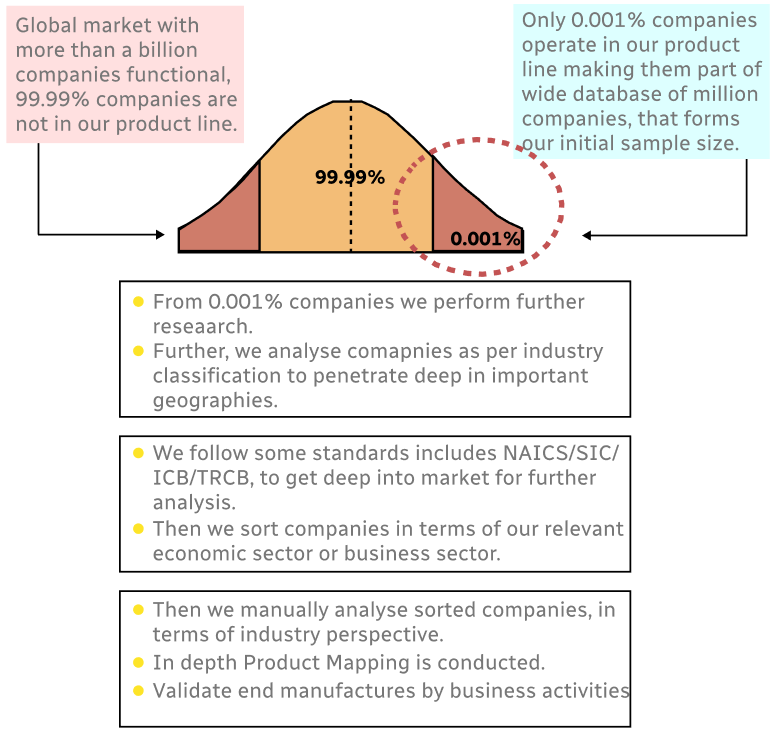
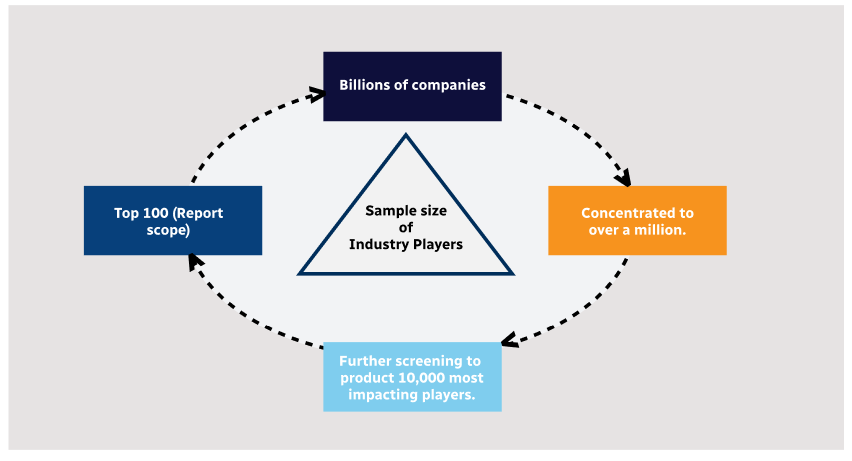
Step 1 - Identification of Relevant Samples Size from Population Database
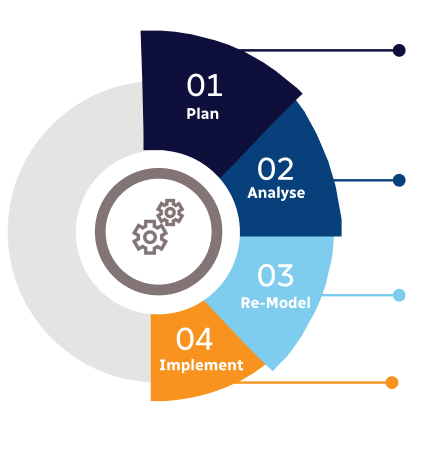
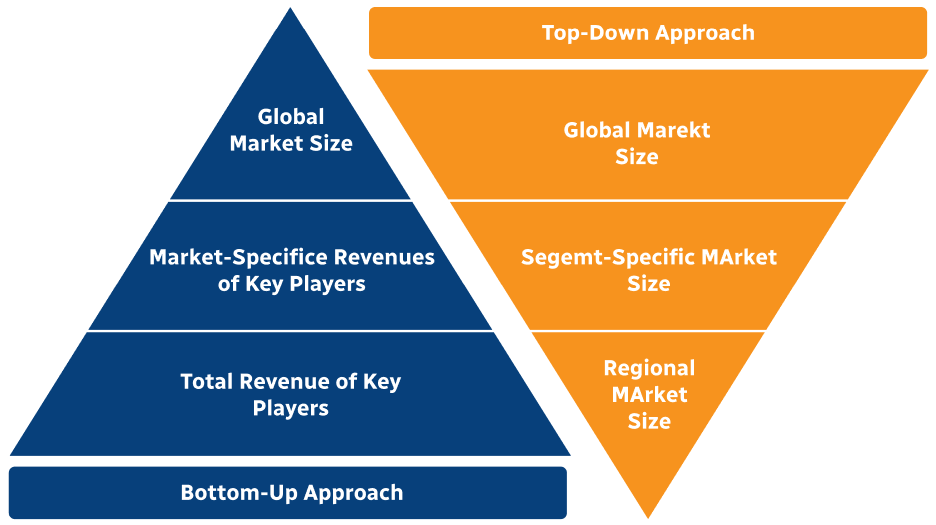
Step 2 - Approaches for Defining Global Market Size (Value, Volume* & Price*)
Note*: In applicable scenarios
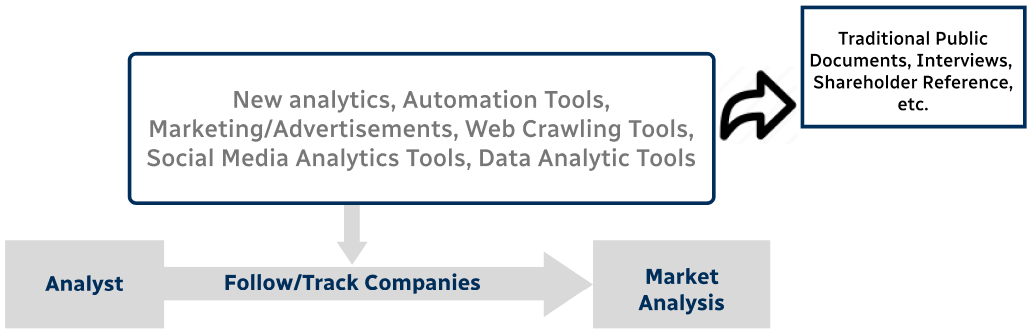
Step 3 - Data Sources
Primary Research
- Web Analytics
- Survey Reports
- Research Institute
- Latest Research Reports
- Opinion Leaders
Secondary Research
- Annual Reports
- White Paper
- Latest Press Release
- Industry Association
- Paid Database
- Investor Presentations
Step 4 - Data Triangulation
Involves using different sources of information in order to increase the validity of a study
These sources are likely to be stakeholders in a program - participants, other researchers, program staff, other community members, and so on.
Then we put all data in single framework & apply various statistical tools to find out the dynamic on the market.
During the analysis stage, feedback from the stakeholder groups would be compared to determine areas of agreement as well as areas of divergence