

Key Insights
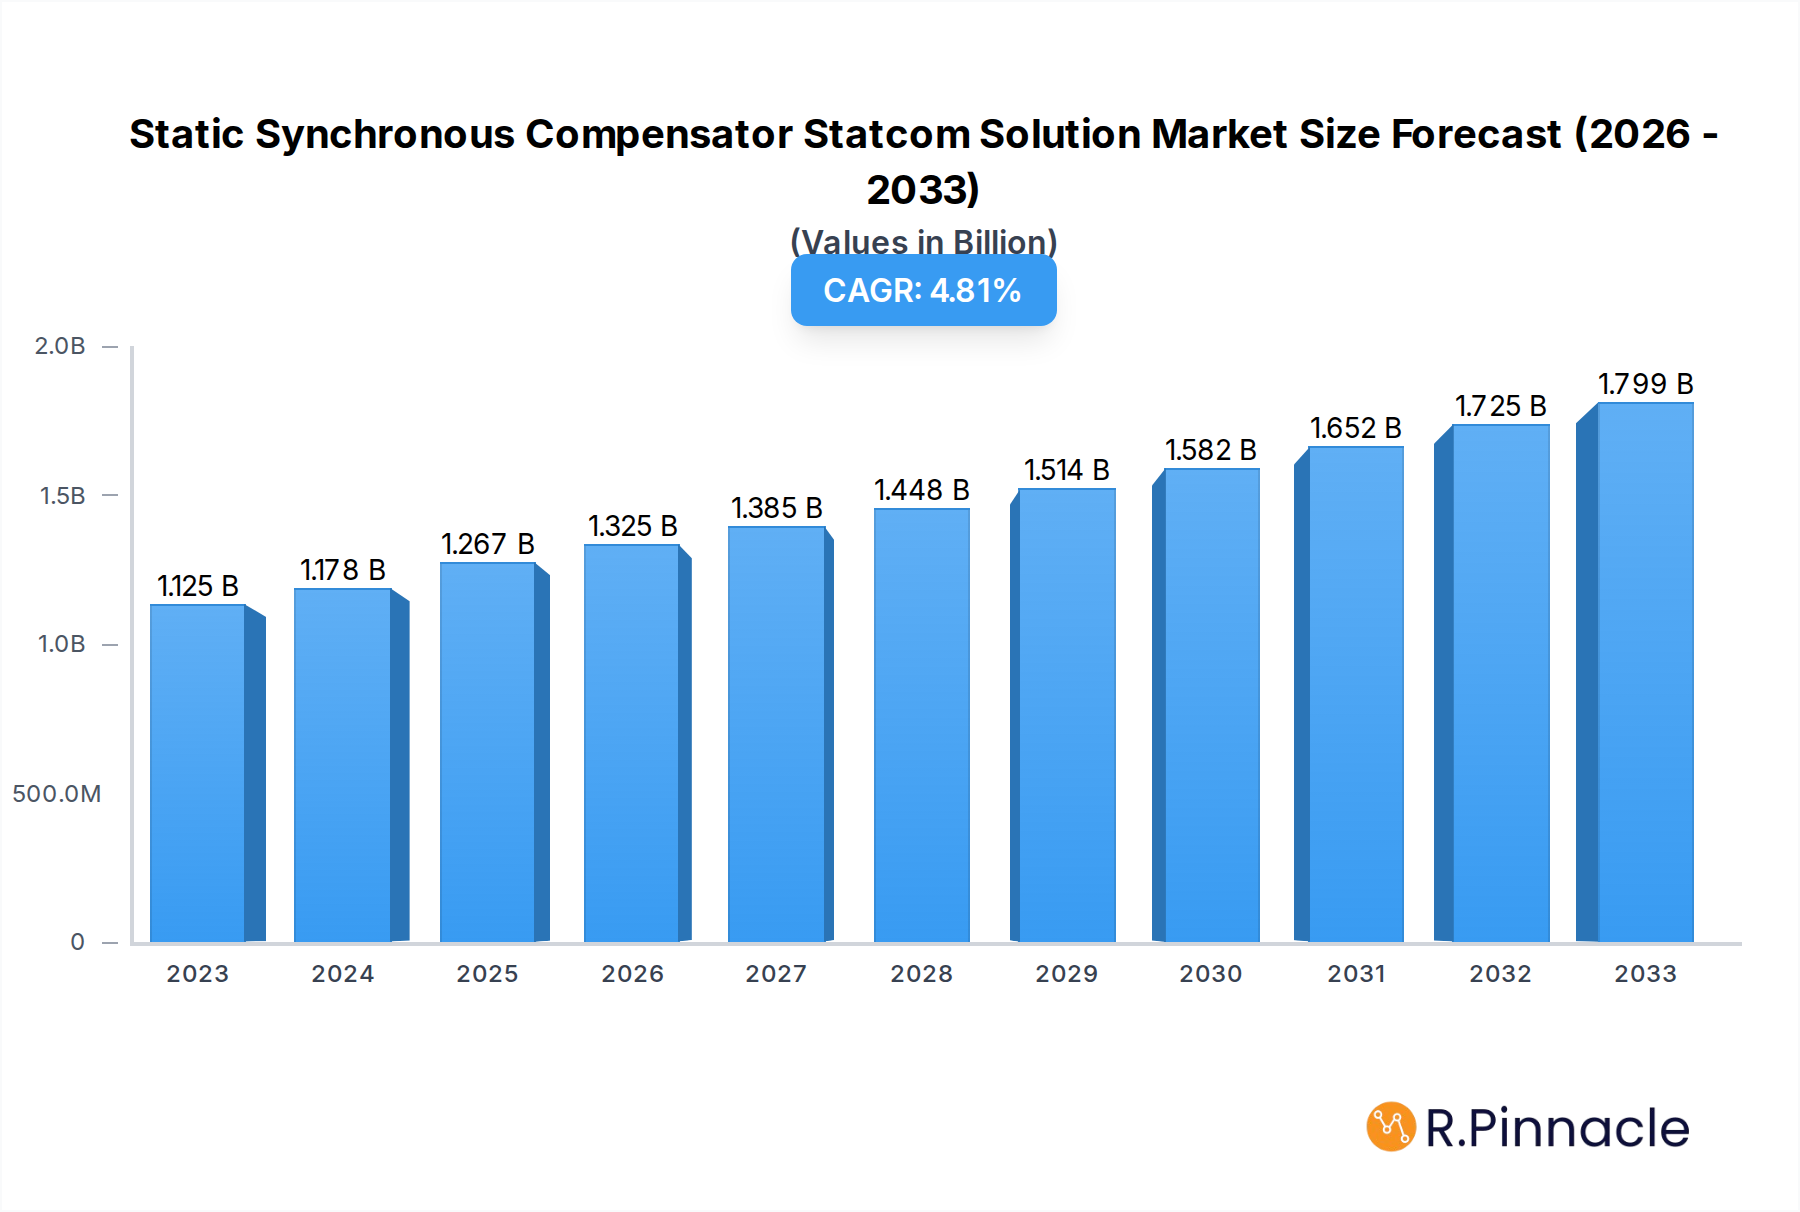
The global Static Synchronous Compensator (STATCOM) market is poised for substantial expansion, projected to reach $1267 million by 2025. This growth is underpinned by a healthy compound annual growth rate (CAGR) of 4.6% during the forecast period of 2025-2033. The increasing demand for stable and reliable power grids, driven by the integration of renewable energy sources like solar and wind, is a primary catalyst. These intermittent sources necessitate advanced grid support solutions, with STATCOMs playing a crucial role in voltage regulation, power factor correction, and transient stability enhancement. Furthermore, the ongoing upgrades and expansions of existing power infrastructure across both developed and developing economies are creating significant opportunities for STATCOM deployment. The rising adoption of smart grid technologies and the growing focus on reducing transmission losses further bolster the market's upward trajectory.

Static Synchronous Compensator Statcom Solution Market Size (In Billion)
Key drivers influencing the STATCOM market include the increasing complexity of power grids due to renewable energy penetration, stringent regulations mandating improved power quality and grid stability, and the growing need for enhanced system reliability. Emerging trends such as the development of advanced STATCOM technologies with improved control algorithms and higher efficiency, along with the increasing application of STATCOMs in industrial settings for critical load stability, are shaping the market landscape. While the market demonstrates robust growth, challenges such as high initial investment costs and the availability of alternative solutions might present some restraints. However, the long-term benefits of STATCOMs in terms of grid resilience and operational efficiency are expected to outweigh these concerns, ensuring sustained market vitality. The market is segmented by application, including transmission and distribution, industrial, and renewable energy, and by type, such as voltage source converter (VSC) and current source converter (CSC), with VSC-based STATCOMs holding a dominant share due to their superior performance characteristics.
Static Synchronous Compensator Statcom Solution Company Market Share
Static Synchronous Compensator (STATCOM) Solution Market Analysis and Future Outlook: 2019-2033
This comprehensive report delves into the burgeoning global Static Synchronous Compensator (STATCOM) solution market, providing in-depth analysis and future projections. Covering a study period from 2019 to 2033, with a base year of 2025, this report equips industry professionals with actionable insights into market dynamics, technological advancements, and competitive landscapes. We explore the critical role of STATCOMs in modern power grids, addressing grid stability, power quality, and the integration of renewable energy sources.
Static Synchronous Compensator Statcom Solution Market Structure & Innovation Trends
The global STATCOM solution market exhibits a moderately concentrated structure, with key players like Hitachi, GE, Siemens, Mitsubishi Electric, NR Electric, Ingeteam, AMSC, Hopewind, Anhui Zhongdian Electric, Diram, Hilkar, Merus, SIFANG, ABB, Endoks, Strong Power, and RXHK collectively holding a significant market share. Innovation is primarily driven by the relentless pursuit of enhanced grid performance, the increasing integration of renewable energy sources demanding robust voltage support, and the need for improved power quality in industrial applications. Regulatory frameworks, particularly those mandating grid code compliance and promoting renewable energy adoption, act as significant catalysts for STATCOM deployment. While direct product substitutes are limited, advancements in Flexible AC Transmission Systems (FACTS) devices and alternative grid stabilization techniques represent indirect competitive pressures. End-user demographics are increasingly shifting towards utility providers, large industrial complexes, and renewable energy developers seeking to optimize grid performance and reliability. Merger and acquisition activities, while not as frequent, are strategic in nature, aimed at consolidating market presence, acquiring complementary technologies, and expanding geographical reach. Recent M&A deal values are estimated to be in the range of tens to hundreds of million USD, reflecting the strategic importance of these transactions.
Static Synchronous Compensator Statcom Solution Market Dynamics & Trends
The STATCOM solution market is experiencing robust growth, fueled by several interconnected dynamics and emerging trends. A primary growth driver is the escalating demand for enhanced grid stability and power quality, particularly with the increasing penetration of intermittent renewable energy sources such as solar and wind power. These sources introduce variability into the grid, necessitating sophisticated solutions like STATCOMs to maintain voltage levels and prevent power quality issues. The global CAGR for the STATCOM market is projected to be approximately 7.5%, indicating sustained expansion. Market penetration is steadily increasing, with utilities worldwide recognizing STATCOMs as essential components for modern grid infrastructure. Technological disruptions are centered around advancements in power electronics, leading to more efficient, compact, and cost-effective STATCOM systems. This includes the development of advanced control algorithms that enable faster response times and better dynamic performance. Furthermore, the growing trend towards grid modernization and smart grid initiatives worldwide is creating significant opportunities for STATCOM integration. As grids become more complex and interconnected, the need for sophisticated reactive power compensation and voltage control becomes paramount. Consumer preferences, primarily from utility operators, are leaning towards solutions offering high reliability, lower operational costs, and the ability to integrate seamlessly with existing infrastructure. The competitive dynamics are characterized by a blend of established global players and emerging regional manufacturers, each vying for market share through technological innovation, competitive pricing, and strong service networks. The ongoing digitalization of power systems also presents opportunities for STATCOMs with advanced communication and monitoring capabilities. The increasing focus on energy efficiency and grid resilience further amplifies the demand for STATCOM solutions.
Dominant Regions & Segments in Static Synchronous Compensator Statcom Solution
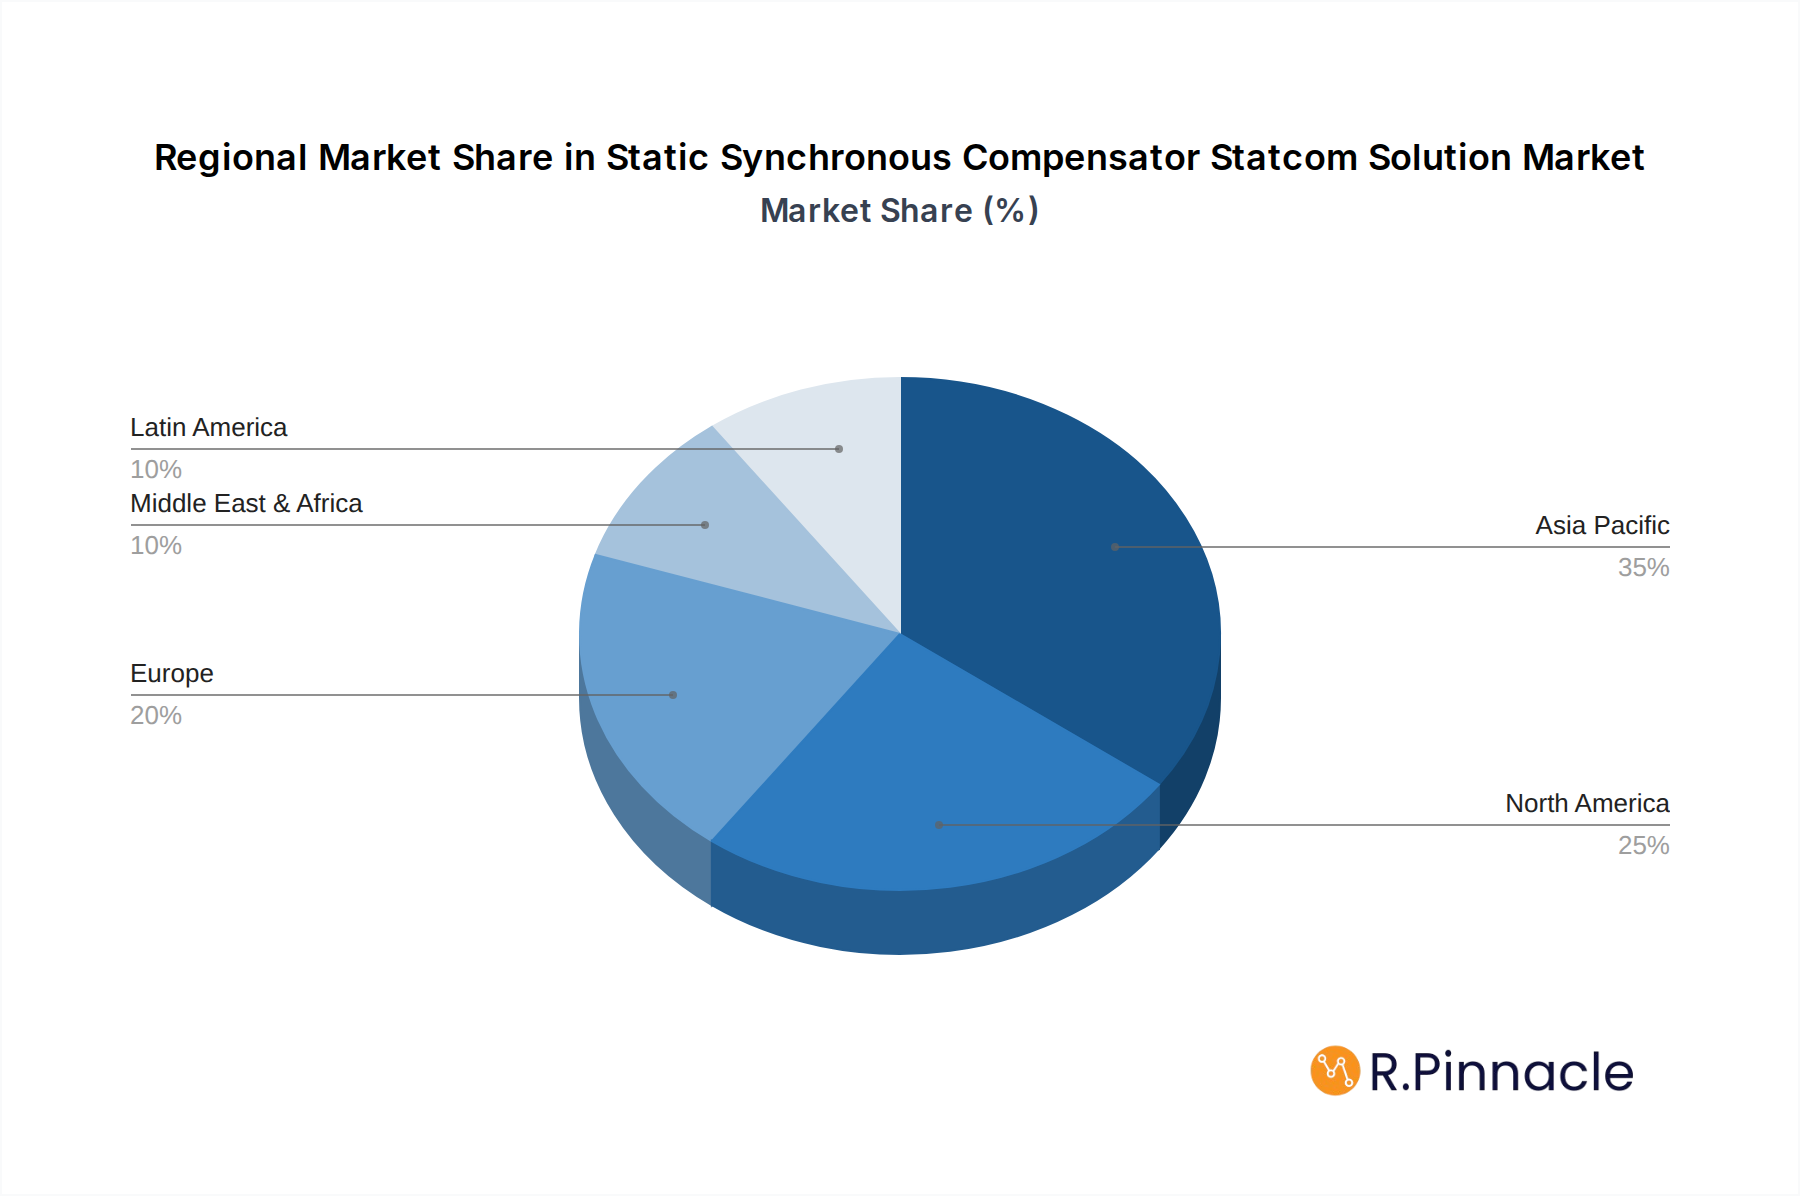
The global STATCOM solution market demonstrates significant regional and segmental dominance, driven by distinct economic, infrastructural, and policy landscapes. In terms of geographical dominance, North America is a leading region, largely attributed to its extensive and aging power infrastructure, coupled with significant investments in grid modernization and renewable energy integration. The United States, in particular, with its stringent grid reliability standards and ambitious renewable energy targets, represents a substantial market for STATCOMs. Key drivers for this dominance include:
- Economic Policies: Favorable government incentives and policies promoting renewable energy development and grid upgrades.
- Infrastructure: A vast and complex existing power transmission and distribution network that requires continuous reinforcement and modernization to handle increased loads and integrate distributed generation.
- Technological Adoption: High receptiveness to adopting advanced technologies for grid optimization and stability.
Within North America, the Utility segment for Application is the most prominent. Utilities are the primary investors in STATCOM solutions to ensure grid stability, manage voltage fluctuations, and meet grid code requirements for integrating renewable energy. The ongoing transition away from traditional fossil fuel power plants and the rapid expansion of wind and solar farms necessitate STATCOMs for maintaining a stable and reliable power supply.
In terms of Type, the HVDC STATCOM segment is witnessing significant traction due to the increasing deployment of High-Voltage Direct Current (HVDC) transmission lines, which often require STATCOMs for reactive power compensation and grid interconnection. These systems are crucial for managing the power flow and voltage stability in long-distance HVDC transmission networks.
The dominance in these regions and segments is further propelled by:
- Stringent Grid Codes: Regulatory bodies in North America impose strict grid codes that mandate utilities to maintain specific voltage levels and power quality, making STATCOMs indispensable.
- Aging Infrastructure Investment: Significant capital is being invested in upgrading and modernizing aging power grids to enhance their resilience and capacity.
- Renewable Energy Expansion: The rapid growth of renewable energy projects, particularly in remote areas, necessitates STATCOMs to ensure their reliable integration into the national grid.
The Asia-Pacific region is also a rapidly growing market, driven by burgeoning economies, rapid industrialization, and substantial government initiatives to expand and modernize power grids. Countries like China and India are major contributors to this growth, with substantial investments in infrastructure development and renewable energy projects. The increasing demand for reliable electricity supply to support economic growth, coupled with the need to manage the integration of large-scale renewable energy projects, positions Asia-Pacific as a critical market.
Static Synchronous Compensator Statcom Solution Product Innovations
STATCOM solution innovations are primarily focused on enhancing performance, efficiency, and integration capabilities. Recent product developments include the introduction of modular and scalable STATCOM systems offering greater flexibility for utilities and industrial clients. These innovations leverage advanced semiconductor technologies like Silicon Carbide (SiC) and Gallium Nitride (GaN) to achieve higher switching frequencies, reduced power losses, and smaller form factors. Enhanced control algorithms are being developed to provide faster and more precise voltage and reactive power control, crucial for stabilizing grids with high renewable energy penetration. Competitive advantages are being sought through improved system reliability, reduced maintenance requirements, and seamless integration with existing SCADA and grid management systems. Market fit is being optimized by tailoring STATCOM solutions to specific application needs, ranging from large-scale transmission grid support to localized industrial power quality improvement.
Report Scope & Segmentation Analysis
This report provides a comprehensive analysis of the global Static Synchronous Compensator (STATCOM) solution market, segmented by Application and Type. The Application segment includes key areas such as Transmission Grid Support, Distribution Grid Support, and Industrial Applications. Transmission Grid Support, crucial for maintaining grid stability and voltage profiles in high-voltage networks, is projected to hold the largest market share, estimated at over $1,500 million in 2025, with a projected CAGR of 7.8%. Distribution Grid Support, vital for managing voltage fluctuations in lower-voltage networks and integrating distributed generation, is expected to grow at a CAGR of 7.2%, reaching an estimated $800 million in 2025. Industrial Applications, focused on improving power quality and mitigating grid disturbances in manufacturing and heavy industries, are forecast to grow at a CAGR of 6.9%, with an estimated market size of $600 million in 2025.
The Type segment is analyzed based on voltage levels, primarily High Voltage (HV) and Medium Voltage (MV). The HV STATCOM segment, critical for bulk power transmission and grid interconnection, is anticipated to dominate, with an estimated market size of over $2,200 million in 2025 and a CAGR of 7.7%. The MV STATCOM segment, serving industrial facilities and localized grid improvements, is projected to grow at a CAGR of 7.1%, with an estimated market size of $700 million in 2025. Competitive dynamics within these segments are characterized by technological advancements, cost-effectiveness, and the ability to meet specific grid code requirements.
Key Drivers of Static Synchronous Compensator Statcom Solution Growth
Several key factors are propelling the growth of the STATCOM solution market. Firstly, the increasing global demand for electricity, coupled with the growing integration of renewable energy sources, necessitates robust grid stabilization technologies. STATCOMs are vital for managing the intermittency of solar and wind power, ensuring grid reliability. Secondly, stringent grid codes and regulatory mandates worldwide are compelling utilities to invest in advanced power quality solutions, including STATCOMs, to maintain grid stability and prevent blackouts. Thirdly, the ongoing modernization of aging power infrastructure and the development of smart grids are creating significant opportunities for STATCOM deployment. Finally, the need for improved industrial power quality, to reduce equipment downtime and enhance operational efficiency in sectors like manufacturing and mining, is also a significant growth driver.
Challenges in the Static Synchronous Compensator Statcom Solution Sector
Despite the promising growth trajectory, the STATCOM solution sector faces certain challenges. One primary challenge is the high initial capital investment required for STATCOM installations, which can be a deterrent for some smaller utilities and industrial players. Secondly, the complexity of advanced control systems and the need for skilled personnel for installation, operation, and maintenance can pose integration hurdles. Regulatory complexities and the lengthy approval processes for large-scale grid infrastructure projects can also lead to project delays. Furthermore, evolving grid technologies and the potential emergence of even more advanced reactive power compensation solutions could introduce competitive pressures in the long term. Supply chain disruptions for critical components, particularly advanced semiconductors, can also impact production timelines and costs.
Emerging Opportunities in Static Synchronous Compensator Statcom Solution
The STATCOM solution market is ripe with emerging opportunities. The rapid expansion of offshore wind farms presents a significant avenue for STATCOM deployment to stabilize the grid connection. The increasing adoption of electric vehicles (EVs) and the associated charging infrastructure will necessitate enhanced grid management, creating a demand for STATCOMs to mitigate local voltage fluctuations. Furthermore, the development of microgrids and distributed energy resource management systems offers opportunities for STATCOM integration to enhance local grid resilience and reliability. The growing trend of digitalization in the power sector also opens up opportunities for STATCOMs equipped with advanced communication and analytics capabilities, enabling predictive maintenance and optimized grid operation. The development of STATCOM solutions for emerging economies with rapidly expanding power grids and industrial sectors also represents a substantial growth prospect.
Leading Players in the Static Synchronous Compensator Statcom Solution Market
- Hitachi
- GE
- Siemens
- Mitsubishi Electric
- NR Electric
- Ingeteam
- AMSC
- Hopewind
- Anhui Zhongdian Electric
- Diram
- Hilkar
- Merus
- SIFANG
- ABB
- Endoks
- Strong Power
- RXHK
Key Developments in Static Synchronous Compensator Statcom Solution Industry
- 2023: Siemens launched a new generation of highly efficient STATCOMs with enhanced modularity and improved grid support capabilities.
- 2023: GE announced a major contract for supplying STATCOM solutions for a large-scale renewable energy integration project in North America, valued at over $50 million.
- 2022: Mitsubishi Electric showcased its latest advancements in STATCOM technology, focusing on faster response times and reduced footprint, at the CIGRE session.
- 2022: Ingeteam secured a significant order for STATCOM systems to support grid stability for a new offshore wind farm in Europe, with the project value estimated at $40 million.
- 2021: Hitachi Energy expanded its STATCOM portfolio with a focus on digital integration and advanced control features for smart grid applications.
- 2020: ABB completed the commissioning of a record-breaking STATCOM installation for a major transmission utility, contributing to enhanced grid reliability.
Future Outlook for Static Synchronous Compensator Statcom Solution Market
The future outlook for the STATCOM solution market is exceptionally positive, driven by the continued global transition towards renewable energy and the imperative for modernizing power grids. The increasing complexity of power systems, with the proliferation of distributed energy resources and the growing demand for grid resilience, will solidify the role of STATCOMs as essential grid support infrastructure. Technological advancements in power electronics and control systems will lead to more efficient, cost-effective, and intelligent STATCOM solutions, further accelerating their adoption. Emerging applications such as microgrids, EV charging infrastructure, and the digitalization of power networks will unlock new growth avenues. Strategic partnerships and mergers, aimed at expanding market reach and technological capabilities, are expected to continue. The market is poised for sustained growth, with significant potential for innovation and expansion in the coming years.
Static Synchronous Compensator Statcom Solution Segmentation
-
1. Application
- 1.1. undefined
-
2. Type
- 2.1. undefined
Static Synchronous Compensator Statcom Solution Segmentation By Geography
- 1. undefined
- 2. undefined
- 3. undefined
- 4. undefined
- 5. undefined
Static Synchronous Compensator Statcom Solution Regional Market Share
Geographic Coverage of Static Synchronous Compensator Statcom Solution
Static Synchronous Compensator Statcom Solution REPORT HIGHLIGHTS
| Aspects | Details |
|---|---|
| Study Period | 2020-2034 |
| Base Year | 2025 |
| Estimated Year | 2026 |
| Forecast Period | 2026-2034 |
| Historical Period | 2020-2025 |
| Growth Rate | CAGR of 4.6% from 2020-2034 |
| Segmentation |
|
Table of Contents
- 1. Introduction
- 1.1. Research Scope
- 1.2. Market Segmentation
- 1.3. Research Methodology
- 1.4. Definitions and Assumptions
- 2. Executive Summary
- 2.1. Introduction
- 3. Market Dynamics
- 3.1. Introduction
- 3.2. Market Drivers
- 3.3. Market Restrains
- 3.4. Market Trends
- 4. Market Factor Analysis
- 4.1. Porters Five Forces
- 4.2. Supply/Value Chain
- 4.3. PESTEL analysis
- 4.4. Market Entropy
- 4.5. Patent/Trademark Analysis
- 5. Global Static Synchronous Compensator Statcom Solution Analysis, Insights and Forecast, 2020-2032
- 5.1. Market Analysis, Insights and Forecast - by Application
- 5.1.1.
- 5.2. Market Analysis, Insights and Forecast - by Type
- 5.2.1.
- 5.3. Market Analysis, Insights and Forecast - by Region
- 5.3.1.
- 5.3.2.
- 5.3.3.
- 5.3.4.
- 5.3.5.
- 5.1. Market Analysis, Insights and Forecast - by Application
- 6. undefined Static Synchronous Compensator Statcom Solution Analysis, Insights and Forecast, 2020-2032
- 6.1. Market Analysis, Insights and Forecast - by Application
- 6.1.1.
- 6.2. Market Analysis, Insights and Forecast - by Type
- 6.2.1.
- 6.1. Market Analysis, Insights and Forecast - by Application
- 7. undefined Static Synchronous Compensator Statcom Solution Analysis, Insights and Forecast, 2020-2032
- 7.1. Market Analysis, Insights and Forecast - by Application
- 7.1.1.
- 7.2. Market Analysis, Insights and Forecast - by Type
- 7.2.1.
- 7.1. Market Analysis, Insights and Forecast - by Application
- 8. undefined Static Synchronous Compensator Statcom Solution Analysis, Insights and Forecast, 2020-2032
- 8.1. Market Analysis, Insights and Forecast - by Application
- 8.1.1.
- 8.2. Market Analysis, Insights and Forecast - by Type
- 8.2.1.
- 8.1. Market Analysis, Insights and Forecast - by Application
- 9. undefined Static Synchronous Compensator Statcom Solution Analysis, Insights and Forecast, 2020-2032
- 9.1. Market Analysis, Insights and Forecast - by Application
- 9.1.1.
- 9.2. Market Analysis, Insights and Forecast - by Type
- 9.2.1.
- 9.1. Market Analysis, Insights and Forecast - by Application
- 10. undefined Static Synchronous Compensator Statcom Solution Analysis, Insights and Forecast, 2020-2032
- 10.1. Market Analysis, Insights and Forecast - by Application
- 10.1.1.
- 10.2. Market Analysis, Insights and Forecast - by Type
- 10.2.1.
- 10.1. Market Analysis, Insights and Forecast - by Application
- 11. Competitive Analysis
- 11.1. Global Market Share Analysis 2025
- 11.2. Company Profiles
- 11.2.1 Hitachi
- 11.2.1.1. Overview
- 11.2.1.2. Products
- 11.2.1.3. SWOT Analysis
- 11.2.1.4. Recent Developments
- 11.2.1.5. Financials (Based on Availability)
- 11.2.2 GE
- 11.2.2.1. Overview
- 11.2.2.2. Products
- 11.2.2.3. SWOT Analysis
- 11.2.2.4. Recent Developments
- 11.2.2.5. Financials (Based on Availability)
- 11.2.3 Siemens
- 11.2.3.1. Overview
- 11.2.3.2. Products
- 11.2.3.3. SWOT Analysis
- 11.2.3.4. Recent Developments
- 11.2.3.5. Financials (Based on Availability)
- 11.2.4 Mitsubishi Electric
- 11.2.4.1. Overview
- 11.2.4.2. Products
- 11.2.4.3. SWOT Analysis
- 11.2.4.4. Recent Developments
- 11.2.4.5. Financials (Based on Availability)
- 11.2.5 NR Electric
- 11.2.5.1. Overview
- 11.2.5.2. Products
- 11.2.5.3. SWOT Analysis
- 11.2.5.4. Recent Developments
- 11.2.5.5. Financials (Based on Availability)
- 11.2.6 Ingeteam
- 11.2.6.1. Overview
- 11.2.6.2. Products
- 11.2.6.3. SWOT Analysis
- 11.2.6.4. Recent Developments
- 11.2.6.5. Financials (Based on Availability)
- 11.2.7 AMSC
- 11.2.7.1. Overview
- 11.2.7.2. Products
- 11.2.7.3. SWOT Analysis
- 11.2.7.4. Recent Developments
- 11.2.7.5. Financials (Based on Availability)
- 11.2.8 Hopewind
- 11.2.8.1. Overview
- 11.2.8.2. Products
- 11.2.8.3. SWOT Analysis
- 11.2.8.4. Recent Developments
- 11.2.8.5. Financials (Based on Availability)
- 11.2.9 Anhui Zhongdian Electric
- 11.2.9.1. Overview
- 11.2.9.2. Products
- 11.2.9.3. SWOT Analysis
- 11.2.9.4. Recent Developments
- 11.2.9.5. Financials (Based on Availability)
- 11.2.10 Diram
- 11.2.10.1. Overview
- 11.2.10.2. Products
- 11.2.10.3. SWOT Analysis
- 11.2.10.4. Recent Developments
- 11.2.10.5. Financials (Based on Availability)
- 11.2.11 Hilkar
- 11.2.11.1. Overview
- 11.2.11.2. Products
- 11.2.11.3. SWOT Analysis
- 11.2.11.4. Recent Developments
- 11.2.11.5. Financials (Based on Availability)
- 11.2.12 Merus
- 11.2.12.1. Overview
- 11.2.12.2. Products
- 11.2.12.3. SWOT Analysis
- 11.2.12.4. Recent Developments
- 11.2.12.5. Financials (Based on Availability)
- 11.2.13 SIFANG
- 11.2.13.1. Overview
- 11.2.13.2. Products
- 11.2.13.3. SWOT Analysis
- 11.2.13.4. Recent Developments
- 11.2.13.5. Financials (Based on Availability)
- 11.2.14 ABB
- 11.2.14.1. Overview
- 11.2.14.2. Products
- 11.2.14.3. SWOT Analysis
- 11.2.14.4. Recent Developments
- 11.2.14.5. Financials (Based on Availability)
- 11.2.15 Endoks
- 11.2.15.1. Overview
- 11.2.15.2. Products
- 11.2.15.3. SWOT Analysis
- 11.2.15.4. Recent Developments
- 11.2.15.5. Financials (Based on Availability)
- 11.2.16 Strong Power
- 11.2.16.1. Overview
- 11.2.16.2. Products
- 11.2.16.3. SWOT Analysis
- 11.2.16.4. Recent Developments
- 11.2.16.5. Financials (Based on Availability)
- 11.2.17 RXHK
- 11.2.17.1. Overview
- 11.2.17.2. Products
- 11.2.17.3. SWOT Analysis
- 11.2.17.4. Recent Developments
- 11.2.17.5. Financials (Based on Availability)
- 11.2.1 Hitachi
List of Figures
- Figure 1: Global Static Synchronous Compensator Statcom Solution Revenue Breakdown (million, %) by Region 2025 & 2033
- Figure 2: undefined Static Synchronous Compensator Statcom Solution Revenue (million), by Application 2025 & 2033
- Figure 3: undefined Static Synchronous Compensator Statcom Solution Revenue Share (%), by Application 2025 & 2033
- Figure 4: undefined Static Synchronous Compensator Statcom Solution Revenue (million), by Type 2025 & 2033
- Figure 5: undefined Static Synchronous Compensator Statcom Solution Revenue Share (%), by Type 2025 & 2033
- Figure 6: undefined Static Synchronous Compensator Statcom Solution Revenue (million), by Country 2025 & 2033
- Figure 7: undefined Static Synchronous Compensator Statcom Solution Revenue Share (%), by Country 2025 & 2033
- Figure 8: undefined Static Synchronous Compensator Statcom Solution Revenue (million), by Application 2025 & 2033
- Figure 9: undefined Static Synchronous Compensator Statcom Solution Revenue Share (%), by Application 2025 & 2033
- Figure 10: undefined Static Synchronous Compensator Statcom Solution Revenue (million), by Type 2025 & 2033
- Figure 11: undefined Static Synchronous Compensator Statcom Solution Revenue Share (%), by Type 2025 & 2033
- Figure 12: undefined Static Synchronous Compensator Statcom Solution Revenue (million), by Country 2025 & 2033
- Figure 13: undefined Static Synchronous Compensator Statcom Solution Revenue Share (%), by Country 2025 & 2033
- Figure 14: undefined Static Synchronous Compensator Statcom Solution Revenue (million), by Application 2025 & 2033
- Figure 15: undefined Static Synchronous Compensator Statcom Solution Revenue Share (%), by Application 2025 & 2033
- Figure 16: undefined Static Synchronous Compensator Statcom Solution Revenue (million), by Type 2025 & 2033
- Figure 17: undefined Static Synchronous Compensator Statcom Solution Revenue Share (%), by Type 2025 & 2033
- Figure 18: undefined Static Synchronous Compensator Statcom Solution Revenue (million), by Country 2025 & 2033
- Figure 19: undefined Static Synchronous Compensator Statcom Solution Revenue Share (%), by Country 2025 & 2033
- Figure 20: undefined Static Synchronous Compensator Statcom Solution Revenue (million), by Application 2025 & 2033
- Figure 21: undefined Static Synchronous Compensator Statcom Solution Revenue Share (%), by Application 2025 & 2033
- Figure 22: undefined Static Synchronous Compensator Statcom Solution Revenue (million), by Type 2025 & 2033
- Figure 23: undefined Static Synchronous Compensator Statcom Solution Revenue Share (%), by Type 2025 & 2033
- Figure 24: undefined Static Synchronous Compensator Statcom Solution Revenue (million), by Country 2025 & 2033
- Figure 25: undefined Static Synchronous Compensator Statcom Solution Revenue Share (%), by Country 2025 & 2033
- Figure 26: undefined Static Synchronous Compensator Statcom Solution Revenue (million), by Application 2025 & 2033
- Figure 27: undefined Static Synchronous Compensator Statcom Solution Revenue Share (%), by Application 2025 & 2033
- Figure 28: undefined Static Synchronous Compensator Statcom Solution Revenue (million), by Type 2025 & 2033
- Figure 29: undefined Static Synchronous Compensator Statcom Solution Revenue Share (%), by Type 2025 & 2033
- Figure 30: undefined Static Synchronous Compensator Statcom Solution Revenue (million), by Country 2025 & 2033
- Figure 31: undefined Static Synchronous Compensator Statcom Solution Revenue Share (%), by Country 2025 & 2033
List of Tables
- Table 1: Global Static Synchronous Compensator Statcom Solution Revenue million Forecast, by Application 2020 & 2033
- Table 2: Global Static Synchronous Compensator Statcom Solution Revenue million Forecast, by Type 2020 & 2033
- Table 3: Global Static Synchronous Compensator Statcom Solution Revenue million Forecast, by Region 2020 & 2033
- Table 4: Global Static Synchronous Compensator Statcom Solution Revenue million Forecast, by Application 2020 & 2033
- Table 5: Global Static Synchronous Compensator Statcom Solution Revenue million Forecast, by Type 2020 & 2033
- Table 6: Global Static Synchronous Compensator Statcom Solution Revenue million Forecast, by Country 2020 & 2033
- Table 7: Global Static Synchronous Compensator Statcom Solution Revenue million Forecast, by Application 2020 & 2033
- Table 8: Global Static Synchronous Compensator Statcom Solution Revenue million Forecast, by Type 2020 & 2033
- Table 9: Global Static Synchronous Compensator Statcom Solution Revenue million Forecast, by Country 2020 & 2033
- Table 10: Global Static Synchronous Compensator Statcom Solution Revenue million Forecast, by Application 2020 & 2033
- Table 11: Global Static Synchronous Compensator Statcom Solution Revenue million Forecast, by Type 2020 & 2033
- Table 12: Global Static Synchronous Compensator Statcom Solution Revenue million Forecast, by Country 2020 & 2033
- Table 13: Global Static Synchronous Compensator Statcom Solution Revenue million Forecast, by Application 2020 & 2033
- Table 14: Global Static Synchronous Compensator Statcom Solution Revenue million Forecast, by Type 2020 & 2033
- Table 15: Global Static Synchronous Compensator Statcom Solution Revenue million Forecast, by Country 2020 & 2033
- Table 16: Global Static Synchronous Compensator Statcom Solution Revenue million Forecast, by Application 2020 & 2033
- Table 17: Global Static Synchronous Compensator Statcom Solution Revenue million Forecast, by Type 2020 & 2033
- Table 18: Global Static Synchronous Compensator Statcom Solution Revenue million Forecast, by Country 2020 & 2033
Frequently Asked Questions
1. What is the projected Compound Annual Growth Rate (CAGR) of the Static Synchronous Compensator Statcom Solution?
The projected CAGR is approximately 4.6%.
2. Which companies are prominent players in the Static Synchronous Compensator Statcom Solution?
Key companies in the market include Hitachi, GE, Siemens, Mitsubishi Electric, NR Electric, Ingeteam, AMSC, Hopewind, Anhui Zhongdian Electric, Diram, Hilkar, Merus, SIFANG, ABB, Endoks, Strong Power, RXHK.
3. What are the main segments of the Static Synchronous Compensator Statcom Solution?
The market segments include Application, Type.
4. Can you provide details about the market size?
The market size is estimated to be USD 1267 million as of 2022.
5. What are some drivers contributing to market growth?
N/A
6. What are the notable trends driving market growth?
N/A
7. Are there any restraints impacting market growth?
N/A
8. Can you provide examples of recent developments in the market?
N/A
9. What pricing options are available for accessing the report?
Pricing options include single-user, multi-user, and enterprise licenses priced at USD 4900.00, USD 7350.00, and USD 9800.00 respectively.
10. Is the market size provided in terms of value or volume?
The market size is provided in terms of value, measured in million.
11. Are there any specific market keywords associated with the report?
Yes, the market keyword associated with the report is "Static Synchronous Compensator Statcom Solution," which aids in identifying and referencing the specific market segment covered.
12. How do I determine which pricing option suits my needs best?
The pricing options vary based on user requirements and access needs. Individual users may opt for single-user licenses, while businesses requiring broader access may choose multi-user or enterprise licenses for cost-effective access to the report.
13. Are there any additional resources or data provided in the Static Synchronous Compensator Statcom Solution report?
While the report offers comprehensive insights, it's advisable to review the specific contents or supplementary materials provided to ascertain if additional resources or data are available.
14. How can I stay updated on further developments or reports in the Static Synchronous Compensator Statcom Solution?
To stay informed about further developments, trends, and reports in the Static Synchronous Compensator Statcom Solution, consider subscribing to industry newsletters, following relevant companies and organizations, or regularly checking reputable industry news sources and publications.
Methodology
Step 1 - Identification of Relevant Samples Size from Population Database


Step 2 - Approaches for Defining Global Market Size (Value, Volume* & Price*)

Note*: In applicable scenarios
Step 3 - Data Sources
Primary Research
- Web Analytics
- Survey Reports
- Research Institute
- Latest Research Reports
- Opinion Leaders
Secondary Research
- Annual Reports
- White Paper
- Latest Press Release
- Industry Association
- Paid Database
- Investor Presentations

Step 4 - Data Triangulation
Involves using different sources of information in order to increase the validity of a study
These sources are likely to be stakeholders in a program - participants, other researchers, program staff, other community members, and so on.
Then we put all data in single framework & apply various statistical tools to find out the dynamic on the market.
During the analysis stage, feedback from the stakeholder groups would be compared to determine areas of agreement as well as areas of divergence