

Key Insights
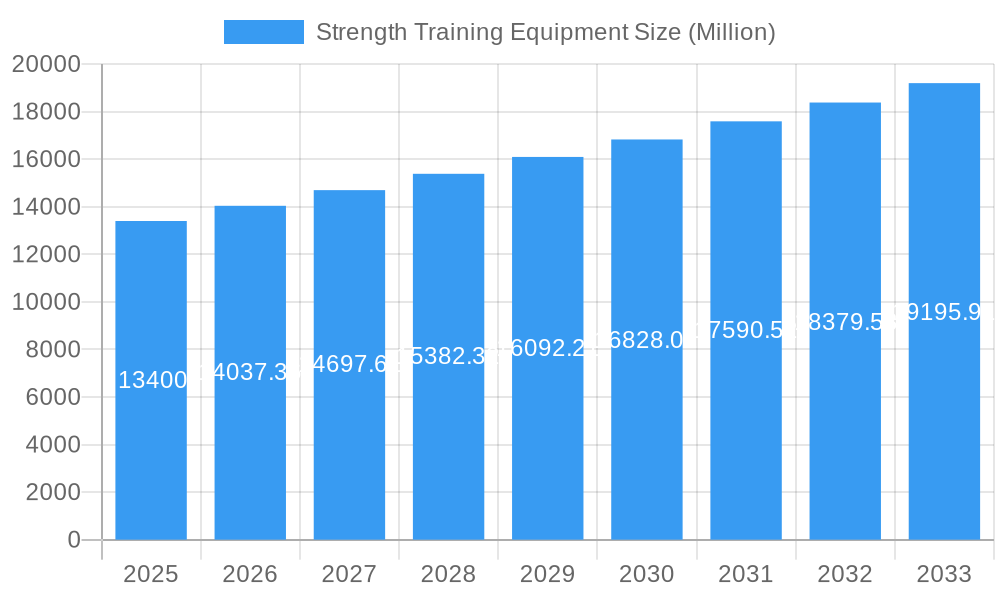
The global strength training equipment market, currently valued at $12.88 billion in the base year of 2025, is projected for significant expansion. This growth is propelled by escalating health consciousness, the rising incidence of lifestyle-related diseases, and a greater emphasis on preventative healthcare. Technological innovations, particularly in smart fitness equipment offering personalized training and performance tracking, are enhancing user engagement and driving market development. The surge in home fitness, amplified by recent global events, has created a substantial new market segment, increasing demand for adaptable and compact equipment. Leading manufacturers are responding with diversified product offerings, ranging from premium professional solutions to accessible home gym options, to meet varied consumer requirements. The competitive landscape is dynamic, with established brands navigating the emergence of specialized and niche product providers.
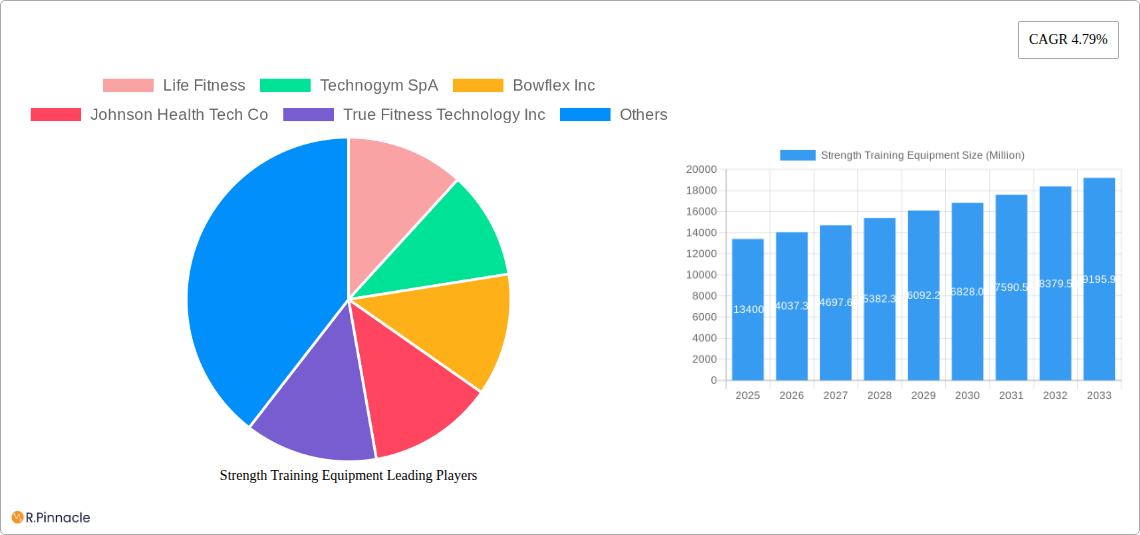
Strength Training Equipment Market Size (In Billion)
The market is anticipated to grow at a compound annual growth rate (CAGR) of 6.32%. Potential challenges include volatile raw material prices, economic fluctuations affecting consumer expenditure on fitness, and market saturation in specific areas. To address these, industry players are prioritizing sustainable manufacturing and cost-efficiency, alongside targeting underserved niches such as the senior population and specialized fitness disciplines. Emerging economies present considerable growth opportunities, driven by expanding middle classes. A detailed regional analysis is essential for understanding market intricacies and refining strategic approaches. The forecast period (2025-2033) indicates sustained growth, fueled by ongoing technological advancements and enduring consumer dedication to health and well-being.
Strength Training Equipment Company Market Share
Strength Training Equipment Market Report: 2019-2033
This comprehensive report provides an in-depth analysis of the global strength training equipment market, projecting a market value exceeding $XX Million by 2033. The study covers the historical period (2019-2024), the base year (2025), and forecasts until 2033, offering invaluable insights for industry professionals, investors, and strategic decision-makers. The report meticulously examines market dynamics, competitive landscapes, technological advancements, and emerging trends, providing actionable intelligence for navigating this dynamic sector.
Strength Training Equipment Market Structure & Innovation Trends
This section analyzes the competitive landscape, highlighting market concentration, innovation drivers, regulatory frameworks, and market dynamics influencing the $XX Million strength training equipment market. We examine mergers and acquisitions (M&A) activities, assessing their impact on market share and overall growth. Key aspects covered include:
- Market Concentration: The market exhibits a [Describe Concentration level, e.g., moderately concentrated] structure, with key players like Life Fitness, Technogym SpA, and Bowflex Inc. holding significant market share. [Insert estimated market share percentages for top 3 players].
- Innovation Drivers: Technological advancements, particularly in areas like AI-powered training programs and connected fitness technology, are driving significant innovation. The increasing focus on personalized fitness experiences and data-driven insights also fuels innovation.
- Regulatory Frameworks: Government regulations concerning product safety and standards significantly impact market operations. [ Briefly discuss relevant regulations and their impact].
- Product Substitutes: The market faces competition from alternative fitness solutions, such as bodyweight training and online fitness programs. However, the demand for specialized equipment remains robust.
- End-User Demographics: The primary end-users are gyms, fitness centers, and home users. The increasing health consciousness among consumers is driving growth, particularly in the home fitness segment.
- M&A Activities: The strength training equipment sector has witnessed [Number] significant M&A deals in the past five years, with deal values totaling approximately $XX Million. [Provide examples of notable M&A activities with brief descriptions and deal value if available].
Strength Training Equipment Market Dynamics & Trends
This section delves into the market's growth drivers, technological disruptions, consumer preferences, and competitive dynamics, projecting a CAGR of XX% from 2025 to 2033. The market is expected to reach $XX Million by 2033. Key factors impacting market growth include:
[Write a paragraph of 600 words focusing on market growth drivers, technological disruptions, consumer preferences, competitive dynamics, and relevant metrics such as CAGR and market penetration. Include details about the rising popularity of home fitness, the impact of technological advancements like connected fitness and AI, shifting consumer preferences towards personalized fitness experiences, and the competitive strategies employed by key players.]
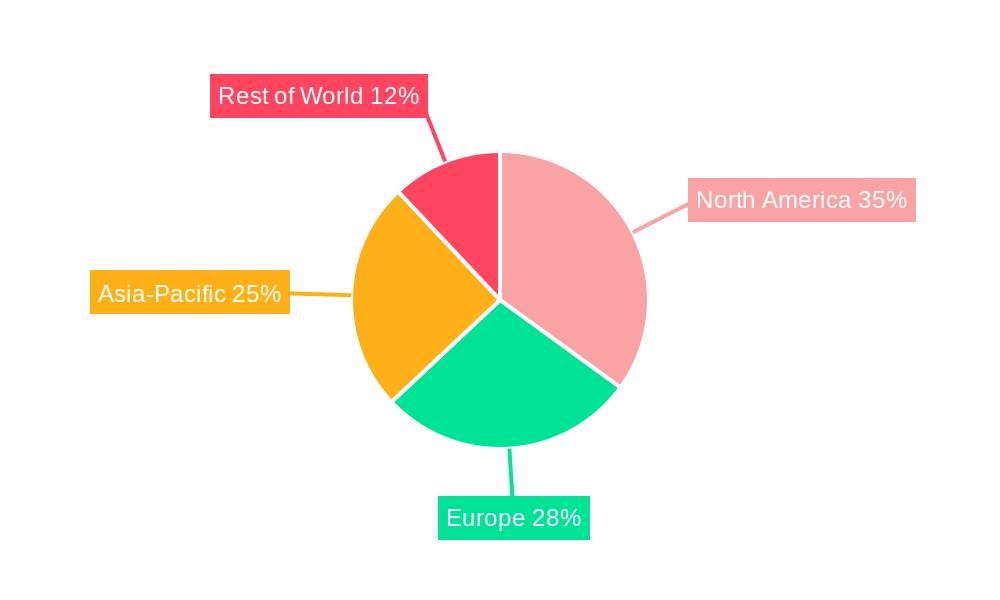
Dominant Regions & Segments in Strength Training Equipment
This section identifies the leading regions and segments within the strength training equipment market. [Mention the leading region/country]. Its dominance is attributable to:
- Economic Factors: [Discuss relevant economic factors like high disposable income, robust economic growth, and government support for fitness initiatives].
- Infrastructure: [Discuss factors like the high density of fitness centers, well-developed infrastructure, and ease of distribution].
[Write a paragraph of approximately 600 words providing a detailed analysis of the dominant region/country's market share, growth trajectory, and key contributing factors. This analysis should include a comparison to other regions/countries and explain the reasons behind the dominance].
Strength Training Equipment Product Innovations
Recent years have witnessed significant product innovations, including AI-powered training equipment, connected fitness solutions, and technologically advanced designs. These innovations cater to the growing demand for personalized and effective workout experiences, enhancing user engagement and optimizing training outcomes. The integration of advanced technology has created competitive advantages for manufacturers, leading to enhanced market penetration. [Provide more detail within the 100-150 word limit.]
Report Scope & Segmentation Analysis
[Write a paragraph of 100-150 words detailing all market segmentations, including a paragraph per segment, with growth projections, market sizes, and competitive dynamics for each segment. For example, segment by product type (e.g., weight machines, free weights, functional trainers), end-user (e.g., commercial gyms, home use), and region (e.g., North America, Europe, Asia-Pacific). Use estimated values for market size and growth projections.]
Key Drivers of Strength Training Equipment Growth
The growth of the strength training equipment market is driven by several key factors. The increasing health consciousness among consumers worldwide is a significant driver, leading to greater participation in fitness activities. Technological advancements in fitness equipment, such as connected fitness and AI-powered training, also boost market growth. Government initiatives promoting health and wellness further contribute to the expansion of this market. [Provide more detail within the 150 word limit.]
Challenges in the Strength Training Equipment Sector
The strength training equipment sector faces challenges such as increasing raw material costs, supply chain disruptions, intense competition, and stringent regulatory compliance requirements. These factors can affect profitability and market growth. The rising cost of manufacturing and shipping can lead to higher product prices, potentially impacting consumer demand. [Provide more detail within the 150 word limit.]
Emerging Opportunities in Strength Training Equipment
Emerging opportunities in the strength training equipment market include the growing popularity of home fitness, increasing adoption of virtual and augmented reality technologies, and the expansion of the senior fitness market. The market's growth potential is significant, driven by the increasing health awareness and the demand for technologically advanced fitness solutions. [Provide more detail within the 150 word limit.]
Leading Players in the Strength Training Equipment Market
- Life Fitness
- Technogym SpA
- Bowflex Inc
- Johnson Health Tech Co
- True Fitness Technology Inc
- Origin Fitness Limited
- Dyaco International Inc
- Decathlon
- IFIT Health And Fitness Inc
- Body Solid Inc
Key Developments in Strength Training Equipment Industry
- March 2023: Life Fitness introduced the latest generation cardio, strength, and digital product innovations, including the Life Fitness Insignia lines and the Hammer Strength HD Plate and Plate Loaded machines. This launch significantly enhanced the company's product portfolio and competitive edge.
- August 2023: Bowflex Inc. relaunched its iconic BowFlex brand with a new identity, visual design, and updated logo. This relaunch aimed to revitalize the brand and attract a wider customer base.
- January 2022: Technogym launched a strength training line leveraging artificial intelligence and scientific research. This innovation is expected to increase Technogym's market share and customer base.
Future Outlook for Strength Training Equipment Market
The strength training equipment market is poised for continued growth, driven by the increasing adoption of technologically advanced fitness solutions, the rising demand for personalized fitness experiences, and the expansion of the home fitness segment. Strategic partnerships, product innovations, and expansion into new markets will be crucial for companies seeking to capitalize on the market's growth potential. The market is expected to experience sustained growth throughout the forecast period, presenting significant opportunities for industry players.
Strength Training Equipment Segmentation
-
1. Product Type
- 1.1. Weights
- 1.2. Racks and Benches
- 1.3. Exercise and Medicine Balls
- 1.4. Other Product Types
-
2. End User
- 2.1. Residential
- 2.2. Commercial
-
3. Distribution Channel
- 3.1. Online Retail Stores
- 3.2. Offline retail Stores
Strength Training Equipment Segmentation By Geography
-
1. North America
- 1.1. United States
- 1.2. Canada
- 1.3. Rest of North America
-
2. Europe
- 2.1. United Kingdom
- 2.2. Germany
- 2.3. Spain
- 2.4. France
- 2.5. Italy
- 2.6. Austria
- 2.7. Switzerland
- 2.8. Rest of Europe
-
3. Asia Pacific
- 3.1. China
- 3.2. Japan
- 3.3. South Korea
- 3.4. Australia
- 3.5. Rest of Asia Pacific
-
4. Rest of the World
- 4.1. South America
- 4.2. Middle East
Strength Training Equipment Regional Market Share
Geographic Coverage of Strength Training Equipment
Strength Training Equipment REPORT HIGHLIGHTS
| Aspects | Details |
|---|---|
| Study Period | 2020-2034 |
| Base Year | 2025 |
| Estimated Year | 2026 |
| Forecast Period | 2026-2034 |
| Historical Period | 2020-2025 |
| Growth Rate | CAGR of 6.32% from 2020-2034 |
| Segmentation |
|
Table of Contents
- 1. Introduction
- 1.1. Research Scope
- 1.2. Market Segmentation
- 1.3. Research Objective
- 1.4. Definitions and Assumptions
- 2. Executive Summary
- 2.1. Market Snapshot
- 3. Market Dynamics
- 3.1. Market Drivers
- 3.2. Market Restrains
- 3.3. Market Trends
- 3.4. Market Opportunities
- 4. Market Factor Analysis
- 4.1. Porters Five Forces
- 4.1.1. Bargaining Power of Suppliers
- 4.1.2. Bargaining Power of Buyers
- 4.1.3. Threat of New Entrants
- 4.1.4. Threat of Substitutes
- 4.1.5. Competitive Rivalry
- 4.2. PESTEL analysis
- 4.3. BCG Analysis
- 4.3.1. Stars (High Growth, High Market Share)
- 4.3.2. Cash Cows (Low Growth, High Market Share)
- 4.3.3. Question Mark (High Growth, Low Market Share)
- 4.3.4. Dogs (Low Growth, Low Market Share)
- 4.4. Ansoff Matrix Analysis
- 4.5. Supply Chain Analysis
- 4.6. Regulatory Landscape
- 4.7. Current Market Potential and Opportunity Assessment (TAM–SAM–SOM Framework)
- 4.8. PRI Analyst Note
- 4.1. Porters Five Forces
- 5. Market Analysis, Insights and Forecast 2021-2033
- 5.1. Market Analysis, Insights and Forecast - by Product Type
- 5.1.1. Weights
- 5.1.2. Racks and Benches
- 5.1.3. Exercise and Medicine Balls
- 5.1.4. Other Product Types
- 5.2. Market Analysis, Insights and Forecast - by End User
- 5.2.1. Residential
- 5.2.2. Commercial
- 5.3. Market Analysis, Insights and Forecast - by Distribution Channel
- 5.3.1. Online Retail Stores
- 5.3.2. Offline retail Stores
- 5.4. Market Analysis, Insights and Forecast - by Region
- 5.4.1. North America
- 5.4.2. Europe
- 5.4.3. Asia Pacific
- 5.4.4. Rest of the World
- 5.1. Market Analysis, Insights and Forecast - by Product Type
- 6. Global Strength Training Equipment Analysis, Insights and Forecast, 2021-2033
- 6.1. Market Analysis, Insights and Forecast - by Product Type
- 6.1.1. Weights
- 6.1.2. Racks and Benches
- 6.1.3. Exercise and Medicine Balls
- 6.1.4. Other Product Types
- 6.2. Market Analysis, Insights and Forecast - by End User
- 6.2.1. Residential
- 6.2.2. Commercial
- 6.3. Market Analysis, Insights and Forecast - by Distribution Channel
- 6.3.1. Online Retail Stores
- 6.3.2. Offline retail Stores
- 6.1. Market Analysis, Insights and Forecast - by Product Type
- 7. North America Strength Training Equipment Analysis, Insights and Forecast, 2020-2032
- 7.1. Market Analysis, Insights and Forecast - by Product Type
- 7.1.1. Weights
- 7.1.2. Racks and Benches
- 7.1.3. Exercise and Medicine Balls
- 7.1.4. Other Product Types
- 7.2. Market Analysis, Insights and Forecast - by End User
- 7.2.1. Residential
- 7.2.2. Commercial
- 7.3. Market Analysis, Insights and Forecast - by Distribution Channel
- 7.3.1. Online Retail Stores
- 7.3.2. Offline retail Stores
- 7.1. Market Analysis, Insights and Forecast - by Product Type
- 8. Europe Strength Training Equipment Analysis, Insights and Forecast, 2020-2032
- 8.1. Market Analysis, Insights and Forecast - by Product Type
- 8.1.1. Weights
- 8.1.2. Racks and Benches
- 8.1.3. Exercise and Medicine Balls
- 8.1.4. Other Product Types
- 8.2. Market Analysis, Insights and Forecast - by End User
- 8.2.1. Residential
- 8.2.2. Commercial
- 8.3. Market Analysis, Insights and Forecast - by Distribution Channel
- 8.3.1. Online Retail Stores
- 8.3.2. Offline retail Stores
- 8.1. Market Analysis, Insights and Forecast - by Product Type
- 9. Asia Pacific Strength Training Equipment Analysis, Insights and Forecast, 2020-2032
- 9.1. Market Analysis, Insights and Forecast - by Product Type
- 9.1.1. Weights
- 9.1.2. Racks and Benches
- 9.1.3. Exercise and Medicine Balls
- 9.1.4. Other Product Types
- 9.2. Market Analysis, Insights and Forecast - by End User
- 9.2.1. Residential
- 9.2.2. Commercial
- 9.3. Market Analysis, Insights and Forecast - by Distribution Channel
- 9.3.1. Online Retail Stores
- 9.3.2. Offline retail Stores
- 9.1. Market Analysis, Insights and Forecast - by Product Type
- 10. Rest of the World Strength Training Equipment Analysis, Insights and Forecast, 2020-2032
- 10.1. Market Analysis, Insights and Forecast - by Product Type
- 10.1.1. Weights
- 10.1.2. Racks and Benches
- 10.1.3. Exercise and Medicine Balls
- 10.1.4. Other Product Types
- 10.2. Market Analysis, Insights and Forecast - by End User
- 10.2.1. Residential
- 10.2.2. Commercial
- 10.3. Market Analysis, Insights and Forecast - by Distribution Channel
- 10.3.1. Online Retail Stores
- 10.3.2. Offline retail Stores
- 10.1. Market Analysis, Insights and Forecast - by Product Type
- 11. Competitive Analysis
- 11.1. Company Profiles
- 11.1.1 Life Fitness
- 11.1.1.1. Company Overview
- 11.1.1.2. Products
- 11.1.1.3. Company Financials
- 11.1.1.4. SWOT Analysis
- 11.1.2 Technogym SpA
- 11.1.2.1. Company Overview
- 11.1.2.2. Products
- 11.1.2.3. Company Financials
- 11.1.2.4. SWOT Analysis
- 11.1.3 Bowflex Inc
- 11.1.3.1. Company Overview
- 11.1.3.2. Products
- 11.1.3.3. Company Financials
- 11.1.3.4. SWOT Analysis
- 11.1.4 Johnson Health Tech Co
- 11.1.4.1. Company Overview
- 11.1.4.2. Products
- 11.1.4.3. Company Financials
- 11.1.4.4. SWOT Analysis
- 11.1.5 True Fitness Technology Inc
- 11.1.5.1. Company Overview
- 11.1.5.2. Products
- 11.1.5.3. Company Financials
- 11.1.5.4. SWOT Analysis
- 11.1.6 Origin Fitness Limited
- 11.1.6.1. Company Overview
- 11.1.6.2. Products
- 11.1.6.3. Company Financials
- 11.1.6.4. SWOT Analysis
- 11.1.7 Dyaco International Inc
- 11.1.7.1. Company Overview
- 11.1.7.2. Products
- 11.1.7.3. Company Financials
- 11.1.7.4. SWOT Analysis
- 11.1.8 Decathlon
- 11.1.8.1. Company Overview
- 11.1.8.2. Products
- 11.1.8.3. Company Financials
- 11.1.8.4. SWOT Analysis
- 11.1.9 IFIT Health And Fitness Inc
- 11.1.9.1. Company Overview
- 11.1.9.2. Products
- 11.1.9.3. Company Financials
- 11.1.9.4. SWOT Analysis
- 11.1.10 Body Solid Inc
- 11.1.10.1. Company Overview
- 11.1.10.2. Products
- 11.1.10.3. Company Financials
- 11.1.10.4. SWOT Analysis
- 11.1.1 Life Fitness
- 11.2. Market Entropy
- 11.2.1 Company's Key Areas Served
- 11.2.2 Recent Developments
- 11.3. Company Market Share Analysis 2025
- 11.3.1 Top 5 Companies Market Share Analysis
- 11.3.2 Top 3 Companies Market Share Analysis
- 11.4. List of Potential Customers
- 12. Research Methodology
List of Figures
- Figure 1: Global Strength Training Equipment Revenue Breakdown (billion, %) by Region 2025 & 2033
- Figure 2: Global Strength Training Equipment Volume Breakdown (Billion, %) by Region 2025 & 2033
- Figure 3: North America Strength Training Equipment Revenue (billion), by Product Type 2025 & 2033
- Figure 4: North America Strength Training Equipment Volume (Billion), by Product Type 2025 & 2033
- Figure 5: North America Strength Training Equipment Revenue Share (%), by Product Type 2025 & 2033
- Figure 6: North America Strength Training Equipment Volume Share (%), by Product Type 2025 & 2033
- Figure 7: North America Strength Training Equipment Revenue (billion), by End User 2025 & 2033
- Figure 8: North America Strength Training Equipment Volume (Billion), by End User 2025 & 2033
- Figure 9: North America Strength Training Equipment Revenue Share (%), by End User 2025 & 2033
- Figure 10: North America Strength Training Equipment Volume Share (%), by End User 2025 & 2033
- Figure 11: North America Strength Training Equipment Revenue (billion), by Distribution Channel 2025 & 2033
- Figure 12: North America Strength Training Equipment Volume (Billion), by Distribution Channel 2025 & 2033
- Figure 13: North America Strength Training Equipment Revenue Share (%), by Distribution Channel 2025 & 2033
- Figure 14: North America Strength Training Equipment Volume Share (%), by Distribution Channel 2025 & 2033
- Figure 15: North America Strength Training Equipment Revenue (billion), by Country 2025 & 2033
- Figure 16: North America Strength Training Equipment Volume (Billion), by Country 2025 & 2033
- Figure 17: North America Strength Training Equipment Revenue Share (%), by Country 2025 & 2033
- Figure 18: North America Strength Training Equipment Volume Share (%), by Country 2025 & 2033
- Figure 19: Europe Strength Training Equipment Revenue (billion), by Product Type 2025 & 2033
- Figure 20: Europe Strength Training Equipment Volume (Billion), by Product Type 2025 & 2033
- Figure 21: Europe Strength Training Equipment Revenue Share (%), by Product Type 2025 & 2033
- Figure 22: Europe Strength Training Equipment Volume Share (%), by Product Type 2025 & 2033
- Figure 23: Europe Strength Training Equipment Revenue (billion), by End User 2025 & 2033
- Figure 24: Europe Strength Training Equipment Volume (Billion), by End User 2025 & 2033
- Figure 25: Europe Strength Training Equipment Revenue Share (%), by End User 2025 & 2033
- Figure 26: Europe Strength Training Equipment Volume Share (%), by End User 2025 & 2033
- Figure 27: Europe Strength Training Equipment Revenue (billion), by Distribution Channel 2025 & 2033
- Figure 28: Europe Strength Training Equipment Volume (Billion), by Distribution Channel 2025 & 2033
- Figure 29: Europe Strength Training Equipment Revenue Share (%), by Distribution Channel 2025 & 2033
- Figure 30: Europe Strength Training Equipment Volume Share (%), by Distribution Channel 2025 & 2033
- Figure 31: Europe Strength Training Equipment Revenue (billion), by Country 2025 & 2033
- Figure 32: Europe Strength Training Equipment Volume (Billion), by Country 2025 & 2033
- Figure 33: Europe Strength Training Equipment Revenue Share (%), by Country 2025 & 2033
- Figure 34: Europe Strength Training Equipment Volume Share (%), by Country 2025 & 2033
- Figure 35: Asia Pacific Strength Training Equipment Revenue (billion), by Product Type 2025 & 2033
- Figure 36: Asia Pacific Strength Training Equipment Volume (Billion), by Product Type 2025 & 2033
- Figure 37: Asia Pacific Strength Training Equipment Revenue Share (%), by Product Type 2025 & 2033
- Figure 38: Asia Pacific Strength Training Equipment Volume Share (%), by Product Type 2025 & 2033
- Figure 39: Asia Pacific Strength Training Equipment Revenue (billion), by End User 2025 & 2033
- Figure 40: Asia Pacific Strength Training Equipment Volume (Billion), by End User 2025 & 2033
- Figure 41: Asia Pacific Strength Training Equipment Revenue Share (%), by End User 2025 & 2033
- Figure 42: Asia Pacific Strength Training Equipment Volume Share (%), by End User 2025 & 2033
- Figure 43: Asia Pacific Strength Training Equipment Revenue (billion), by Distribution Channel 2025 & 2033
- Figure 44: Asia Pacific Strength Training Equipment Volume (Billion), by Distribution Channel 2025 & 2033
- Figure 45: Asia Pacific Strength Training Equipment Revenue Share (%), by Distribution Channel 2025 & 2033
- Figure 46: Asia Pacific Strength Training Equipment Volume Share (%), by Distribution Channel 2025 & 2033
- Figure 47: Asia Pacific Strength Training Equipment Revenue (billion), by Country 2025 & 2033
- Figure 48: Asia Pacific Strength Training Equipment Volume (Billion), by Country 2025 & 2033
- Figure 49: Asia Pacific Strength Training Equipment Revenue Share (%), by Country 2025 & 2033
- Figure 50: Asia Pacific Strength Training Equipment Volume Share (%), by Country 2025 & 2033
- Figure 51: Rest of the World Strength Training Equipment Revenue (billion), by Product Type 2025 & 2033
- Figure 52: Rest of the World Strength Training Equipment Volume (Billion), by Product Type 2025 & 2033
- Figure 53: Rest of the World Strength Training Equipment Revenue Share (%), by Product Type 2025 & 2033
- Figure 54: Rest of the World Strength Training Equipment Volume Share (%), by Product Type 2025 & 2033
- Figure 55: Rest of the World Strength Training Equipment Revenue (billion), by End User 2025 & 2033
- Figure 56: Rest of the World Strength Training Equipment Volume (Billion), by End User 2025 & 2033
- Figure 57: Rest of the World Strength Training Equipment Revenue Share (%), by End User 2025 & 2033
- Figure 58: Rest of the World Strength Training Equipment Volume Share (%), by End User 2025 & 2033
- Figure 59: Rest of the World Strength Training Equipment Revenue (billion), by Distribution Channel 2025 & 2033
- Figure 60: Rest of the World Strength Training Equipment Volume (Billion), by Distribution Channel 2025 & 2033
- Figure 61: Rest of the World Strength Training Equipment Revenue Share (%), by Distribution Channel 2025 & 2033
- Figure 62: Rest of the World Strength Training Equipment Volume Share (%), by Distribution Channel 2025 & 2033
- Figure 63: Rest of the World Strength Training Equipment Revenue (billion), by Country 2025 & 2033
- Figure 64: Rest of the World Strength Training Equipment Volume (Billion), by Country 2025 & 2033
- Figure 65: Rest of the World Strength Training Equipment Revenue Share (%), by Country 2025 & 2033
- Figure 66: Rest of the World Strength Training Equipment Volume Share (%), by Country 2025 & 2033
List of Tables
- Table 1: Global Strength Training Equipment Revenue billion Forecast, by Product Type 2020 & 2033
- Table 2: Global Strength Training Equipment Volume Billion Forecast, by Product Type 2020 & 2033
- Table 3: Global Strength Training Equipment Revenue billion Forecast, by End User 2020 & 2033
- Table 4: Global Strength Training Equipment Volume Billion Forecast, by End User 2020 & 2033
- Table 5: Global Strength Training Equipment Revenue billion Forecast, by Distribution Channel 2020 & 2033
- Table 6: Global Strength Training Equipment Volume Billion Forecast, by Distribution Channel 2020 & 2033
- Table 7: Global Strength Training Equipment Revenue billion Forecast, by Region 2020 & 2033
- Table 8: Global Strength Training Equipment Volume Billion Forecast, by Region 2020 & 2033
- Table 9: Global Strength Training Equipment Revenue billion Forecast, by Product Type 2020 & 2033
- Table 10: Global Strength Training Equipment Volume Billion Forecast, by Product Type 2020 & 2033
- Table 11: Global Strength Training Equipment Revenue billion Forecast, by End User 2020 & 2033
- Table 12: Global Strength Training Equipment Volume Billion Forecast, by End User 2020 & 2033
- Table 13: Global Strength Training Equipment Revenue billion Forecast, by Distribution Channel 2020 & 2033
- Table 14: Global Strength Training Equipment Volume Billion Forecast, by Distribution Channel 2020 & 2033
- Table 15: Global Strength Training Equipment Revenue billion Forecast, by Country 2020 & 2033
- Table 16: Global Strength Training Equipment Volume Billion Forecast, by Country 2020 & 2033
- Table 17: United States Strength Training Equipment Revenue (billion) Forecast, by Application 2020 & 2033
- Table 18: United States Strength Training Equipment Volume (Billion) Forecast, by Application 2020 & 2033
- Table 19: Canada Strength Training Equipment Revenue (billion) Forecast, by Application 2020 & 2033
- Table 20: Canada Strength Training Equipment Volume (Billion) Forecast, by Application 2020 & 2033
- Table 21: Rest of North America Strength Training Equipment Revenue (billion) Forecast, by Application 2020 & 2033
- Table 22: Rest of North America Strength Training Equipment Volume (Billion) Forecast, by Application 2020 & 2033
- Table 23: Global Strength Training Equipment Revenue billion Forecast, by Product Type 2020 & 2033
- Table 24: Global Strength Training Equipment Volume Billion Forecast, by Product Type 2020 & 2033
- Table 25: Global Strength Training Equipment Revenue billion Forecast, by End User 2020 & 2033
- Table 26: Global Strength Training Equipment Volume Billion Forecast, by End User 2020 & 2033
- Table 27: Global Strength Training Equipment Revenue billion Forecast, by Distribution Channel 2020 & 2033
- Table 28: Global Strength Training Equipment Volume Billion Forecast, by Distribution Channel 2020 & 2033
- Table 29: Global Strength Training Equipment Revenue billion Forecast, by Country 2020 & 2033
- Table 30: Global Strength Training Equipment Volume Billion Forecast, by Country 2020 & 2033
- Table 31: United Kingdom Strength Training Equipment Revenue (billion) Forecast, by Application 2020 & 2033
- Table 32: United Kingdom Strength Training Equipment Volume (Billion) Forecast, by Application 2020 & 2033
- Table 33: Germany Strength Training Equipment Revenue (billion) Forecast, by Application 2020 & 2033
- Table 34: Germany Strength Training Equipment Volume (Billion) Forecast, by Application 2020 & 2033
- Table 35: Spain Strength Training Equipment Revenue (billion) Forecast, by Application 2020 & 2033
- Table 36: Spain Strength Training Equipment Volume (Billion) Forecast, by Application 2020 & 2033
- Table 37: France Strength Training Equipment Revenue (billion) Forecast, by Application 2020 & 2033
- Table 38: France Strength Training Equipment Volume (Billion) Forecast, by Application 2020 & 2033
- Table 39: Italy Strength Training Equipment Revenue (billion) Forecast, by Application 2020 & 2033
- Table 40: Italy Strength Training Equipment Volume (Billion) Forecast, by Application 2020 & 2033
- Table 41: Austria Strength Training Equipment Revenue (billion) Forecast, by Application 2020 & 2033
- Table 42: Austria Strength Training Equipment Volume (Billion) Forecast, by Application 2020 & 2033
- Table 43: Switzerland Strength Training Equipment Revenue (billion) Forecast, by Application 2020 & 2033
- Table 44: Switzerland Strength Training Equipment Volume (Billion) Forecast, by Application 2020 & 2033
- Table 45: Rest of Europe Strength Training Equipment Revenue (billion) Forecast, by Application 2020 & 2033
- Table 46: Rest of Europe Strength Training Equipment Volume (Billion) Forecast, by Application 2020 & 2033
- Table 47: Global Strength Training Equipment Revenue billion Forecast, by Product Type 2020 & 2033
- Table 48: Global Strength Training Equipment Volume Billion Forecast, by Product Type 2020 & 2033
- Table 49: Global Strength Training Equipment Revenue billion Forecast, by End User 2020 & 2033
- Table 50: Global Strength Training Equipment Volume Billion Forecast, by End User 2020 & 2033
- Table 51: Global Strength Training Equipment Revenue billion Forecast, by Distribution Channel 2020 & 2033
- Table 52: Global Strength Training Equipment Volume Billion Forecast, by Distribution Channel 2020 & 2033
- Table 53: Global Strength Training Equipment Revenue billion Forecast, by Country 2020 & 2033
- Table 54: Global Strength Training Equipment Volume Billion Forecast, by Country 2020 & 2033
- Table 55: China Strength Training Equipment Revenue (billion) Forecast, by Application 2020 & 2033
- Table 56: China Strength Training Equipment Volume (Billion) Forecast, by Application 2020 & 2033
- Table 57: Japan Strength Training Equipment Revenue (billion) Forecast, by Application 2020 & 2033
- Table 58: Japan Strength Training Equipment Volume (Billion) Forecast, by Application 2020 & 2033
- Table 59: South Korea Strength Training Equipment Revenue (billion) Forecast, by Application 2020 & 2033
- Table 60: South Korea Strength Training Equipment Volume (Billion) Forecast, by Application 2020 & 2033
- Table 61: Australia Strength Training Equipment Revenue (billion) Forecast, by Application 2020 & 2033
- Table 62: Australia Strength Training Equipment Volume (Billion) Forecast, by Application 2020 & 2033
- Table 63: Rest of Asia Pacific Strength Training Equipment Revenue (billion) Forecast, by Application 2020 & 2033
- Table 64: Rest of Asia Pacific Strength Training Equipment Volume (Billion) Forecast, by Application 2020 & 2033
- Table 65: Global Strength Training Equipment Revenue billion Forecast, by Product Type 2020 & 2033
- Table 66: Global Strength Training Equipment Volume Billion Forecast, by Product Type 2020 & 2033
- Table 67: Global Strength Training Equipment Revenue billion Forecast, by End User 2020 & 2033
- Table 68: Global Strength Training Equipment Volume Billion Forecast, by End User 2020 & 2033
- Table 69: Global Strength Training Equipment Revenue billion Forecast, by Distribution Channel 2020 & 2033
- Table 70: Global Strength Training Equipment Volume Billion Forecast, by Distribution Channel 2020 & 2033
- Table 71: Global Strength Training Equipment Revenue billion Forecast, by Country 2020 & 2033
- Table 72: Global Strength Training Equipment Volume Billion Forecast, by Country 2020 & 2033
- Table 73: South America Strength Training Equipment Revenue (billion) Forecast, by Application 2020 & 2033
- Table 74: South America Strength Training Equipment Volume (Billion) Forecast, by Application 2020 & 2033
- Table 75: Middle East Strength Training Equipment Revenue (billion) Forecast, by Application 2020 & 2033
- Table 76: Middle East Strength Training Equipment Volume (Billion) Forecast, by Application 2020 & 2033
Frequently Asked Questions
1. What is the projected Compound Annual Growth Rate (CAGR) of the Strength Training Equipment?
The projected CAGR is approximately 6.32%.
2. Which companies are prominent players in the Strength Training Equipment?
Key companies in the market include Life Fitness, Technogym SpA, Bowflex Inc, Johnson Health Tech Co, True Fitness Technology Inc, Origin Fitness Limited, Dyaco International Inc, Decathlon, IFIT Health And Fitness Inc, Body Solid Inc.
3. What are the main segments of the Strength Training Equipment?
The market segments include Product Type, End User, Distribution Channel.
4. Can you provide details about the market size?
The market size is estimated to be USD 12.88 billion as of 2022.
5. What are some drivers contributing to market growth?
Growing Influence of Healthy Lifestyles; Social Media Revolutionizing the Fitness Industry.
6. What are the notable trends driving market growth?
Strong demand for different types of weights from fitness-conscious consumers.
7. Are there any restraints impacting market growth?
Growing Influence of Healthy Lifestyles; Social Media Revolutionizing the Fitness Industry.
8. Can you provide examples of recent developments in the market?
In March 2023, Life Fitness introduced the latest generation cardio, strength, and digital product innovations, The company’s product innovations include the Life Fitness Insignia lines and the Hammer Strength HD Plate and Plate Loaded machines.
9. What pricing options are available for accessing the report?
Pricing options include single-user, multi-user, and enterprise licenses priced at USD 4750, USD 5250, and USD 8750 respectively.
10. Is the market size provided in terms of value or volume?
The market size is provided in terms of value, measured in billion and volume, measured in Billion.
11. Are there any specific market keywords associated with the report?
Yes, the market keyword associated with the report is "Strength Training Equipment," which aids in identifying and referencing the specific market segment covered.
12. How do I determine which pricing option suits my needs best?
The pricing options vary based on user requirements and access needs. Individual users may opt for single-user licenses, while businesses requiring broader access may choose multi-user or enterprise licenses for cost-effective access to the report.
13. Are there any additional resources or data provided in the Strength Training Equipment report?
While the report offers comprehensive insights, it's advisable to review the specific contents or supplementary materials provided to ascertain if additional resources or data are available.
14. How can I stay updated on further developments or reports in the Strength Training Equipment?
To stay informed about further developments, trends, and reports in the Strength Training Equipment, consider subscribing to industry newsletters, following relevant companies and organizations, or regularly checking reputable industry news sources and publications.
Methodology
Step 1 - Identification of Relevant Samples Size from Population Database


Step 2 - Approaches for Defining Global Market Size (Value, Volume* & Price*)

Note*: In applicable scenarios
Step 3 - Data Sources
Primary Research
- Web Analytics
- Survey Reports
- Research Institute
- Latest Research Reports
- Opinion Leaders
Secondary Research
- Annual Reports
- White Paper
- Latest Press Release
- Industry Association
- Paid Database
- Investor Presentations

Step 4 - Data Triangulation
Involves using different sources of information in order to increase the validity of a study
These sources are likely to be stakeholders in a program - participants, other researchers, program staff, other community members, and so on.
Then we put all data in single framework & apply various statistical tools to find out the dynamic on the market.
During the analysis stage, feedback from the stakeholder groups would be compared to determine areas of agreement as well as areas of divergence