

Key Insights
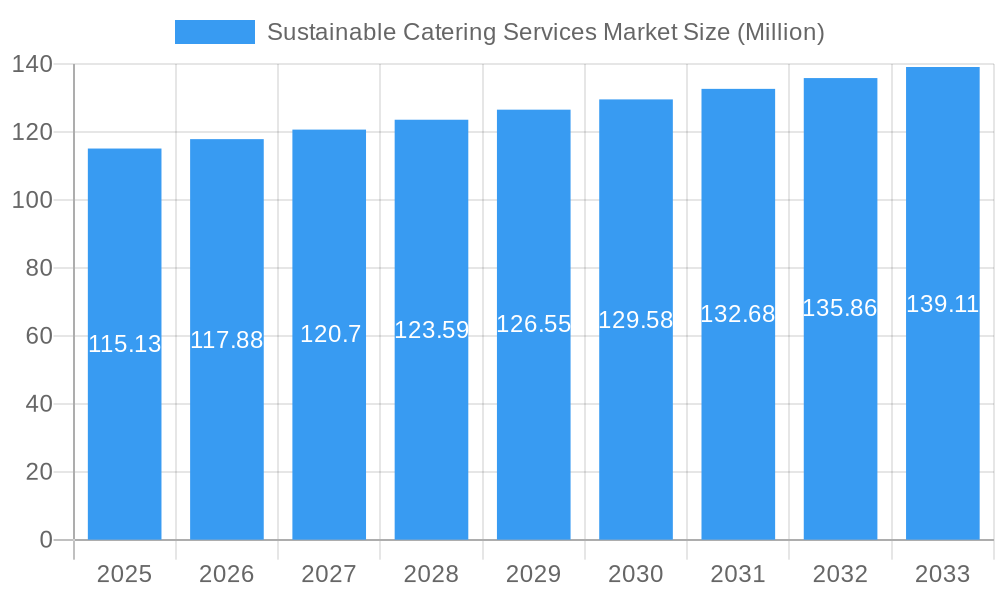
The global sustainable catering services market, valued at $115.13 million in 2025, is projected to experience steady growth, driven by increasing consumer demand for eco-friendly food options and a rising awareness of environmental and social responsibility within the hospitality and corporate sectors. A Compound Annual Growth Rate (CAGR) of 2.33% from 2025 to 2033 indicates a market poised for consistent expansion, although this moderate growth reflects the already established nature of the catering industry. Key drivers include the growing popularity of plant-based diets, the increasing adoption of sustainable sourcing practices by catering companies (e.g., locally sourced ingredients, reduced food waste initiatives), and a surge in demand for eco-conscious event planning. This trend is particularly pronounced in developed regions such as North America and Europe, where consumer awareness and disposable incomes are higher. The market segmentation reveals strong potential within contractual catering (particularly for corporate and educational clients), reflecting the cost-effectiveness and convenience of long-term sustainable food service partnerships. The wedding and social events segment also presents opportunities for growth, fueled by environmentally conscious couples seeking sustainable options for their celebrations.
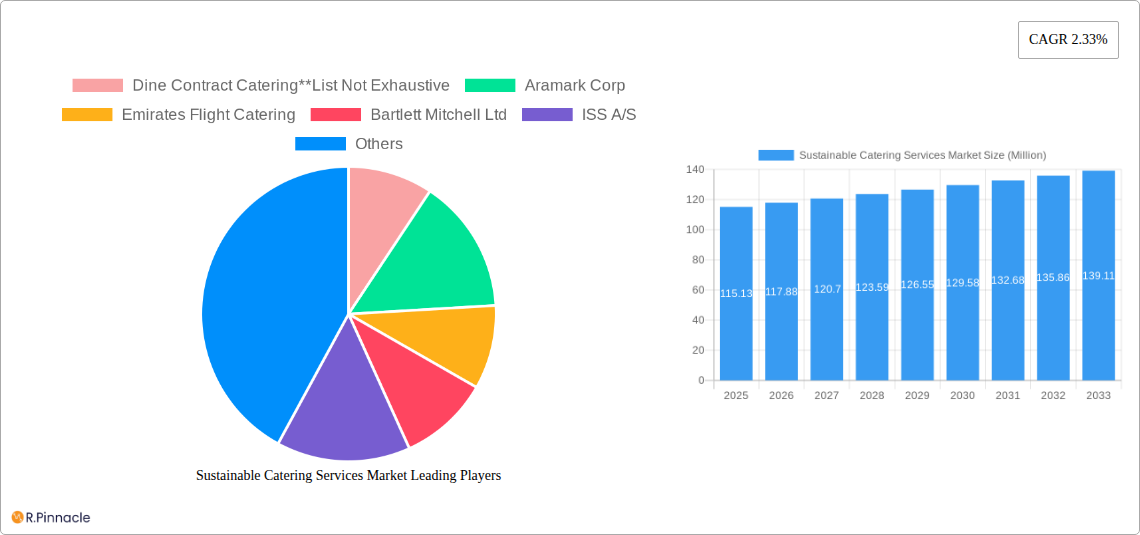
Sustainable Catering Services Market Market Size (In Million)
However, the market faces certain challenges. High initial investment costs associated with implementing sustainable practices, such as sourcing organic ingredients or adopting energy-efficient equipment, may pose a barrier to entry for some smaller catering businesses. Fluctuating food prices and supply chain disruptions also represent potential constraints on market growth. Furthermore, the lack of standardized sustainability certifications and guidelines across the industry can make it difficult for consumers to identify genuinely sustainable catering services. Overcoming these challenges requires collaboration between catering companies, food suppliers, and regulatory bodies to establish clear standards and promote greater transparency throughout the supply chain. This will, in turn, fuel further market expansion and enhance consumer confidence in the sustainable catering sector.
Sustainable Catering Services Market Company Market Share
Sustainable Catering Services Market Report: 2019-2033
This comprehensive report provides an in-depth analysis of the Sustainable Catering Services Market, offering valuable insights for industry professionals, investors, and strategists. Covering the period 2019-2033, with a base year of 2025 and a forecast period of 2025-2033, this report unveils the market's structure, dynamics, dominant segments, and key players. Discover actionable intelligence to navigate the evolving landscape of sustainable catering and capitalize on emerging opportunities.
Sustainable Catering Services Market Structure & Innovation Trends
This section analyzes the competitive landscape of the sustainable catering market, examining market concentration, innovation drivers, regulatory frameworks, and significant M&A activities. The market is characterized by a mix of large multinational corporations and smaller, specialized caterers. Market share data reveals a moderately concentrated market, with the top 5 players accounting for approximately xx% of the total revenue in 2024.
- Market Concentration: Moderate, with top 5 players holding xx% market share (2024).
- Innovation Drivers: Growing consumer demand for sustainable and ethically sourced food, increasing regulatory pressures for environmental responsibility, and technological advancements in food production and waste management.
- Regulatory Frameworks: Vary across regions, influencing the adoption of sustainable practices and impacting operational costs. Stringent regulations in certain countries are driving innovation in waste reduction and sustainable sourcing.
- Product Substitutes: Limited direct substitutes exist; however, competition comes from traditional catering services that are not focused on sustainability. The rise of meal-kit delivery services also represents indirect competition.
- End-User Demographics: A diverse range of end-users, including individuals, corporations, educational institutions, healthcare facilities, and the hospitality industry, are driving demand for sustainable catering services.
- M&A Activities: Significant M&A activity has shaped the market landscape. For instance, Compass Group PLC's acquisition of CH&CO for USD 600 Million in January 2024 signifies a strategic move towards strengthening its position in the premium sustainable catering segment. Further, Aramark's partnership with Bean Sprouts in May 2023 highlights the focus on expanding into healthy and sustainable options within the market. The total value of M&A deals in the sustainable catering sector between 2019 and 2024 is estimated at xx Million.
Sustainable Catering Services Market Dynamics & Trends
This section explores the key drivers influencing the growth of the sustainable catering services market. The market is experiencing robust growth fueled by increasing consumer awareness of environmental issues, rising demand for healthy and ethical food options, and the growing adoption of sustainable practices across various sectors.
The market is projected to witness a Compound Annual Growth Rate (CAGR) of xx% during the forecast period (2025-2033). This growth is driven by several factors, including:
- Increasing Consumer Demand for Sustainability: Consumers are increasingly conscious of the environmental and social impact of their food choices. This shift in preference is a major driver for the growth of sustainable catering services.
- Technological Disruptions: Advancements in food technology, such as vertical farming and precision agriculture, are improving the efficiency and sustainability of food production, positively impacting the market.
- Government Regulations and Incentives: Government regulations and incentives aimed at promoting sustainable practices are also boosting the adoption of sustainable catering services.
- Competitive Dynamics: The market is highly competitive, with established players and new entrants vying for market share. This competition is driving innovation and improving the quality of sustainable catering services.
- Market Penetration: The market penetration of sustainable catering services is expected to increase significantly in the coming years. The growth rate is anticipated to increase due to increased consumer preference toward sustainable products and services.
Dominant Regions & Segments in Sustainable Catering Services Market
This section delves into the prevailing regions and key segments shaping the sustainable catering services market. Market leadership is nuanced, varying across geographical areas and service categories. This variation is intrinsically linked to a confluence of factors, including the maturity of regional economies, evolving consumer attitudes towards sustainability, and the presence and enforcement of pertinent regulatory frameworks. Understanding these dynamics is paramount for identifying high-potential growth areas and tailoring strategies to specific market conditions.
-
By Service Type: Contractual catering services currently command the largest market share, a testament to the sustained and predictable demand emanating from corporate clients, educational institutions, and healthcare facilities. The recurring nature of these agreements provides a stable revenue stream. Concurrently, non-contractual services are witnessing an upward trajectory, propelled by the burgeoning popularity of bespoke and sustainable event planning, where flexibility and specialized eco-conscious offerings are highly valued.
-
By Event Type: Corporate events represent a substantial portion of the market's revenue. This is closely followed by weddings and other social gatherings, underscoring the broad applicability and increasing integration of sustainable catering practices across a diverse spectrum of occasions, from formal business functions to personal celebrations.
-
By End-User: The hospitality sector stands out as a primary engine for market expansion, driven by its commitment to enhancing guest experiences and brand reputation through sustainable practices. Following closely are the corporate and educational sectors, which are increasingly embedding sustainability into their operational ethos. The in-flight catering segment, while presenting a more specialized market with unique logistical and environmental challenges, also holds significant potential for sustainable innovation and adoption.
-
Key Influencing Factors:
- Supportive Economic Policies: Proactive government incentives and policies championing sustainable practices can significantly catalyze market growth and adoption within specific regions, fostering a more favorable business environment.
- Robust Infrastructure: The availability of advanced waste management systems and dependable supply chains for locally sourced, sustainable ingredients are critical enablers for scaling sustainable catering operations and ensuring their efficacy.
- Evolving Consumer Preferences: The growing consumer demand for ethically produced, environmentally conscious, and locally sourced food options is a powerful market determinant, influencing the strategies and offerings of catering services across different demographics and geographical locations.
Sustainable Catering Services Market Product Innovations
The sustainable catering market is witnessing significant product innovations, focusing on reducing food waste, optimizing energy consumption, and utilizing eco-friendly packaging. Technological advancements are driving the development of innovative food preservation techniques, efficient delivery systems, and compostable packaging solutions. These innovations cater to the increasing demand for sustainable and convenient catering services, offering competitive advantages to businesses that prioritize environmental responsibility.
Report Scope & Segmentation Analysis
This comprehensive report meticulously dissects the sustainable catering services market, providing an in-depth analysis across a range of granular segments. Our scope encompasses a detailed examination of market dynamics, growth potentials, and competitive landscapes within each defined category, offering actionable insights for stakeholders.
-
By Service Type: The market is segmented into Contractual, Non-Contractual, and Other Catering Services. Contractual catering services are characterized by consistent and predictable growth due to established long-term agreements with institutional and corporate clients. Non-contractual services, while exhibiting more variable growth patterns influenced by event seasonality and demand fluctuations, are expanding as event planners seek flexible and specialized sustainable solutions. The 'Other Catering Services' category represents a smaller but developing niche.
-
By Event Type: Our analysis covers Corporate, Wedding, Social, and Other Events. Corporate events represent the largest segment in terms of market size, reflecting the significant integration of sustainable practices in business functions. Weddings and social events also contribute substantially to market revenue, indicating a growing desire for eco-conscious celebrations.
-
By End-User: The segmentation includes Individuals, Hospitality, Educational, Healthcare, In-Flight, and Other End Users. The hospitality sector consistently demonstrates high demand for sustainable catering, driven by its emphasis on brand image and exceptional customer experiences. The educational, healthcare, and corporate segments are experiencing notable growth as environmental consciousness and corporate social responsibility increasingly influence procurement decisions within these organizations.
For each identified segment, this report provides detailed projections on growth trajectories, an assessment of current market size, and an analysis of the competitive forces at play, thereby equipping readers with a holistic understanding of the sustainable catering landscape.
Key Drivers of Sustainable Catering Services Market Growth
The sustainable catering services market is experiencing robust expansion, propelled by a confluence of significant driving forces. A primary catalyst is the escalating awareness among consumers and businesses regarding the critical environmental impact of food consumption and waste. This heightened consciousness translates directly into a greater demand for catering options that prioritize eco-friendly sourcing, reduced waste, and energy efficiency. Furthermore, increasingly stringent governmental regulations and policies aimed at promoting sustainability across various industries are compelling businesses to adopt more responsible catering practices, often through incentives and mandates. Technological advancements in areas such as vertical farming, intelligent food waste management systems, and the development of plant-based alternatives are also playing a crucial role in making sustainable catering more viable and cost-effective. Complementing these factors, a growing emphasis on corporate social responsibility (CSR) initiatives is motivating many organizations to integrate sustainable catering into their event planning and daily operations as a demonstrable commitment to environmental stewardship and ethical business practices.
Challenges in the Sustainable Catering Services Market Sector
Despite significant growth potential, the sustainable catering services market faces challenges. The high cost of sustainable ingredients and eco-friendly packaging can increase operational expenses, limiting market penetration. Establishing reliable and transparent supply chains for sustainably sourced products is another challenge. Fluctuating demand and seasonality, particularly for non-contractual services, can also impact profitability. Finally, navigating diverse and often fragmented regulatory frameworks across different regions adds to the complexity of operating sustainably.
Emerging Opportunities in Sustainable Catering Services Market
The sustainable catering market presents significant emerging opportunities. Growing consumer interest in plant-based diets and reduced meat consumption offers opportunities to develop innovative, sustainable plant-based catering menus. The integration of technology, including AI-powered inventory management and waste reduction solutions, can improve operational efficiency and sustainability. Furthermore, expanding into niche markets, such as sustainable corporate catering for remote workforces, presents significant growth potential. Developing robust traceability and certification programs to assure customers of the sustainability of products enhances trust and brand image.
Leading Players in the Sustainable Catering Services Market Market
- Dine Contract Catering
- Aramark Corp
- Emirates Flight Catering
- Bartlett Mitchell Ltd
- ISS A/S
- Elior Group
- Entier Limited
- Compass Group PLC
- DO & CO Aktiengesellschaft
- CH and Co Catering Group Ltd
Key Developments in Sustainable Catering Services Market Industry
- January 2024: Compass Group PLC acquired CH&CO for USD 600 Million, consolidating its position in the premium sustainable catering market.
- May 2023: Aramark partnered with Bean Sprouts, expanding its offerings in the healthy and sustainable children's food segment.
Future Outlook for Sustainable Catering Services Market Market
The sustainable catering services market is poised for continued growth driven by persistent consumer demand for sustainable and healthy food options. Strategic partnerships, technological advancements, and expansion into new markets will be key factors influencing future market dynamics. The market is expected to witness increased consolidation through mergers and acquisitions, resulting in larger, more integrated players focusing on enhanced sustainability and technological integration within their operations. The long-term outlook remains positive, indicating a significant growth trajectory for the sustainable catering services sector.
Sustainable Catering Services Market Segmentation
-
1. Service Type
- 1.1. Contractual Catering Services
- 1.2. Non-Contractual Catering Services
- 1.3. Other Catering Services
-
2. Event Type
- 2.1. Corporate
- 2.2. Wedding
- 2.3. Social Events
- 2.4. Others
-
3. End-User
- 3.1. Individuals
- 3.2. Hospitality
- 3.3. Educational
- 3.4. Healthcare
- 3.5. In-Flight
- 3.6. Other End Users
- 4. Geography
-
5. North America
- 5.1. United States
- 5.2. Canada
- 5.3. Mexico
- 5.4. Rest of North America
-
6. Europe
- 6.1. United Kingdom
- 6.2. Germany
- 6.3. France
- 6.4. Russia
- 6.5. Italy
- 6.6. Spain
- 6.7. Rest of Europe
-
7. Asia-Pacific
- 7.1. India
- 7.2. China
- 7.3. Japan
- 7.4. Australia
- 7.5. Rest of Asia-Pacific
-
8. South America
- 8.1. Brazil
- 8.2. Argentina
- 8.3. Rest of South America
-
9. Middle-East and Africa
- 9.1. United Arab Emirates
- 9.2. South Africa
- 9.3. Rest of Middle-East and Africa
Sustainable Catering Services Market Segmentation By Geography
-
1. North America
- 1.1. United States
- 1.2. Canada
- 1.3. Mexico
-
2. South America
- 2.1. Brazil
- 2.2. Argentina
- 2.3. Rest of South America
-
3. Europe
- 3.1. United Kingdom
- 3.2. Germany
- 3.3. France
- 3.4. Italy
- 3.5. Spain
- 3.6. Russia
- 3.7. Benelux
- 3.8. Nordics
- 3.9. Rest of Europe
-
4. Middle East & Africa
- 4.1. Turkey
- 4.2. Israel
- 4.3. GCC
- 4.4. North Africa
- 4.5. South Africa
- 4.6. Rest of Middle East & Africa
-
5. Asia Pacific
- 5.1. China
- 5.2. India
- 5.3. Japan
- 5.4. South Korea
- 5.5. ASEAN
- 5.6. Oceania
- 5.7. Rest of Asia Pacific
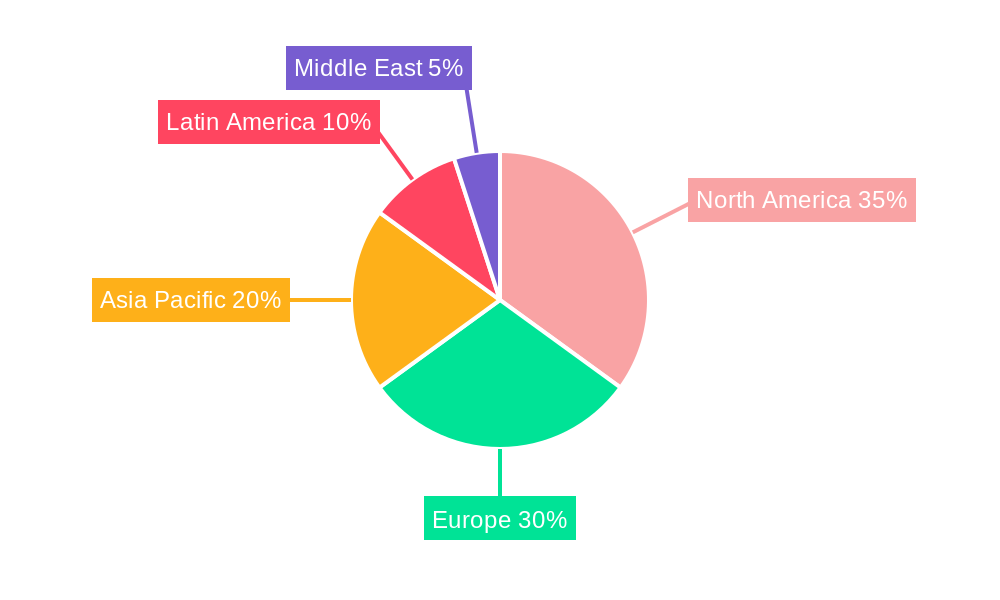
Sustainable Catering Services Market Regional Market Share
Geographic Coverage of Sustainable Catering Services Market
Sustainable Catering Services Market REPORT HIGHLIGHTS
| Aspects | Details |
|---|---|
| Study Period | 2020-2034 |
| Base Year | 2025 |
| Estimated Year | 2026 |
| Forecast Period | 2026-2034 |
| Historical Period | 2020-2025 |
| Growth Rate | CAGR of 2.33% from 2020-2034 |
| Segmentation |
|
Table of Contents
- 1. Introduction
- 1.1. Research Scope
- 1.2. Market Segmentation
- 1.3. Research Objective
- 1.4. Definitions and Assumptions
- 2. Executive Summary
- 2.1. Market Snapshot
- 3. Market Dynamics
- 3.1. Market Drivers
- 3.2. Market Restrains
- 3.3. Market Trends
- 3.4. Market Opportunities
- 4. Market Factor Analysis
- 4.1. Porters Five Forces
- 4.1.1. Bargaining Power of Suppliers
- 4.1.2. Bargaining Power of Buyers
- 4.1.3. Threat of New Entrants
- 4.1.4. Threat of Substitutes
- 4.1.5. Competitive Rivalry
- 4.2. PESTEL analysis
- 4.3. BCG Analysis
- 4.3.1. Stars (High Growth, High Market Share)
- 4.3.2. Cash Cows (Low Growth, High Market Share)
- 4.3.3. Question Mark (High Growth, Low Market Share)
- 4.3.4. Dogs (Low Growth, Low Market Share)
- 4.4. Ansoff Matrix Analysis
- 4.5. Supply Chain Analysis
- 4.6. Regulatory Landscape
- 4.7. Current Market Potential and Opportunity Assessment (TAM–SAM–SOM Framework)
- 4.8. PRI Analyst Note
- 4.1. Porters Five Forces
- 5. Market Analysis, Insights and Forecast 2021-2033
- 5.1. Market Analysis, Insights and Forecast - by Service Type
- 5.1.1. Contractual Catering Services
- 5.1.2. Non-Contractual Catering Services
- 5.1.3. Other Catering Services
- 5.2. Market Analysis, Insights and Forecast - by Event Type
- 5.2.1. Corporate
- 5.2.2. Wedding
- 5.2.3. Social Events
- 5.2.4. Others
- 5.3. Market Analysis, Insights and Forecast - by End-User
- 5.3.1. Individuals
- 5.3.2. Hospitality
- 5.3.3. Educational
- 5.3.4. Healthcare
- 5.3.5. In-Flight
- 5.3.6. Other End Users
- 5.4. Market Analysis, Insights and Forecast - by Geography
- 5.5. Market Analysis, Insights and Forecast - by North America
- 5.5.1. United States
- 5.5.2. Canada
- 5.5.3. Mexico
- 5.5.4. Rest of North America
- 5.6. Market Analysis, Insights and Forecast - by Europe
- 5.6.1. United Kingdom
- 5.6.2. Germany
- 5.6.3. France
- 5.6.4. Russia
- 5.6.5. Italy
- 5.6.6. Spain
- 5.6.7. Rest of Europe
- 5.7. Market Analysis, Insights and Forecast - by Asia-Pacific
- 5.7.1. India
- 5.7.2. China
- 5.7.3. Japan
- 5.7.4. Australia
- 5.7.5. Rest of Asia-Pacific
- 5.8. Market Analysis, Insights and Forecast - by South America
- 5.8.1. Brazil
- 5.8.2. Argentina
- 5.8.3. Rest of South America
- 5.9. Market Analysis, Insights and Forecast - by Middle-East and Africa
- 5.9.1. United Arab Emirates
- 5.9.2. South Africa
- 5.9.3. Rest of Middle-East and Africa
- 5.10. Market Analysis, Insights and Forecast - by Region
- 5.10.1. North America
- 5.10.2. South America
- 5.10.3. Europe
- 5.10.4. Middle East & Africa
- 5.10.5. Asia Pacific
- 5.1. Market Analysis, Insights and Forecast - by Service Type
- 6. Global Sustainable Catering Services Market Analysis, Insights and Forecast, 2021-2033
- 6.1. Market Analysis, Insights and Forecast - by Service Type
- 6.1.1. Contractual Catering Services
- 6.1.2. Non-Contractual Catering Services
- 6.1.3. Other Catering Services
- 6.2. Market Analysis, Insights and Forecast - by Event Type
- 6.2.1. Corporate
- 6.2.2. Wedding
- 6.2.3. Social Events
- 6.2.4. Others
- 6.3. Market Analysis, Insights and Forecast - by End-User
- 6.3.1. Individuals
- 6.3.2. Hospitality
- 6.3.3. Educational
- 6.3.4. Healthcare
- 6.3.5. In-Flight
- 6.3.6. Other End Users
- 6.4. Market Analysis, Insights and Forecast - by Geography
- 6.5. Market Analysis, Insights and Forecast - by North America
- 6.5.1. United States
- 6.5.2. Canada
- 6.5.3. Mexico
- 6.5.4. Rest of North America
- 6.6. Market Analysis, Insights and Forecast - by Europe
- 6.6.1. United Kingdom
- 6.6.2. Germany
- 6.6.3. France
- 6.6.4. Russia
- 6.6.5. Italy
- 6.6.6. Spain
- 6.6.7. Rest of Europe
- 6.7. Market Analysis, Insights and Forecast - by Asia-Pacific
- 6.7.1. India
- 6.7.2. China
- 6.7.3. Japan
- 6.7.4. Australia
- 6.7.5. Rest of Asia-Pacific
- 6.8. Market Analysis, Insights and Forecast - by South America
- 6.8.1. Brazil
- 6.8.2. Argentina
- 6.8.3. Rest of South America
- 6.9. Market Analysis, Insights and Forecast - by Middle-East and Africa
- 6.9.1. United Arab Emirates
- 6.9.2. South Africa
- 6.9.3. Rest of Middle-East and Africa
- 6.1. Market Analysis, Insights and Forecast - by Service Type
- 7. North America Sustainable Catering Services Market Analysis, Insights and Forecast, 2020-2032
- 7.1. Market Analysis, Insights and Forecast - by Service Type
- 7.1.1. Contractual Catering Services
- 7.1.2. Non-Contractual Catering Services
- 7.1.3. Other Catering Services
- 7.2. Market Analysis, Insights and Forecast - by Event Type
- 7.2.1. Corporate
- 7.2.2. Wedding
- 7.2.3. Social Events
- 7.2.4. Others
- 7.3. Market Analysis, Insights and Forecast - by End-User
- 7.3.1. Individuals
- 7.3.2. Hospitality
- 7.3.3. Educational
- 7.3.4. Healthcare
- 7.3.5. In-Flight
- 7.3.6. Other End Users
- 7.4. Market Analysis, Insights and Forecast - by Geography
- 7.5. Market Analysis, Insights and Forecast - by North America
- 7.5.1. United States
- 7.5.2. Canada
- 7.5.3. Mexico
- 7.5.4. Rest of North America
- 7.6. Market Analysis, Insights and Forecast - by Europe
- 7.6.1. United Kingdom
- 7.6.2. Germany
- 7.6.3. France
- 7.6.4. Russia
- 7.6.5. Italy
- 7.6.6. Spain
- 7.6.7. Rest of Europe
- 7.7. Market Analysis, Insights and Forecast - by Asia-Pacific
- 7.7.1. India
- 7.7.2. China
- 7.7.3. Japan
- 7.7.4. Australia
- 7.7.5. Rest of Asia-Pacific
- 7.8. Market Analysis, Insights and Forecast - by South America
- 7.8.1. Brazil
- 7.8.2. Argentina
- 7.8.3. Rest of South America
- 7.9. Market Analysis, Insights and Forecast - by Middle-East and Africa
- 7.9.1. United Arab Emirates
- 7.9.2. South Africa
- 7.9.3. Rest of Middle-East and Africa
- 7.1. Market Analysis, Insights and Forecast - by Service Type
- 8. South America Sustainable Catering Services Market Analysis, Insights and Forecast, 2020-2032
- 8.1. Market Analysis, Insights and Forecast - by Service Type
- 8.1.1. Contractual Catering Services
- 8.1.2. Non-Contractual Catering Services
- 8.1.3. Other Catering Services
- 8.2. Market Analysis, Insights and Forecast - by Event Type
- 8.2.1. Corporate
- 8.2.2. Wedding
- 8.2.3. Social Events
- 8.2.4. Others
- 8.3. Market Analysis, Insights and Forecast - by End-User
- 8.3.1. Individuals
- 8.3.2. Hospitality
- 8.3.3. Educational
- 8.3.4. Healthcare
- 8.3.5. In-Flight
- 8.3.6. Other End Users
- 8.4. Market Analysis, Insights and Forecast - by Geography
- 8.5. Market Analysis, Insights and Forecast - by North America
- 8.5.1. United States
- 8.5.2. Canada
- 8.5.3. Mexico
- 8.5.4. Rest of North America
- 8.6. Market Analysis, Insights and Forecast - by Europe
- 8.6.1. United Kingdom
- 8.6.2. Germany
- 8.6.3. France
- 8.6.4. Russia
- 8.6.5. Italy
- 8.6.6. Spain
- 8.6.7. Rest of Europe
- 8.7. Market Analysis, Insights and Forecast - by Asia-Pacific
- 8.7.1. India
- 8.7.2. China
- 8.7.3. Japan
- 8.7.4. Australia
- 8.7.5. Rest of Asia-Pacific
- 8.8. Market Analysis, Insights and Forecast - by South America
- 8.8.1. Brazil
- 8.8.2. Argentina
- 8.8.3. Rest of South America
- 8.9. Market Analysis, Insights and Forecast - by Middle-East and Africa
- 8.9.1. United Arab Emirates
- 8.9.2. South Africa
- 8.9.3. Rest of Middle-East and Africa
- 8.1. Market Analysis, Insights and Forecast - by Service Type
- 9. Europe Sustainable Catering Services Market Analysis, Insights and Forecast, 2020-2032
- 9.1. Market Analysis, Insights and Forecast - by Service Type
- 9.1.1. Contractual Catering Services
- 9.1.2. Non-Contractual Catering Services
- 9.1.3. Other Catering Services
- 9.2. Market Analysis, Insights and Forecast - by Event Type
- 9.2.1. Corporate
- 9.2.2. Wedding
- 9.2.3. Social Events
- 9.2.4. Others
- 9.3. Market Analysis, Insights and Forecast - by End-User
- 9.3.1. Individuals
- 9.3.2. Hospitality
- 9.3.3. Educational
- 9.3.4. Healthcare
- 9.3.5. In-Flight
- 9.3.6. Other End Users
- 9.4. Market Analysis, Insights and Forecast - by Geography
- 9.5. Market Analysis, Insights and Forecast - by North America
- 9.5.1. United States
- 9.5.2. Canada
- 9.5.3. Mexico
- 9.5.4. Rest of North America
- 9.6. Market Analysis, Insights and Forecast - by Europe
- 9.6.1. United Kingdom
- 9.6.2. Germany
- 9.6.3. France
- 9.6.4. Russia
- 9.6.5. Italy
- 9.6.6. Spain
- 9.6.7. Rest of Europe
- 9.7. Market Analysis, Insights and Forecast - by Asia-Pacific
- 9.7.1. India
- 9.7.2. China
- 9.7.3. Japan
- 9.7.4. Australia
- 9.7.5. Rest of Asia-Pacific
- 9.8. Market Analysis, Insights and Forecast - by South America
- 9.8.1. Brazil
- 9.8.2. Argentina
- 9.8.3. Rest of South America
- 9.9. Market Analysis, Insights and Forecast - by Middle-East and Africa
- 9.9.1. United Arab Emirates
- 9.9.2. South Africa
- 9.9.3. Rest of Middle-East and Africa
- 9.1. Market Analysis, Insights and Forecast - by Service Type
- 10. Middle East & Africa Sustainable Catering Services Market Analysis, Insights and Forecast, 2020-2032
- 10.1. Market Analysis, Insights and Forecast - by Service Type
- 10.1.1. Contractual Catering Services
- 10.1.2. Non-Contractual Catering Services
- 10.1.3. Other Catering Services
- 10.2. Market Analysis, Insights and Forecast - by Event Type
- 10.2.1. Corporate
- 10.2.2. Wedding
- 10.2.3. Social Events
- 10.2.4. Others
- 10.3. Market Analysis, Insights and Forecast - by End-User
- 10.3.1. Individuals
- 10.3.2. Hospitality
- 10.3.3. Educational
- 10.3.4. Healthcare
- 10.3.5. In-Flight
- 10.3.6. Other End Users
- 10.4. Market Analysis, Insights and Forecast - by Geography
- 10.5. Market Analysis, Insights and Forecast - by North America
- 10.5.1. United States
- 10.5.2. Canada
- 10.5.3. Mexico
- 10.5.4. Rest of North America
- 10.6. Market Analysis, Insights and Forecast - by Europe
- 10.6.1. United Kingdom
- 10.6.2. Germany
- 10.6.3. France
- 10.6.4. Russia
- 10.6.5. Italy
- 10.6.6. Spain
- 10.6.7. Rest of Europe
- 10.7. Market Analysis, Insights and Forecast - by Asia-Pacific
- 10.7.1. India
- 10.7.2. China
- 10.7.3. Japan
- 10.7.4. Australia
- 10.7.5. Rest of Asia-Pacific
- 10.8. Market Analysis, Insights and Forecast - by South America
- 10.8.1. Brazil
- 10.8.2. Argentina
- 10.8.3. Rest of South America
- 10.9. Market Analysis, Insights and Forecast - by Middle-East and Africa
- 10.9.1. United Arab Emirates
- 10.9.2. South Africa
- 10.9.3. Rest of Middle-East and Africa
- 10.1. Market Analysis, Insights and Forecast - by Service Type
- 11. Asia Pacific Sustainable Catering Services Market Analysis, Insights and Forecast, 2020-2032
- 11.1. Market Analysis, Insights and Forecast - by Service Type
- 11.1.1. Contractual Catering Services
- 11.1.2. Non-Contractual Catering Services
- 11.1.3. Other Catering Services
- 11.2. Market Analysis, Insights and Forecast - by Event Type
- 11.2.1. Corporate
- 11.2.2. Wedding
- 11.2.3. Social Events
- 11.2.4. Others
- 11.3. Market Analysis, Insights and Forecast - by End-User
- 11.3.1. Individuals
- 11.3.2. Hospitality
- 11.3.3. Educational
- 11.3.4. Healthcare
- 11.3.5. In-Flight
- 11.3.6. Other End Users
- 11.4. Market Analysis, Insights and Forecast - by Geography
- 11.5. Market Analysis, Insights and Forecast - by North America
- 11.5.1. United States
- 11.5.2. Canada
- 11.5.3. Mexico
- 11.5.4. Rest of North America
- 11.6. Market Analysis, Insights and Forecast - by Europe
- 11.6.1. United Kingdom
- 11.6.2. Germany
- 11.6.3. France
- 11.6.4. Russia
- 11.6.5. Italy
- 11.6.6. Spain
- 11.6.7. Rest of Europe
- 11.7. Market Analysis, Insights and Forecast - by Asia-Pacific
- 11.7.1. India
- 11.7.2. China
- 11.7.3. Japan
- 11.7.4. Australia
- 11.7.5. Rest of Asia-Pacific
- 11.8. Market Analysis, Insights and Forecast - by South America
- 11.8.1. Brazil
- 11.8.2. Argentina
- 11.8.3. Rest of South America
- 11.9. Market Analysis, Insights and Forecast - by Middle-East and Africa
- 11.9.1. United Arab Emirates
- 11.9.2. South Africa
- 11.9.3. Rest of Middle-East and Africa
- 11.1. Market Analysis, Insights and Forecast - by Service Type
- 12. Competitive Analysis
- 12.1. Company Profiles
- 12.1.1 Dine Contract Catering**List Not Exhaustive
- 12.1.1.1. Company Overview
- 12.1.1.2. Products
- 12.1.1.3. Company Financials
- 12.1.1.4. SWOT Analysis
- 12.1.2 Aramark Corp
- 12.1.2.1. Company Overview
- 12.1.2.2. Products
- 12.1.2.3. Company Financials
- 12.1.2.4. SWOT Analysis
- 12.1.3 Emirates Flight Catering
- 12.1.3.1. Company Overview
- 12.1.3.2. Products
- 12.1.3.3. Company Financials
- 12.1.3.4. SWOT Analysis
- 12.1.4 Bartlett Mitchell Ltd
- 12.1.4.1. Company Overview
- 12.1.4.2. Products
- 12.1.4.3. Company Financials
- 12.1.4.4. SWOT Analysis
- 12.1.5 ISS A/S
- 12.1.5.1. Company Overview
- 12.1.5.2. Products
- 12.1.5.3. Company Financials
- 12.1.5.4. SWOT Analysis
- 12.1.6 Elior Group
- 12.1.6.1. Company Overview
- 12.1.6.2. Products
- 12.1.6.3. Company Financials
- 12.1.6.4. SWOT Analysis
- 12.1.7 Entier Limited
- 12.1.7.1. Company Overview
- 12.1.7.2. Products
- 12.1.7.3. Company Financials
- 12.1.7.4. SWOT Analysis
- 12.1.8 Compass Group PLC
- 12.1.8.1. Company Overview
- 12.1.8.2. Products
- 12.1.8.3. Company Financials
- 12.1.8.4. SWOT Analysis
- 12.1.9 DO & CO Aktiengesellschaft
- 12.1.9.1. Company Overview
- 12.1.9.2. Products
- 12.1.9.3. Company Financials
- 12.1.9.4. SWOT Analysis
- 12.1.10 CH and Co Catering Group Ltd
- 12.1.10.1. Company Overview
- 12.1.10.2. Products
- 12.1.10.3. Company Financials
- 12.1.10.4. SWOT Analysis
- 12.1.1 Dine Contract Catering**List Not Exhaustive
- 12.2. Market Entropy
- 12.2.1 Company's Key Areas Served
- 12.2.2 Recent Developments
- 12.3. Company Market Share Analysis 2025
- 12.3.1 Top 5 Companies Market Share Analysis
- 12.3.2 Top 3 Companies Market Share Analysis
- 12.4. List of Potential Customers
- 13. Research Methodology
List of Figures
- Figure 1: Global Sustainable Catering Services Market Revenue Breakdown (Million, %) by Region 2025 & 2033
- Figure 2: North America Sustainable Catering Services Market Revenue (Million), by Service Type 2025 & 2033
- Figure 3: North America Sustainable Catering Services Market Revenue Share (%), by Service Type 2025 & 2033
- Figure 4: North America Sustainable Catering Services Market Revenue (Million), by Event Type 2025 & 2033
- Figure 5: North America Sustainable Catering Services Market Revenue Share (%), by Event Type 2025 & 2033
- Figure 6: North America Sustainable Catering Services Market Revenue (Million), by End-User 2025 & 2033
- Figure 7: North America Sustainable Catering Services Market Revenue Share (%), by End-User 2025 & 2033
- Figure 8: North America Sustainable Catering Services Market Revenue (Million), by Geography 2025 & 2033
- Figure 9: North America Sustainable Catering Services Market Revenue Share (%), by Geography 2025 & 2033
- Figure 10: North America Sustainable Catering Services Market Revenue (Million), by North America 2025 & 2033
- Figure 11: North America Sustainable Catering Services Market Revenue Share (%), by North America 2025 & 2033
- Figure 12: North America Sustainable Catering Services Market Revenue (Million), by Europe 2025 & 2033
- Figure 13: North America Sustainable Catering Services Market Revenue Share (%), by Europe 2025 & 2033
- Figure 14: North America Sustainable Catering Services Market Revenue (Million), by Asia-Pacific 2025 & 2033
- Figure 15: North America Sustainable Catering Services Market Revenue Share (%), by Asia-Pacific 2025 & 2033
- Figure 16: North America Sustainable Catering Services Market Revenue (Million), by South America 2025 & 2033
- Figure 17: North America Sustainable Catering Services Market Revenue Share (%), by South America 2025 & 2033
- Figure 18: North America Sustainable Catering Services Market Revenue (Million), by Middle-East and Africa 2025 & 2033
- Figure 19: North America Sustainable Catering Services Market Revenue Share (%), by Middle-East and Africa 2025 & 2033
- Figure 20: North America Sustainable Catering Services Market Revenue (Million), by Country 2025 & 2033
- Figure 21: North America Sustainable Catering Services Market Revenue Share (%), by Country 2025 & 2033
- Figure 22: South America Sustainable Catering Services Market Revenue (Million), by Service Type 2025 & 2033
- Figure 23: South America Sustainable Catering Services Market Revenue Share (%), by Service Type 2025 & 2033
- Figure 24: South America Sustainable Catering Services Market Revenue (Million), by Event Type 2025 & 2033
- Figure 25: South America Sustainable Catering Services Market Revenue Share (%), by Event Type 2025 & 2033
- Figure 26: South America Sustainable Catering Services Market Revenue (Million), by End-User 2025 & 2033
- Figure 27: South America Sustainable Catering Services Market Revenue Share (%), by End-User 2025 & 2033
- Figure 28: South America Sustainable Catering Services Market Revenue (Million), by Geography 2025 & 2033
- Figure 29: South America Sustainable Catering Services Market Revenue Share (%), by Geography 2025 & 2033
- Figure 30: South America Sustainable Catering Services Market Revenue (Million), by North America 2025 & 2033
- Figure 31: South America Sustainable Catering Services Market Revenue Share (%), by North America 2025 & 2033
- Figure 32: South America Sustainable Catering Services Market Revenue (Million), by Europe 2025 & 2033
- Figure 33: South America Sustainable Catering Services Market Revenue Share (%), by Europe 2025 & 2033
- Figure 34: South America Sustainable Catering Services Market Revenue (Million), by Asia-Pacific 2025 & 2033
- Figure 35: South America Sustainable Catering Services Market Revenue Share (%), by Asia-Pacific 2025 & 2033
- Figure 36: South America Sustainable Catering Services Market Revenue (Million), by South America 2025 & 2033
- Figure 37: South America Sustainable Catering Services Market Revenue Share (%), by South America 2025 & 2033
- Figure 38: South America Sustainable Catering Services Market Revenue (Million), by Middle-East and Africa 2025 & 2033
- Figure 39: South America Sustainable Catering Services Market Revenue Share (%), by Middle-East and Africa 2025 & 2033
- Figure 40: South America Sustainable Catering Services Market Revenue (Million), by Country 2025 & 2033
- Figure 41: South America Sustainable Catering Services Market Revenue Share (%), by Country 2025 & 2033
- Figure 42: Europe Sustainable Catering Services Market Revenue (Million), by Service Type 2025 & 2033
- Figure 43: Europe Sustainable Catering Services Market Revenue Share (%), by Service Type 2025 & 2033
- Figure 44: Europe Sustainable Catering Services Market Revenue (Million), by Event Type 2025 & 2033
- Figure 45: Europe Sustainable Catering Services Market Revenue Share (%), by Event Type 2025 & 2033
- Figure 46: Europe Sustainable Catering Services Market Revenue (Million), by End-User 2025 & 2033
- Figure 47: Europe Sustainable Catering Services Market Revenue Share (%), by End-User 2025 & 2033
- Figure 48: Europe Sustainable Catering Services Market Revenue (Million), by Geography 2025 & 2033
- Figure 49: Europe Sustainable Catering Services Market Revenue Share (%), by Geography 2025 & 2033
- Figure 50: Europe Sustainable Catering Services Market Revenue (Million), by North America 2025 & 2033
- Figure 51: Europe Sustainable Catering Services Market Revenue Share (%), by North America 2025 & 2033
- Figure 52: Europe Sustainable Catering Services Market Revenue (Million), by Europe 2025 & 2033
- Figure 53: Europe Sustainable Catering Services Market Revenue Share (%), by Europe 2025 & 2033
- Figure 54: Europe Sustainable Catering Services Market Revenue (Million), by Asia-Pacific 2025 & 2033
- Figure 55: Europe Sustainable Catering Services Market Revenue Share (%), by Asia-Pacific 2025 & 2033
- Figure 56: Europe Sustainable Catering Services Market Revenue (Million), by South America 2025 & 2033
- Figure 57: Europe Sustainable Catering Services Market Revenue Share (%), by South America 2025 & 2033
- Figure 58: Europe Sustainable Catering Services Market Revenue (Million), by Middle-East and Africa 2025 & 2033
- Figure 59: Europe Sustainable Catering Services Market Revenue Share (%), by Middle-East and Africa 2025 & 2033
- Figure 60: Europe Sustainable Catering Services Market Revenue (Million), by Country 2025 & 2033
- Figure 61: Europe Sustainable Catering Services Market Revenue Share (%), by Country 2025 & 2033
- Figure 62: Middle East & Africa Sustainable Catering Services Market Revenue (Million), by Service Type 2025 & 2033
- Figure 63: Middle East & Africa Sustainable Catering Services Market Revenue Share (%), by Service Type 2025 & 2033
- Figure 64: Middle East & Africa Sustainable Catering Services Market Revenue (Million), by Event Type 2025 & 2033
- Figure 65: Middle East & Africa Sustainable Catering Services Market Revenue Share (%), by Event Type 2025 & 2033
- Figure 66: Middle East & Africa Sustainable Catering Services Market Revenue (Million), by End-User 2025 & 2033
- Figure 67: Middle East & Africa Sustainable Catering Services Market Revenue Share (%), by End-User 2025 & 2033
- Figure 68: Middle East & Africa Sustainable Catering Services Market Revenue (Million), by Geography 2025 & 2033
- Figure 69: Middle East & Africa Sustainable Catering Services Market Revenue Share (%), by Geography 2025 & 2033
- Figure 70: Middle East & Africa Sustainable Catering Services Market Revenue (Million), by North America 2025 & 2033
- Figure 71: Middle East & Africa Sustainable Catering Services Market Revenue Share (%), by North America 2025 & 2033
- Figure 72: Middle East & Africa Sustainable Catering Services Market Revenue (Million), by Europe 2025 & 2033
- Figure 73: Middle East & Africa Sustainable Catering Services Market Revenue Share (%), by Europe 2025 & 2033
- Figure 74: Middle East & Africa Sustainable Catering Services Market Revenue (Million), by Asia-Pacific 2025 & 2033
- Figure 75: Middle East & Africa Sustainable Catering Services Market Revenue Share (%), by Asia-Pacific 2025 & 2033
- Figure 76: Middle East & Africa Sustainable Catering Services Market Revenue (Million), by South America 2025 & 2033
- Figure 77: Middle East & Africa Sustainable Catering Services Market Revenue Share (%), by South America 2025 & 2033
- Figure 78: Middle East & Africa Sustainable Catering Services Market Revenue (Million), by Middle-East and Africa 2025 & 2033
- Figure 79: Middle East & Africa Sustainable Catering Services Market Revenue Share (%), by Middle-East and Africa 2025 & 2033
- Figure 80: Middle East & Africa Sustainable Catering Services Market Revenue (Million), by Country 2025 & 2033
- Figure 81: Middle East & Africa Sustainable Catering Services Market Revenue Share (%), by Country 2025 & 2033
- Figure 82: Asia Pacific Sustainable Catering Services Market Revenue (Million), by Service Type 2025 & 2033
- Figure 83: Asia Pacific Sustainable Catering Services Market Revenue Share (%), by Service Type 2025 & 2033
- Figure 84: Asia Pacific Sustainable Catering Services Market Revenue (Million), by Event Type 2025 & 2033
- Figure 85: Asia Pacific Sustainable Catering Services Market Revenue Share (%), by Event Type 2025 & 2033
- Figure 86: Asia Pacific Sustainable Catering Services Market Revenue (Million), by End-User 2025 & 2033
- Figure 87: Asia Pacific Sustainable Catering Services Market Revenue Share (%), by End-User 2025 & 2033
- Figure 88: Asia Pacific Sustainable Catering Services Market Revenue (Million), by Geography 2025 & 2033
- Figure 89: Asia Pacific Sustainable Catering Services Market Revenue Share (%), by Geography 2025 & 2033
- Figure 90: Asia Pacific Sustainable Catering Services Market Revenue (Million), by North America 2025 & 2033
- Figure 91: Asia Pacific Sustainable Catering Services Market Revenue Share (%), by North America 2025 & 2033
- Figure 92: Asia Pacific Sustainable Catering Services Market Revenue (Million), by Europe 2025 & 2033
- Figure 93: Asia Pacific Sustainable Catering Services Market Revenue Share (%), by Europe 2025 & 2033
- Figure 94: Asia Pacific Sustainable Catering Services Market Revenue (Million), by Asia-Pacific 2025 & 2033
- Figure 95: Asia Pacific Sustainable Catering Services Market Revenue Share (%), by Asia-Pacific 2025 & 2033
- Figure 96: Asia Pacific Sustainable Catering Services Market Revenue (Million), by South America 2025 & 2033
- Figure 97: Asia Pacific Sustainable Catering Services Market Revenue Share (%), by South America 2025 & 2033
- Figure 98: Asia Pacific Sustainable Catering Services Market Revenue (Million), by Middle-East and Africa 2025 & 2033
- Figure 99: Asia Pacific Sustainable Catering Services Market Revenue Share (%), by Middle-East and Africa 2025 & 2033
- Figure 100: Asia Pacific Sustainable Catering Services Market Revenue (Million), by Country 2025 & 2033
- Figure 101: Asia Pacific Sustainable Catering Services Market Revenue Share (%), by Country 2025 & 2033
List of Tables
- Table 1: Global Sustainable Catering Services Market Revenue Million Forecast, by Service Type 2020 & 2033
- Table 2: Global Sustainable Catering Services Market Revenue Million Forecast, by Event Type 2020 & 2033
- Table 3: Global Sustainable Catering Services Market Revenue Million Forecast, by End-User 2020 & 2033
- Table 4: Global Sustainable Catering Services Market Revenue Million Forecast, by Geography 2020 & 2033
- Table 5: Global Sustainable Catering Services Market Revenue Million Forecast, by North America 2020 & 2033
- Table 6: Global Sustainable Catering Services Market Revenue Million Forecast, by Europe 2020 & 2033
- Table 7: Global Sustainable Catering Services Market Revenue Million Forecast, by Asia-Pacific 2020 & 2033
- Table 8: Global Sustainable Catering Services Market Revenue Million Forecast, by South America 2020 & 2033
- Table 9: Global Sustainable Catering Services Market Revenue Million Forecast, by Middle-East and Africa 2020 & 2033
- Table 10: Global Sustainable Catering Services Market Revenue Million Forecast, by Region 2020 & 2033
- Table 11: Global Sustainable Catering Services Market Revenue Million Forecast, by Service Type 2020 & 2033
- Table 12: Global Sustainable Catering Services Market Revenue Million Forecast, by Event Type 2020 & 2033
- Table 13: Global Sustainable Catering Services Market Revenue Million Forecast, by End-User 2020 & 2033
- Table 14: Global Sustainable Catering Services Market Revenue Million Forecast, by Geography 2020 & 2033
- Table 15: Global Sustainable Catering Services Market Revenue Million Forecast, by North America 2020 & 2033
- Table 16: Global Sustainable Catering Services Market Revenue Million Forecast, by Europe 2020 & 2033
- Table 17: Global Sustainable Catering Services Market Revenue Million Forecast, by Asia-Pacific 2020 & 2033
- Table 18: Global Sustainable Catering Services Market Revenue Million Forecast, by South America 2020 & 2033
- Table 19: Global Sustainable Catering Services Market Revenue Million Forecast, by Middle-East and Africa 2020 & 2033
- Table 20: Global Sustainable Catering Services Market Revenue Million Forecast, by Country 2020 & 2033
- Table 21: United States Sustainable Catering Services Market Revenue (Million) Forecast, by Application 2020 & 2033
- Table 22: Canada Sustainable Catering Services Market Revenue (Million) Forecast, by Application 2020 & 2033
- Table 23: Mexico Sustainable Catering Services Market Revenue (Million) Forecast, by Application 2020 & 2033
- Table 24: Global Sustainable Catering Services Market Revenue Million Forecast, by Service Type 2020 & 2033
- Table 25: Global Sustainable Catering Services Market Revenue Million Forecast, by Event Type 2020 & 2033
- Table 26: Global Sustainable Catering Services Market Revenue Million Forecast, by End-User 2020 & 2033
- Table 27: Global Sustainable Catering Services Market Revenue Million Forecast, by Geography 2020 & 2033
- Table 28: Global Sustainable Catering Services Market Revenue Million Forecast, by North America 2020 & 2033
- Table 29: Global Sustainable Catering Services Market Revenue Million Forecast, by Europe 2020 & 2033
- Table 30: Global Sustainable Catering Services Market Revenue Million Forecast, by Asia-Pacific 2020 & 2033
- Table 31: Global Sustainable Catering Services Market Revenue Million Forecast, by South America 2020 & 2033
- Table 32: Global Sustainable Catering Services Market Revenue Million Forecast, by Middle-East and Africa 2020 & 2033
- Table 33: Global Sustainable Catering Services Market Revenue Million Forecast, by Country 2020 & 2033
- Table 34: Brazil Sustainable Catering Services Market Revenue (Million) Forecast, by Application 2020 & 2033
- Table 35: Argentina Sustainable Catering Services Market Revenue (Million) Forecast, by Application 2020 & 2033
- Table 36: Rest of South America Sustainable Catering Services Market Revenue (Million) Forecast, by Application 2020 & 2033
- Table 37: Global Sustainable Catering Services Market Revenue Million Forecast, by Service Type 2020 & 2033
- Table 38: Global Sustainable Catering Services Market Revenue Million Forecast, by Event Type 2020 & 2033
- Table 39: Global Sustainable Catering Services Market Revenue Million Forecast, by End-User 2020 & 2033
- Table 40: Global Sustainable Catering Services Market Revenue Million Forecast, by Geography 2020 & 2033
- Table 41: Global Sustainable Catering Services Market Revenue Million Forecast, by North America 2020 & 2033
- Table 42: Global Sustainable Catering Services Market Revenue Million Forecast, by Europe 2020 & 2033
- Table 43: Global Sustainable Catering Services Market Revenue Million Forecast, by Asia-Pacific 2020 & 2033
- Table 44: Global Sustainable Catering Services Market Revenue Million Forecast, by South America 2020 & 2033
- Table 45: Global Sustainable Catering Services Market Revenue Million Forecast, by Middle-East and Africa 2020 & 2033
- Table 46: Global Sustainable Catering Services Market Revenue Million Forecast, by Country 2020 & 2033
- Table 47: United Kingdom Sustainable Catering Services Market Revenue (Million) Forecast, by Application 2020 & 2033
- Table 48: Germany Sustainable Catering Services Market Revenue (Million) Forecast, by Application 2020 & 2033
- Table 49: France Sustainable Catering Services Market Revenue (Million) Forecast, by Application 2020 & 2033
- Table 50: Italy Sustainable Catering Services Market Revenue (Million) Forecast, by Application 2020 & 2033
- Table 51: Spain Sustainable Catering Services Market Revenue (Million) Forecast, by Application 2020 & 2033
- Table 52: Russia Sustainable Catering Services Market Revenue (Million) Forecast, by Application 2020 & 2033
- Table 53: Benelux Sustainable Catering Services Market Revenue (Million) Forecast, by Application 2020 & 2033
- Table 54: Nordics Sustainable Catering Services Market Revenue (Million) Forecast, by Application 2020 & 2033
- Table 55: Rest of Europe Sustainable Catering Services Market Revenue (Million) Forecast, by Application 2020 & 2033
- Table 56: Global Sustainable Catering Services Market Revenue Million Forecast, by Service Type 2020 & 2033
- Table 57: Global Sustainable Catering Services Market Revenue Million Forecast, by Event Type 2020 & 2033
- Table 58: Global Sustainable Catering Services Market Revenue Million Forecast, by End-User 2020 & 2033
- Table 59: Global Sustainable Catering Services Market Revenue Million Forecast, by Geography 2020 & 2033
- Table 60: Global Sustainable Catering Services Market Revenue Million Forecast, by North America 2020 & 2033
- Table 61: Global Sustainable Catering Services Market Revenue Million Forecast, by Europe 2020 & 2033
- Table 62: Global Sustainable Catering Services Market Revenue Million Forecast, by Asia-Pacific 2020 & 2033
- Table 63: Global Sustainable Catering Services Market Revenue Million Forecast, by South America 2020 & 2033
- Table 64: Global Sustainable Catering Services Market Revenue Million Forecast, by Middle-East and Africa 2020 & 2033
- Table 65: Global Sustainable Catering Services Market Revenue Million Forecast, by Country 2020 & 2033
- Table 66: Turkey Sustainable Catering Services Market Revenue (Million) Forecast, by Application 2020 & 2033
- Table 67: Israel Sustainable Catering Services Market Revenue (Million) Forecast, by Application 2020 & 2033
- Table 68: GCC Sustainable Catering Services Market Revenue (Million) Forecast, by Application 2020 & 2033
- Table 69: North Africa Sustainable Catering Services Market Revenue (Million) Forecast, by Application 2020 & 2033
- Table 70: South Africa Sustainable Catering Services Market Revenue (Million) Forecast, by Application 2020 & 2033
- Table 71: Rest of Middle East & Africa Sustainable Catering Services Market Revenue (Million) Forecast, by Application 2020 & 2033
- Table 72: Global Sustainable Catering Services Market Revenue Million Forecast, by Service Type 2020 & 2033
- Table 73: Global Sustainable Catering Services Market Revenue Million Forecast, by Event Type 2020 & 2033
- Table 74: Global Sustainable Catering Services Market Revenue Million Forecast, by End-User 2020 & 2033
- Table 75: Global Sustainable Catering Services Market Revenue Million Forecast, by Geography 2020 & 2033
- Table 76: Global Sustainable Catering Services Market Revenue Million Forecast, by North America 2020 & 2033
- Table 77: Global Sustainable Catering Services Market Revenue Million Forecast, by Europe 2020 & 2033
- Table 78: Global Sustainable Catering Services Market Revenue Million Forecast, by Asia-Pacific 2020 & 2033
- Table 79: Global Sustainable Catering Services Market Revenue Million Forecast, by South America 2020 & 2033
- Table 80: Global Sustainable Catering Services Market Revenue Million Forecast, by Middle-East and Africa 2020 & 2033
- Table 81: Global Sustainable Catering Services Market Revenue Million Forecast, by Country 2020 & 2033
- Table 82: China Sustainable Catering Services Market Revenue (Million) Forecast, by Application 2020 & 2033
- Table 83: India Sustainable Catering Services Market Revenue (Million) Forecast, by Application 2020 & 2033
- Table 84: Japan Sustainable Catering Services Market Revenue (Million) Forecast, by Application 2020 & 2033
- Table 85: South Korea Sustainable Catering Services Market Revenue (Million) Forecast, by Application 2020 & 2033
- Table 86: ASEAN Sustainable Catering Services Market Revenue (Million) Forecast, by Application 2020 & 2033
- Table 87: Oceania Sustainable Catering Services Market Revenue (Million) Forecast, by Application 2020 & 2033
- Table 88: Rest of Asia Pacific Sustainable Catering Services Market Revenue (Million) Forecast, by Application 2020 & 2033
Frequently Asked Questions
1. What is the projected Compound Annual Growth Rate (CAGR) of the Sustainable Catering Services Market?
The projected CAGR is approximately 2.33%.
2. Which companies are prominent players in the Sustainable Catering Services Market?
Key companies in the market include Dine Contract Catering**List Not Exhaustive, Aramark Corp, Emirates Flight Catering, Bartlett Mitchell Ltd, ISS A/S, Elior Group, Entier Limited, Compass Group PLC, DO & CO Aktiengesellschaft, CH and Co Catering Group Ltd.
3. What are the main segments of the Sustainable Catering Services Market?
The market segments include Service Type, Event Type, End-User, Geography, North America, Europe, Asia-Pacific, South America, Middle-East and Africa.
4. Can you provide details about the market size?
The market size is estimated to be USD 115.13 Million as of 2022.
5. What are some drivers contributing to market growth?
Increasing Trend of Outsourcing Food Services; Growing Popularity of Social Events.
6. What are the notable trends driving market growth?
Rise in Demand for Organic Food.
7. Are there any restraints impacting market growth?
Challenges in Sourcing Organic and Local Ingredients; Limited Consumer Awareness and Understanding of Sustainable Catering Practices.
8. Can you provide examples of recent developments in the market?
In January 2024, Compass Group PLC, a leading global food service company, acquired CH&CO, a premium contract and hospitality service provider in the UK and Ireland, for an initial enterprise value of GBP 475 Million (USD 600 Million).
9. What pricing options are available for accessing the report?
Pricing options include single-user, multi-user, and enterprise licenses priced at USD 3800, USD 4500, and USD 5800 respectively.
10. Is the market size provided in terms of value or volume?
The market size is provided in terms of value, measured in Million.
11. Are there any specific market keywords associated with the report?
Yes, the market keyword associated with the report is "Sustainable Catering Services Market," which aids in identifying and referencing the specific market segment covered.
12. How do I determine which pricing option suits my needs best?
The pricing options vary based on user requirements and access needs. Individual users may opt for single-user licenses, while businesses requiring broader access may choose multi-user or enterprise licenses for cost-effective access to the report.
13. Are there any additional resources or data provided in the Sustainable Catering Services Market report?
While the report offers comprehensive insights, it's advisable to review the specific contents or supplementary materials provided to ascertain if additional resources or data are available.
14. How can I stay updated on further developments or reports in the Sustainable Catering Services Market?
To stay informed about further developments, trends, and reports in the Sustainable Catering Services Market, consider subscribing to industry newsletters, following relevant companies and organizations, or regularly checking reputable industry news sources and publications.
Methodology
Step 1 - Identification of Relevant Samples Size from Population Database


Step 2 - Approaches for Defining Global Market Size (Value, Volume* & Price*)

Note*: In applicable scenarios
Step 3 - Data Sources
Primary Research
- Web Analytics
- Survey Reports
- Research Institute
- Latest Research Reports
- Opinion Leaders
Secondary Research
- Annual Reports
- White Paper
- Latest Press Release
- Industry Association
- Paid Database
- Investor Presentations

Step 4 - Data Triangulation
Involves using different sources of information in order to increase the validity of a study
These sources are likely to be stakeholders in a program - participants, other researchers, program staff, other community members, and so on.
Then we put all data in single framework & apply various statistical tools to find out the dynamic on the market.
During the analysis stage, feedback from the stakeholder groups would be compared to determine areas of agreement as well as areas of divergence