

Key Insights
The global tempered glass market is projected to reach $5.95 billion by 2025, with a robust Compound Annual Growth Rate (CAGR) of 11.51% through 2033. This significant expansion is propelled by key industry trends. The automotive sector's increasing integration of Advanced Driver-Assistance Systems (ADAS) and enhanced safety features directly drives demand for superior, durable tempered glass. Concurrently, the construction industry's focus on energy-efficient and visually appealing building materials is accelerating the adoption of tempered glass for facades, windows, and interior applications. The thriving electronics industry, especially the sustained growth in smartphones and consumer devices, further bolsters tempered glass consumption. Continuous innovation in glass technology is also introducing novel solutions with improved strength and transparency, catalyzing market growth.
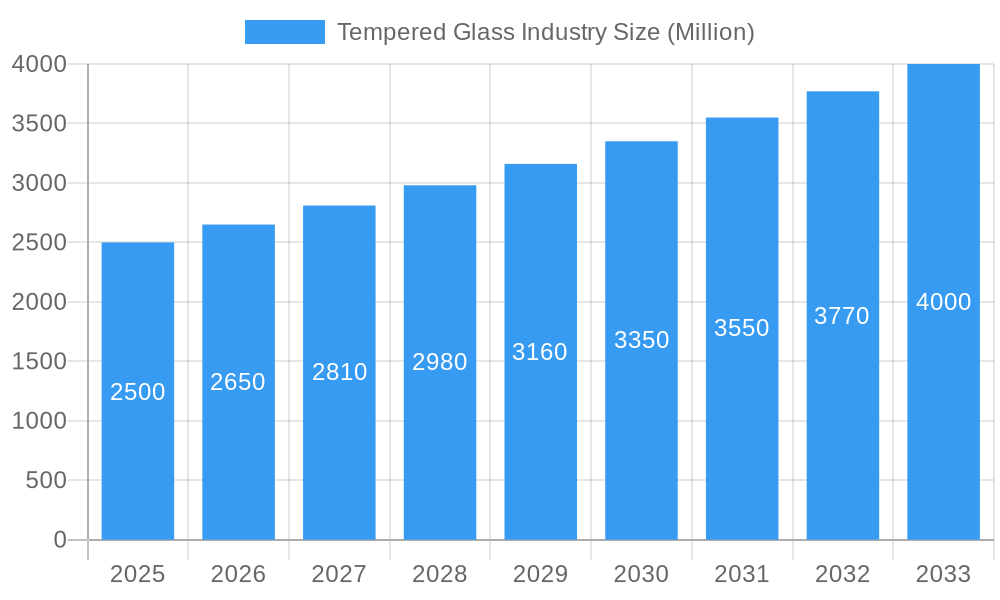
Tempered Glass Industry Market Size (In Billion)
However, market dynamics are influenced by certain constraints. Volatile raw material pricing, notably for silica sand and soda ash, can affect manufacturing costs and profitability. The energy-intensive nature of tempered glass production also raises environmental considerations and potential regulatory challenges. Notwithstanding these obstacles, the tempered glass market exhibits a positive growth trajectory, fueled by robust demand from primary end-user sectors and ongoing technological advancements. The market is segmented by end-user industry, including automotive, construction, electronics, and others, and is geographically diverse, with significant presence in Asia Pacific (led by China and India), North America, Europe, South America, and the Middle East & Africa. Leading market participants like Nippon Sheet Glass, Saint-Gobain, and AGC Inc. are actively pursuing market share through product innovation, strategic alliances, and global expansion. The long-term outlook for the tempered glass market remains highly promising, anticipating sustained expansion driven by technological breakthroughs and consistent demand across various industries.
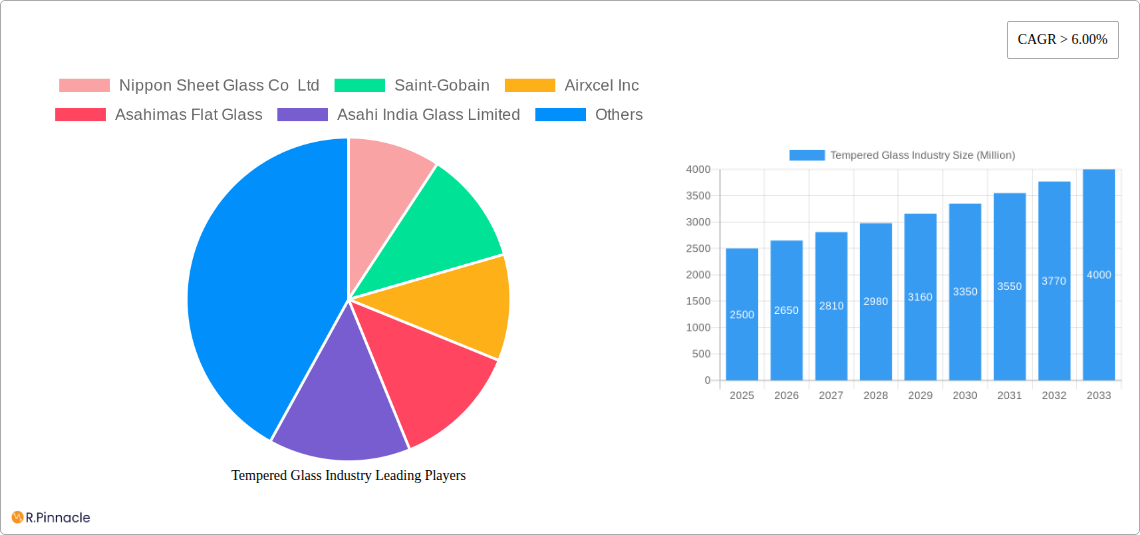
Tempered Glass Industry Company Market Share
Tempered Glass Industry Market Report: 2019-2033
This comprehensive report provides a detailed analysis of the global tempered glass industry, offering invaluable insights for industry professionals, investors, and strategic decision-makers. With a study period spanning 2019-2033, a base year of 2025, and a forecast period of 2025-2033, this report unveils the market's current state and future trajectory. The market is projected to reach xx Million by 2033, exhibiting a significant CAGR of xx% during the forecast period.
Tempered Glass Industry Market Structure & Innovation Trends
This section analyzes the competitive landscape, innovation drivers, and regulatory influences shaping the tempered glass market. The market exhibits moderate concentration, with key players such as Nippon Sheet Glass Co Ltd, Saint-Gobain, AGC Inc, and Guardian Glass LLC holding significant market share. However, smaller, specialized players also contribute significantly, especially in niche segments.
- Market Concentration: The top 5 players hold an estimated xx% market share in 2025.
- Innovation Drivers: Advancements in glass processing technologies, including digital twin technologies like AGC's COCOA, are driving innovation. The focus is on improving energy efficiency, enhancing product durability, and expanding applications.
- Regulatory Frameworks: Environmental regulations concerning glass manufacturing and disposal influence production processes and material sourcing. Safety standards for automotive and construction applications also play a crucial role.
- Product Substitutes: While tempered glass offers unique properties, alternatives like polycarbonate and acrylic sheets compete in specific applications. However, tempered glass retains a strong position due to its superior strength and optical clarity.
- End-User Demographics: The construction sector, particularly high-rise buildings and modern architecture, is driving demand. Growth in automotive manufacturing and electronics production also fuels market expansion.
- M&A Activities: The tempered glass industry has witnessed several M&A activities in recent years, with deal values totaling approximately xx Million over the historical period (2019-2024). These acquisitions have aimed to expand market reach, enhance technological capabilities, and consolidate market share.
Tempered Glass Industry Market Dynamics & Trends
The tempered glass market is witnessing robust growth driven by increasing demand across various end-use industries. Several factors contribute to this expansion:
- Technological Disruptions: The implementation of advanced manufacturing techniques, including digital twin technologies and automation, improves efficiency and reduces production costs.
- Consumer Preferences: A preference for energy-efficient and aesthetically pleasing buildings and vehicles fuels demand for high-performance tempered glass.
- Competitive Dynamics: Competition among leading players is intense, driving innovation and price optimization. Strategic partnerships and collaborations are becoming prevalent.
- Market Growth Drivers: The global construction boom, particularly in emerging economies, is a significant driver. The growing automotive industry, the rise of smart devices, and expanding use in renewable energy applications also contribute. The market is expected to witness a compound annual growth rate (CAGR) of xx% from 2025 to 2033.
- Market Penetration: Tempered glass continues to increase its penetration in various sectors, owing to its superior safety and performance characteristics.
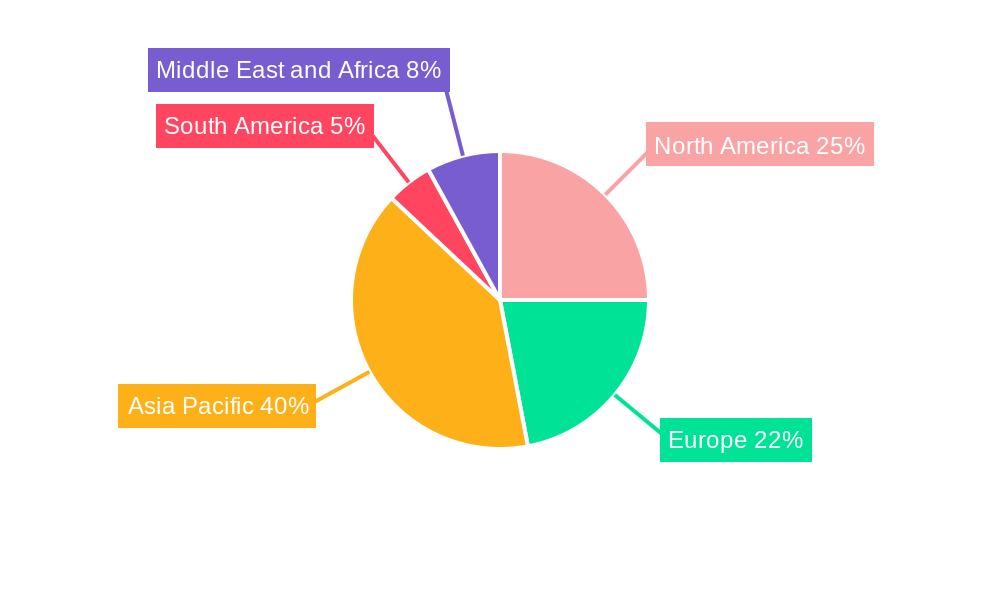
Dominant Regions & Segments in Tempered Glass Industry
The Asia-Pacific region dominates the tempered glass market, driven primarily by rapid infrastructural development in countries like China and India. Within end-user industries:
- Automotive: The automotive industry is a major consumer of tempered glass, primarily for windshields and windows. Growth is propelled by the global rise in automobile sales, particularly in emerging markets. Stringent safety regulations further bolster demand.
- Construction: High-rise buildings and modern architectural designs necessitate substantial amounts of tempered glass for facades, windows, and other applications. Government investments in infrastructure development and construction activities support market expansion.
- Electronics: The electronics sector utilizes tempered glass for displays and protective coverings in smartphones, tablets, and other devices. The growth of the consumer electronics market is fueling this segment’s demand.
- Other End-user Industries: Other significant application areas include appliances, furniture, and solar panels, contributing to steady market growth.
Tempered Glass Industry Product Innovations
Recent innovations focus on enhanced durability, improved energy efficiency, and specialized functionalities. Self-cleaning glass, solar control glass, and electrically heated glass are gaining traction. These advancements cater to the increasing demand for energy-efficient and sustainable solutions across various applications.
Report Scope & Segmentation Analysis
The report segments the market based on end-user industries: Automotive, Construction, Electronics, and Other End-user Industries. Each segment's growth projections, market size, and competitive dynamics are analyzed in detail. The automotive segment is projected to witness the highest growth rate during the forecast period. The construction segment is expected to maintain a significant market share, driven by infrastructure development and urbanization. The electronics segment's growth is directly linked to the consumer electronics industry.
Key Drivers of Tempered Glass Industry Growth
Several factors drive growth:
- Technological advancements: Innovations in manufacturing processes and product design enhance product performance and reduce costs.
- Economic growth: Increased construction and industrial activities, especially in developing economies, boost demand.
- Government regulations: Stringent safety and energy efficiency standards promote the adoption of tempered glass.
Challenges in the Tempered Glass Industry Sector
The tempered glass industry faces challenges:
- Fluctuating raw material prices: The cost of raw materials such as silica sand and soda ash affects profitability.
- Intense competition: The market is characterized by intense competition among numerous players, putting pressure on prices.
- Environmental concerns: The manufacturing process generates waste, raising environmental concerns and necessitating sustainable practices.
Emerging Opportunities in Tempered Glass Industry
Emerging opportunities include:
- Smart glass technology: The increasing adoption of smart glass solutions presents growth prospects.
- Sustainable glass production: Demand for eco-friendly glass manufacturing processes is rising.
- Expansion into niche applications: Exploring new applications such as in renewable energy and aerospace presents significant potential.
Leading Players in the Tempered Glass Industry Market
- Nippon Sheet Glass Co Ltd
- Saint-Gobain
- Airxcel Inc
- Asahimas Flat Glass
- Asahi India Glass Limited
- TOMAKK GLASS PARTNERS LLC
- GUARDIAN GLASS LLC
- GSC GLASS LTD
- KIBING GROUP
- AGC Inc
- CARDINAL GLASS INDUSTRIES INC
- Abrisa Technologies
- SCHOTT AG
Key Developments in Tempered Glass Industry
- December 2022: The Guardian Glass Company launched the new Guardian Glass Resource Hub, providing 24/7 online access to technical information and training resources, impacting market knowledge and support.
- January 2023: AGC Inc. developed and implemented digital twin technology (COCOA) for the glass melting process, significantly enhancing efficiency and understanding of manufacturing conditions.
Future Outlook for Tempered Glass Industry Market
The tempered glass market is poised for substantial growth, driven by technological advancements, increasing demand across diverse sectors, and ongoing infrastructural development globally. Strategic partnerships, sustainable manufacturing practices, and the expansion into niche applications will further shape the industry's future.
Tempered Glass Industry Segmentation
-
1. End-user Industry
- 1.1. Automotive
- 1.2. Construction
- 1.3. Electronics
- 1.4. Other End-user Industries
Tempered Glass Industry Segmentation By Geography
-
1. Asia Pacific
- 1.1. China
- 1.2. India
- 1.3. Japan
- 1.4. South Korea
- 1.5. Rest of Asia Pacific
-
2. North America
- 2.1. United States
- 2.2. Canada
- 2.3. Mexico
-
3. Europe
- 3.1. Germany
- 3.2. United Kingdom
- 3.3. France
- 3.4. Italy
- 3.5. Rest of Europe
-
4. South America
- 4.1. Brazil
- 4.2. Argentina
- 4.3. Rest of South America
-
5. Middle East and Africa
- 5.1. Saudi Arabia
- 5.2. South Africa
- 5.3. Rest of Middle East and Africa
Tempered Glass Industry Regional Market Share
Geographic Coverage of Tempered Glass Industry
Tempered Glass Industry REPORT HIGHLIGHTS
| Aspects | Details |
|---|---|
| Study Period | 2020-2034 |
| Base Year | 2025 |
| Estimated Year | 2026 |
| Forecast Period | 2026-2034 |
| Historical Period | 2020-2025 |
| Growth Rate | CAGR of 11.51% from 2020-2034 |
| Segmentation |
|
Table of Contents
- 1. Introduction
- 1.1. Research Scope
- 1.2. Market Segmentation
- 1.3. Research Objective
- 1.4. Definitions and Assumptions
- 2. Executive Summary
- 2.1. Market Snapshot
- 3. Market Dynamics
- 3.1. Market Drivers
- 3.2. Market Restrains
- 3.3. Market Trends
- 3.4. Market Opportunities
- 4. Market Factor Analysis
- 4.1. Porters Five Forces
- 4.1.1. Bargaining Power of Suppliers
- 4.1.2. Bargaining Power of Buyers
- 4.1.3. Threat of New Entrants
- 4.1.4. Threat of Substitutes
- 4.1.5. Competitive Rivalry
- 4.2. PESTEL analysis
- 4.3. BCG Analysis
- 4.3.1. Stars (High Growth, High Market Share)
- 4.3.2. Cash Cows (Low Growth, High Market Share)
- 4.3.3. Question Mark (High Growth, Low Market Share)
- 4.3.4. Dogs (Low Growth, Low Market Share)
- 4.4. Ansoff Matrix Analysis
- 4.5. Supply Chain Analysis
- 4.6. Regulatory Landscape
- 4.7. Current Market Potential and Opportunity Assessment (TAM–SAM–SOM Framework)
- 4.8. PRI Analyst Note
- 4.1. Porters Five Forces
- 5. Market Analysis, Insights and Forecast 2021-2033
- 5.1. Market Analysis, Insights and Forecast - by End-user Industry
- 5.1.1. Automotive
- 5.1.2. Construction
- 5.1.3. Electronics
- 5.1.4. Other End-user Industries
- 5.2. Market Analysis, Insights and Forecast - by Region
- 5.2.1. Asia Pacific
- 5.2.2. North America
- 5.2.3. Europe
- 5.2.4. South America
- 5.2.5. Middle East and Africa
- 5.1. Market Analysis, Insights and Forecast - by End-user Industry
- 6. Global Tempered Glass Industry Analysis, Insights and Forecast, 2021-2033
- 6.1. Market Analysis, Insights and Forecast - by End-user Industry
- 6.1.1. Automotive
- 6.1.2. Construction
- 6.1.3. Electronics
- 6.1.4. Other End-user Industries
- 6.1. Market Analysis, Insights and Forecast - by End-user Industry
- 7. Asia Pacific Tempered Glass Industry Analysis, Insights and Forecast, 2020-2032
- 7.1. Market Analysis, Insights and Forecast - by End-user Industry
- 7.1.1. Automotive
- 7.1.2. Construction
- 7.1.3. Electronics
- 7.1.4. Other End-user Industries
- 7.1. Market Analysis, Insights and Forecast - by End-user Industry
- 8. North America Tempered Glass Industry Analysis, Insights and Forecast, 2020-2032
- 8.1. Market Analysis, Insights and Forecast - by End-user Industry
- 8.1.1. Automotive
- 8.1.2. Construction
- 8.1.3. Electronics
- 8.1.4. Other End-user Industries
- 8.1. Market Analysis, Insights and Forecast - by End-user Industry
- 9. Europe Tempered Glass Industry Analysis, Insights and Forecast, 2020-2032
- 9.1. Market Analysis, Insights and Forecast - by End-user Industry
- 9.1.1. Automotive
- 9.1.2. Construction
- 9.1.3. Electronics
- 9.1.4. Other End-user Industries
- 9.1. Market Analysis, Insights and Forecast - by End-user Industry
- 10. South America Tempered Glass Industry Analysis, Insights and Forecast, 2020-2032
- 10.1. Market Analysis, Insights and Forecast - by End-user Industry
- 10.1.1. Automotive
- 10.1.2. Construction
- 10.1.3. Electronics
- 10.1.4. Other End-user Industries
- 10.1. Market Analysis, Insights and Forecast - by End-user Industry
- 11. Middle East and Africa Tempered Glass Industry Analysis, Insights and Forecast, 2020-2032
- 11.1. Market Analysis, Insights and Forecast - by End-user Industry
- 11.1.1. Automotive
- 11.1.2. Construction
- 11.1.3. Electronics
- 11.1.4. Other End-user Industries
- 11.1. Market Analysis, Insights and Forecast - by End-user Industry
- 12. Competitive Analysis
- 12.1. Company Profiles
- 12.1.1 Nippon Sheet Glass Co Ltd
- 12.1.1.1. Company Overview
- 12.1.1.2. Products
- 12.1.1.3. Company Financials
- 12.1.1.4. SWOT Analysis
- 12.1.2 Saint-Gobain
- 12.1.2.1. Company Overview
- 12.1.2.2. Products
- 12.1.2.3. Company Financials
- 12.1.2.4. SWOT Analysis
- 12.1.3 Airxcel Inc
- 12.1.3.1. Company Overview
- 12.1.3.2. Products
- 12.1.3.3. Company Financials
- 12.1.3.4. SWOT Analysis
- 12.1.4 Asahimas Flat Glass
- 12.1.4.1. Company Overview
- 12.1.4.2. Products
- 12.1.4.3. Company Financials
- 12.1.4.4. SWOT Analysis
- 12.1.5 Asahi India Glass Limited
- 12.1.5.1. Company Overview
- 12.1.5.2. Products
- 12.1.5.3. Company Financials
- 12.1.5.4. SWOT Analysis
- 12.1.6 TOMAKK GLASS PARTNERS LLC*List Not Exhaustive
- 12.1.6.1. Company Overview
- 12.1.6.2. Products
- 12.1.6.3. Company Financials
- 12.1.6.4. SWOT Analysis
- 12.1.7 GUARDIAN GLASS LLC
- 12.1.7.1. Company Overview
- 12.1.7.2. Products
- 12.1.7.3. Company Financials
- 12.1.7.4. SWOT Analysis
- 12.1.8 GSC GLASS LTD
- 12.1.8.1. Company Overview
- 12.1.8.2. Products
- 12.1.8.3. Company Financials
- 12.1.8.4. SWOT Analysis
- 12.1.9 KIBING GROUP
- 12.1.9.1. Company Overview
- 12.1.9.2. Products
- 12.1.9.3. Company Financials
- 12.1.9.4. SWOT Analysis
- 12.1.10 AGC Inc
- 12.1.10.1. Company Overview
- 12.1.10.2. Products
- 12.1.10.3. Company Financials
- 12.1.10.4. SWOT Analysis
- 12.1.11 CARDINAL GLASS INDUSTRIES INC
- 12.1.11.1. Company Overview
- 12.1.11.2. Products
- 12.1.11.3. Company Financials
- 12.1.11.4. SWOT Analysis
- 12.1.12 Abrisa Technologies
- 12.1.12.1. Company Overview
- 12.1.12.2. Products
- 12.1.12.3. Company Financials
- 12.1.12.4. SWOT Analysis
- 12.1.13 SCHOTT AG
- 12.1.13.1. Company Overview
- 12.1.13.2. Products
- 12.1.13.3. Company Financials
- 12.1.13.4. SWOT Analysis
- 12.1.1 Nippon Sheet Glass Co Ltd
- 12.2. Market Entropy
- 12.2.1 Company's Key Areas Served
- 12.2.2 Recent Developments
- 12.3. Company Market Share Analysis 2025
- 12.3.1 Top 5 Companies Market Share Analysis
- 12.3.2 Top 3 Companies Market Share Analysis
- 12.4. List of Potential Customers
- 13. Research Methodology
List of Figures
- Figure 1: Global Tempered Glass Industry Revenue Breakdown (billion, %) by Region 2025 & 2033
- Figure 2: Asia Pacific Tempered Glass Industry Revenue (billion), by End-user Industry 2025 & 2033
- Figure 3: Asia Pacific Tempered Glass Industry Revenue Share (%), by End-user Industry 2025 & 2033
- Figure 4: Asia Pacific Tempered Glass Industry Revenue (billion), by Country 2025 & 2033
- Figure 5: Asia Pacific Tempered Glass Industry Revenue Share (%), by Country 2025 & 2033
- Figure 6: North America Tempered Glass Industry Revenue (billion), by End-user Industry 2025 & 2033
- Figure 7: North America Tempered Glass Industry Revenue Share (%), by End-user Industry 2025 & 2033
- Figure 8: North America Tempered Glass Industry Revenue (billion), by Country 2025 & 2033
- Figure 9: North America Tempered Glass Industry Revenue Share (%), by Country 2025 & 2033
- Figure 10: Europe Tempered Glass Industry Revenue (billion), by End-user Industry 2025 & 2033
- Figure 11: Europe Tempered Glass Industry Revenue Share (%), by End-user Industry 2025 & 2033
- Figure 12: Europe Tempered Glass Industry Revenue (billion), by Country 2025 & 2033
- Figure 13: Europe Tempered Glass Industry Revenue Share (%), by Country 2025 & 2033
- Figure 14: South America Tempered Glass Industry Revenue (billion), by End-user Industry 2025 & 2033
- Figure 15: South America Tempered Glass Industry Revenue Share (%), by End-user Industry 2025 & 2033
- Figure 16: South America Tempered Glass Industry Revenue (billion), by Country 2025 & 2033
- Figure 17: South America Tempered Glass Industry Revenue Share (%), by Country 2025 & 2033
- Figure 18: Middle East and Africa Tempered Glass Industry Revenue (billion), by End-user Industry 2025 & 2033
- Figure 19: Middle East and Africa Tempered Glass Industry Revenue Share (%), by End-user Industry 2025 & 2033
- Figure 20: Middle East and Africa Tempered Glass Industry Revenue (billion), by Country 2025 & 2033
- Figure 21: Middle East and Africa Tempered Glass Industry Revenue Share (%), by Country 2025 & 2033
List of Tables
- Table 1: Global Tempered Glass Industry Revenue billion Forecast, by End-user Industry 2020 & 2033
- Table 2: Global Tempered Glass Industry Revenue billion Forecast, by Region 2020 & 2033
- Table 3: Global Tempered Glass Industry Revenue billion Forecast, by End-user Industry 2020 & 2033
- Table 4: Global Tempered Glass Industry Revenue billion Forecast, by Country 2020 & 2033
- Table 5: China Tempered Glass Industry Revenue (billion) Forecast, by Application 2020 & 2033
- Table 6: India Tempered Glass Industry Revenue (billion) Forecast, by Application 2020 & 2033
- Table 7: Japan Tempered Glass Industry Revenue (billion) Forecast, by Application 2020 & 2033
- Table 8: South Korea Tempered Glass Industry Revenue (billion) Forecast, by Application 2020 & 2033
- Table 9: Rest of Asia Pacific Tempered Glass Industry Revenue (billion) Forecast, by Application 2020 & 2033
- Table 10: Global Tempered Glass Industry Revenue billion Forecast, by End-user Industry 2020 & 2033
- Table 11: Global Tempered Glass Industry Revenue billion Forecast, by Country 2020 & 2033
- Table 12: United States Tempered Glass Industry Revenue (billion) Forecast, by Application 2020 & 2033
- Table 13: Canada Tempered Glass Industry Revenue (billion) Forecast, by Application 2020 & 2033
- Table 14: Mexico Tempered Glass Industry Revenue (billion) Forecast, by Application 2020 & 2033
- Table 15: Global Tempered Glass Industry Revenue billion Forecast, by End-user Industry 2020 & 2033
- Table 16: Global Tempered Glass Industry Revenue billion Forecast, by Country 2020 & 2033
- Table 17: Germany Tempered Glass Industry Revenue (billion) Forecast, by Application 2020 & 2033
- Table 18: United Kingdom Tempered Glass Industry Revenue (billion) Forecast, by Application 2020 & 2033
- Table 19: France Tempered Glass Industry Revenue (billion) Forecast, by Application 2020 & 2033
- Table 20: Italy Tempered Glass Industry Revenue (billion) Forecast, by Application 2020 & 2033
- Table 21: Rest of Europe Tempered Glass Industry Revenue (billion) Forecast, by Application 2020 & 2033
- Table 22: Global Tempered Glass Industry Revenue billion Forecast, by End-user Industry 2020 & 2033
- Table 23: Global Tempered Glass Industry Revenue billion Forecast, by Country 2020 & 2033
- Table 24: Brazil Tempered Glass Industry Revenue (billion) Forecast, by Application 2020 & 2033
- Table 25: Argentina Tempered Glass Industry Revenue (billion) Forecast, by Application 2020 & 2033
- Table 26: Rest of South America Tempered Glass Industry Revenue (billion) Forecast, by Application 2020 & 2033
- Table 27: Global Tempered Glass Industry Revenue billion Forecast, by End-user Industry 2020 & 2033
- Table 28: Global Tempered Glass Industry Revenue billion Forecast, by Country 2020 & 2033
- Table 29: Saudi Arabia Tempered Glass Industry Revenue (billion) Forecast, by Application 2020 & 2033
- Table 30: South Africa Tempered Glass Industry Revenue (billion) Forecast, by Application 2020 & 2033
- Table 31: Rest of Middle East and Africa Tempered Glass Industry Revenue (billion) Forecast, by Application 2020 & 2033
Frequently Asked Questions
1. What is the projected Compound Annual Growth Rate (CAGR) of the Tempered Glass Industry?
The projected CAGR is approximately 11.51%.
2. Which companies are prominent players in the Tempered Glass Industry?
Key companies in the market include Nippon Sheet Glass Co Ltd, Saint-Gobain, Airxcel Inc, Asahimas Flat Glass, Asahi India Glass Limited, TOMAKK GLASS PARTNERS LLC*List Not Exhaustive, GUARDIAN GLASS LLC, GSC GLASS LTD, KIBING GROUP, AGC Inc, CARDINAL GLASS INDUSTRIES INC, Abrisa Technologies, SCHOTT AG.
3. What are the main segments of the Tempered Glass Industry?
The market segments include End-user Industry.
4. Can you provide details about the market size?
The market size is estimated to be USD 5.95 billion as of 2022.
5. What are some drivers contributing to market growth?
Growing Demand from the Construction Industry; Other Drivers.
6. What are the notable trends driving market growth?
Growing Demand from the Construction Industry.
7. Are there any restraints impacting market growth?
Increasing Use of Other Light Weight Products; Other Restraints.
8. Can you provide examples of recent developments in the market?
January 2023: AGC develops digital twin technology (CADTANK Online Computation and Optimization Assistant (COCOA)) for the glass melting process and starts flotation furnace operational verification. This technology makes it easy to get a quick and detailed understanding of how glass is melted and a first look at the manufacturing conditions.
9. What pricing options are available for accessing the report?
Pricing options include single-user, multi-user, and enterprise licenses priced at USD 4750, USD 5250, and USD 8750 respectively.
10. Is the market size provided in terms of value or volume?
The market size is provided in terms of value, measured in billion.
11. Are there any specific market keywords associated with the report?
Yes, the market keyword associated with the report is "Tempered Glass Industry," which aids in identifying and referencing the specific market segment covered.
12. How do I determine which pricing option suits my needs best?
The pricing options vary based on user requirements and access needs. Individual users may opt for single-user licenses, while businesses requiring broader access may choose multi-user or enterprise licenses for cost-effective access to the report.
13. Are there any additional resources or data provided in the Tempered Glass Industry report?
While the report offers comprehensive insights, it's advisable to review the specific contents or supplementary materials provided to ascertain if additional resources or data are available.
14. How can I stay updated on further developments or reports in the Tempered Glass Industry?
To stay informed about further developments, trends, and reports in the Tempered Glass Industry, consider subscribing to industry newsletters, following relevant companies and organizations, or regularly checking reputable industry news sources and publications.
Methodology
Step 1 - Identification of Relevant Samples Size from Population Database


Step 2 - Approaches for Defining Global Market Size (Value, Volume* & Price*)

Note*: In applicable scenarios
Step 3 - Data Sources
Primary Research
- Web Analytics
- Survey Reports
- Research Institute
- Latest Research Reports
- Opinion Leaders
Secondary Research
- Annual Reports
- White Paper
- Latest Press Release
- Industry Association
- Paid Database
- Investor Presentations

Step 4 - Data Triangulation
Involves using different sources of information in order to increase the validity of a study
These sources are likely to be stakeholders in a program - participants, other researchers, program staff, other community members, and so on.
Then we put all data in single framework & apply various statistical tools to find out the dynamic on the market.
During the analysis stage, feedback from the stakeholder groups would be compared to determine areas of agreement as well as areas of divergence