

Key Insights
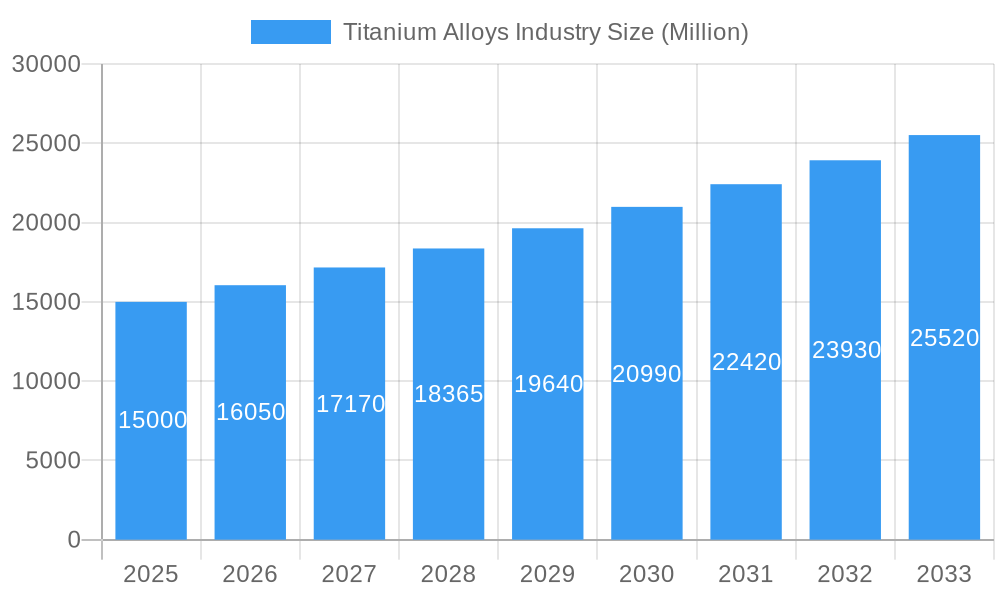
The titanium alloys market is experiencing robust growth, projected to maintain a CAGR exceeding 7% from 2025 to 2033. This expansion is driven by increasing demand across diverse end-user industries. The aerospace sector remains a key driver, fueled by the burgeoning aviation industry and the ongoing development of lightweight, high-strength aircraft components. The automotive and shipbuilding industries are also significant contributors, adopting titanium alloys for enhanced durability and fuel efficiency. Furthermore, the power and desalination sectors are increasingly leveraging titanium's corrosion resistance in demanding applications. Market segmentation by microstructure reveals a strong preference for alpha and near-alpha alloys, owing to their superior mechanical properties and weldability. However, the demand for alpha-beta and beta alloys is also rising due to their high strength-to-weight ratio. Geographical analysis indicates significant market presence in North America and Europe, driven by established aerospace and automotive industries. However, the Asia-Pacific region is poised for substantial growth, fueled by rapid industrialization and infrastructure development, particularly in China, India, and Japan. While the high cost of titanium and its processing remains a restraint, ongoing advancements in manufacturing techniques and the development of cost-effective alternatives are gradually mitigating this challenge. The competitive landscape is characterized by a mix of established players like VSMPO-AVISMA, TIMET, and Kobe Steel, alongside emerging regional manufacturers. This dynamic interplay of factors promises continued expansion of the titanium alloys market over the forecast period.
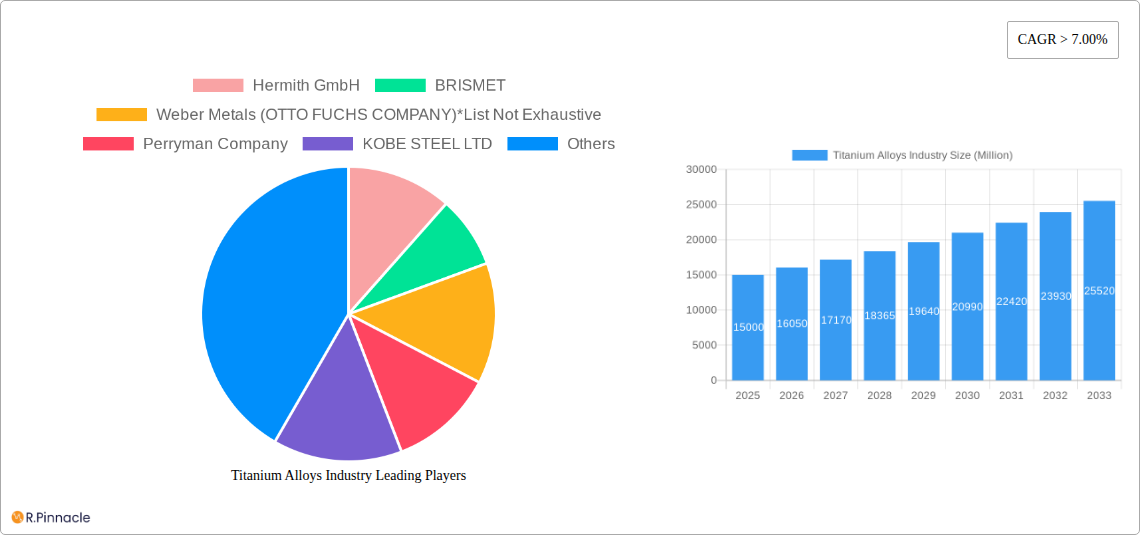
Titanium Alloys Industry Market Size (In Billion)
The continued growth trajectory is expected to be influenced by advancements in additive manufacturing (3D printing) techniques, enabling the production of complex, customized titanium alloy components. Government initiatives promoting sustainable and lightweight materials in various sectors are also contributing to market expansion. However, potential supply chain disruptions and fluctuations in raw material prices represent ongoing challenges. The market's success hinges on balancing the high cost of titanium with its superior performance characteristics, promoting its wider adoption in diverse applications beyond aerospace. Companies are actively investing in R&D to develop new alloys with enhanced properties and improved cost-effectiveness. Strategic partnerships and mergers & acquisitions will also play a crucial role in shaping the competitive dynamics within this lucrative market segment.
Titanium Alloys Industry Company Market Share
Titanium Alloys Industry Market Report: 2019-2033
This comprehensive report provides a detailed analysis of the global titanium alloys industry, offering invaluable insights for industry professionals, investors, and strategic decision-makers. Covering the period 2019-2033, with a focus on 2025, this report meticulously examines market dynamics, key players, and future growth prospects. The report leverages extensive data analysis to provide actionable intelligence and forecast the market's trajectory.
Titanium Alloys Industry Market Structure & Innovation Trends
The titanium alloys market is characterized by a moderately concentrated structure with several major players holding significant market share. Key companies include VSMPO-AVISMA Corporation, ATI, TIMET (Precision Castparts Corp), Kobe Steel Ltd, and others such as Hermith GmbH, BRISMET, Weber Metals (OTTO FUCHS COMPANY), Perryman Company, Daido Steel Co Ltd, Toho Titanium Co Ltd, Howmet Aerospace, CRS Holdings LLC, Eramet, M/s Bansal Brothers, AMG Advanced Metallurgical Group N V, and Mishra Dhatu Nigam Limited. Market share distribution varies across segments and regions, with VSMPO-AVISMA holding a substantial global share. Innovation is driven by the aerospace and defense sectors, demanding lighter, stronger, and more corrosion-resistant alloys. Regulatory frameworks, particularly concerning environmental impact and material sourcing, are evolving, influencing production processes and material costs. Product substitutes, like advanced composites, pose a competitive challenge, especially in niche applications. M&A activity has been moderate, with deal values ranging from xx Million to xx Million USD in recent years, primarily focused on expanding capacity and technological capabilities.
- Market Concentration: Moderately concentrated, with several dominant players.
- Innovation Drivers: Aerospace and defense industries, demanding advanced material properties.
- Regulatory Framework: Evolving environmental regulations and material sourcing standards.
- Product Substitutes: Advanced composites present a growing competitive threat.
- M&A Activity: Moderate activity, with deal values ranging from xx Million to xx Million USD.
Titanium Alloys Industry Market Dynamics & Trends
The titanium alloys market exhibits a steady growth trajectory, driven by the increasing demand from the aerospace industry (particularly for aircraft and spacecraft components), the automotive sector (for lightweight components), and the chemical processing industry (for corrosion-resistant equipment). Technological advancements, including additive manufacturing (3D printing) and improved alloy formulations, are further propelling market growth. The CAGR for the forecast period (2025-2033) is projected at xx%, with market penetration increasing in emerging economies. Competitive dynamics are shaped by technological innovation, cost efficiency, and supply chain resilience. Consumer preferences are shifting towards sustainable and ethically sourced materials, influencing industry practices.
Dominant Regions & Segments in Titanium Alloys Industry
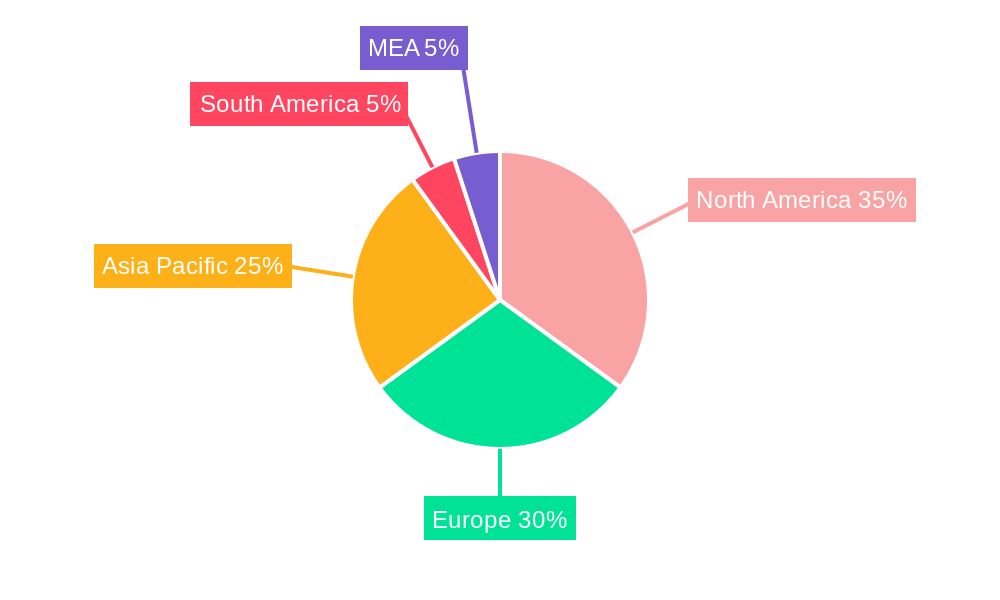
The North American and European regions currently dominate the titanium alloys market, driven by a robust aerospace and defense sector and well-established manufacturing capabilities. However, the Asia-Pacific region is experiencing significant growth, fuelled by increasing investments in infrastructure and industrial expansion.
By End-user Industry:
- Aerospace: Remains the largest segment, driven by the continuous demand for lightweight and high-strength materials in aircraft and spacecraft manufacturing.
- Automotive and Shipbuilding: Growing segment, fueled by the increasing adoption of lightweight components to improve fuel efficiency and reduce emissions.
- Chemical: Significant demand for corrosion-resistant alloys in chemical processing plants.
- Power and Desalination: Expanding demand for high-performance alloys in power generation and desalination facilities.
- Other End-user Industries: Includes medical implants, sporting goods, and other specialized applications.
By Microstructure:
- Alpha and Near-alpha Alloy: Preferred for high-temperature applications due to their excellent creep resistance.
- Alpha-beta Alloy: Offers a balance of strength, ductility, and weldability, making it suitable for a wide range of applications.
- Beta Alloy: Known for its high strength and formability, used in specific high-strength applications.
Key drivers for regional dominance include supportive government policies, robust infrastructure, and a skilled workforce.
Titanium Alloys Industry Product Innovations
Recent product innovations focus on developing alloys with enhanced properties, such as improved strength-to-weight ratios, higher corrosion resistance, and better weldability. Additive manufacturing is revolutionizing production, enabling the creation of complex parts with reduced material waste. These advancements cater to the growing demand for lightweight, high-performance materials in diverse sectors, providing competitive advantages to manufacturers.
Report Scope & Segmentation Analysis
This report segments the titanium alloys market by end-user industry (Aerospace, Automotive and Shipbuilding, Chemical, Power and Desalination, Other End-user Industries) and microstructure (Alpha and Near-alpha Alloy, Alpha-beta Alloy, Beta Alloy). Each segment's growth projections, market sizes, and competitive dynamics are thoroughly analyzed, providing a comprehensive understanding of the market landscape. Growth rates vary across segments, with the aerospace sector maintaining the highest growth trajectory. Competitive dynamics are shaped by technological advancements, cost competitiveness, and supply chain management.
Key Drivers of Titanium Alloys Industry Growth
The growth of the titanium alloys industry is primarily driven by technological advancements leading to improved material properties, the increasing demand for lightweight materials in the aerospace and automotive sectors, and government support for research and development in advanced materials. The rising demand for corrosion-resistant materials in chemical processing and power generation also fuels market expansion.
Challenges in the Titanium Alloys Industry Sector
The titanium alloys industry faces challenges such as the high cost of raw materials and production processes, volatile metal prices, and the need to overcome the material's inherent challenges in welding and processing. Supply chain disruptions, particularly related to raw material sourcing, can impact production and profitability. Intense competition among manufacturers necessitates continuous innovation and cost optimization strategies.
Emerging Opportunities in Titanium Alloys Industry
Emerging opportunities lie in the development of novel alloys with enhanced properties, the expansion into new applications in the medical and energy sectors, and the adoption of sustainable manufacturing practices to reduce environmental impact. Additive manufacturing presents a significant opportunity to create complex geometries and reduce production costs. Growing demand in emerging markets further presents opportunities for market expansion.
Leading Players in the Titanium Alloys Industry Market
- Hermith GmbH
- BRISMET
- Weber Metals (OTTO FUCHS COMPANY)
- Perryman Company
- KOBE STEEL LTD
- ATI
- Daido Steel Co Ltd
- Toho Titanium Co Ltd
- VSMPO-AVISMA Corporation
- Howmet Aerospace
- CRS Holdings LLC
- Eramet
- M/s Bansal Brothers
- AMG Advanced Metallurgical Group N V
- Mishra Dhatu Nigam Limited
- TIMET (Precision Castparts Corp)
Key Developments in Titanium Alloys Industry
- November 2022: PTC Industries and Mishra Dhatu Nigam (MIDHANI) signed an MOU for technological collaboration in manufacturing titanium alloy pipes, tubes, plates, sheets, and critical parts for defense and aerospace. This collaboration aims to enhance domestic production capabilities.
- July 2022: Perryman Company announced a significant expansion of its titanium melting capacity by 16 Million pounds, increasing its total capacity to 42 Million pounds, strengthening its position as a global leader. This expansion demonstrates the growing demand for titanium alloys.
Future Outlook for Titanium Alloys Industry Market
The titanium alloys market is poised for robust growth, driven by continued demand from aerospace and automotive applications, and the development of new high-performance alloys for various emerging sectors. Strategic partnerships, technological advancements, and investments in R&D will shape the future of the industry, driving innovation and improving material properties to meet evolving market needs. The market is projected to continue its steady expansion, with significant growth expected in the Asia-Pacific region.
Titanium Alloys Industry Segmentation
-
1. Microstructure
- 1.1. Alpha and Near-alpha Alloy
- 1.2. Alpha-beta Alloy
- 1.3. Beta Alloy
-
2. End-user Industry
- 2.1. Aerospace
- 2.2. Automotive and Shipbuilding
- 2.3. Chemical
- 2.4. Power and Desalination
- 2.5. Other End-user Industries
Titanium Alloys Industry Segmentation By Geography
-
1. Asia Pacific
- 1.1. China
- 1.2. India
- 1.3. Japan
- 1.4. South Korea
- 1.5. Rest of Asia Pacific
-
2. North America
- 2.1. United States
- 2.2. Canada
- 2.3. Mexico
-
3. Europe
- 3.1. Germany
- 3.2. United Kingdom
- 3.3. Italy
- 3.4. France
- 3.5. Rest of Europe
-
4. Rest of the World
- 4.1. South America
- 4.2. Middle East and Africa
Titanium Alloys Industry Regional Market Share
Geographic Coverage of Titanium Alloys Industry
Titanium Alloys Industry REPORT HIGHLIGHTS
| Aspects | Details |
|---|---|
| Study Period | 2020-2034 |
| Base Year | 2025 |
| Estimated Year | 2026 |
| Forecast Period | 2026-2034 |
| Historical Period | 2020-2025 |
| Growth Rate | CAGR of 7.1% from 2020-2034 |
| Segmentation |
|
Table of Contents
- 1. Introduction
- 1.1. Research Scope
- 1.2. Market Segmentation
- 1.3. Research Objective
- 1.4. Definitions and Assumptions
- 2. Executive Summary
- 2.1. Market Snapshot
- 3. Market Dynamics
- 3.1. Market Drivers
- 3.2. Market Restrains
- 3.3. Market Trends
- 3.4. Market Opportunities
- 4. Market Factor Analysis
- 4.1. Porters Five Forces
- 4.1.1. Bargaining Power of Suppliers
- 4.1.2. Bargaining Power of Buyers
- 4.1.3. Threat of New Entrants
- 4.1.4. Threat of Substitutes
- 4.1.5. Competitive Rivalry
- 4.2. PESTEL analysis
- 4.3. BCG Analysis
- 4.3.1. Stars (High Growth, High Market Share)
- 4.3.2. Cash Cows (Low Growth, High Market Share)
- 4.3.3. Question Mark (High Growth, Low Market Share)
- 4.3.4. Dogs (Low Growth, Low Market Share)
- 4.4. Ansoff Matrix Analysis
- 4.5. Supply Chain Analysis
- 4.6. Regulatory Landscape
- 4.7. Current Market Potential and Opportunity Assessment (TAM–SAM–SOM Framework)
- 4.8. PRI Analyst Note
- 4.1. Porters Five Forces
- 5. Market Analysis, Insights and Forecast 2021-2033
- 5.1. Market Analysis, Insights and Forecast - by Microstructure
- 5.1.1. Alpha and Near-alpha Alloy
- 5.1.2. Alpha-beta Alloy
- 5.1.3. Beta Alloy
- 5.2. Market Analysis, Insights and Forecast - by End-user Industry
- 5.2.1. Aerospace
- 5.2.2. Automotive and Shipbuilding
- 5.2.3. Chemical
- 5.2.4. Power and Desalination
- 5.2.5. Other End-user Industries
- 5.3. Market Analysis, Insights and Forecast - by Region
- 5.3.1. Asia Pacific
- 5.3.2. North America
- 5.3.3. Europe
- 5.3.4. Rest of the World
- 5.1. Market Analysis, Insights and Forecast - by Microstructure
- 6. Global Titanium Alloys Industry Analysis, Insights and Forecast, 2021-2033
- 6.1. Market Analysis, Insights and Forecast - by Microstructure
- 6.1.1. Alpha and Near-alpha Alloy
- 6.1.2. Alpha-beta Alloy
- 6.1.3. Beta Alloy
- 6.2. Market Analysis, Insights and Forecast - by End-user Industry
- 6.2.1. Aerospace
- 6.2.2. Automotive and Shipbuilding
- 6.2.3. Chemical
- 6.2.4. Power and Desalination
- 6.2.5. Other End-user Industries
- 6.1. Market Analysis, Insights and Forecast - by Microstructure
- 7. Asia Pacific Titanium Alloys Industry Analysis, Insights and Forecast, 2020-2032
- 7.1. Market Analysis, Insights and Forecast - by Microstructure
- 7.1.1. Alpha and Near-alpha Alloy
- 7.1.2. Alpha-beta Alloy
- 7.1.3. Beta Alloy
- 7.2. Market Analysis, Insights and Forecast - by End-user Industry
- 7.2.1. Aerospace
- 7.2.2. Automotive and Shipbuilding
- 7.2.3. Chemical
- 7.2.4. Power and Desalination
- 7.2.5. Other End-user Industries
- 7.1. Market Analysis, Insights and Forecast - by Microstructure
- 8. North America Titanium Alloys Industry Analysis, Insights and Forecast, 2020-2032
- 8.1. Market Analysis, Insights and Forecast - by Microstructure
- 8.1.1. Alpha and Near-alpha Alloy
- 8.1.2. Alpha-beta Alloy
- 8.1.3. Beta Alloy
- 8.2. Market Analysis, Insights and Forecast - by End-user Industry
- 8.2.1. Aerospace
- 8.2.2. Automotive and Shipbuilding
- 8.2.3. Chemical
- 8.2.4. Power and Desalination
- 8.2.5. Other End-user Industries
- 8.1. Market Analysis, Insights and Forecast - by Microstructure
- 9. Europe Titanium Alloys Industry Analysis, Insights and Forecast, 2020-2032
- 9.1. Market Analysis, Insights and Forecast - by Microstructure
- 9.1.1. Alpha and Near-alpha Alloy
- 9.1.2. Alpha-beta Alloy
- 9.1.3. Beta Alloy
- 9.2. Market Analysis, Insights and Forecast - by End-user Industry
- 9.2.1. Aerospace
- 9.2.2. Automotive and Shipbuilding
- 9.2.3. Chemical
- 9.2.4. Power and Desalination
- 9.2.5. Other End-user Industries
- 9.1. Market Analysis, Insights and Forecast - by Microstructure
- 10. Rest of the World Titanium Alloys Industry Analysis, Insights and Forecast, 2020-2032
- 10.1. Market Analysis, Insights and Forecast - by Microstructure
- 10.1.1. Alpha and Near-alpha Alloy
- 10.1.2. Alpha-beta Alloy
- 10.1.3. Beta Alloy
- 10.2. Market Analysis, Insights and Forecast - by End-user Industry
- 10.2.1. Aerospace
- 10.2.2. Automotive and Shipbuilding
- 10.2.3. Chemical
- 10.2.4. Power and Desalination
- 10.2.5. Other End-user Industries
- 10.1. Market Analysis, Insights and Forecast - by Microstructure
- 11. Competitive Analysis
- 11.1. Company Profiles
- 11.1.1 Hermith GmbH
- 11.1.1.1. Company Overview
- 11.1.1.2. Products
- 11.1.1.3. Company Financials
- 11.1.1.4. SWOT Analysis
- 11.1.2 BRISMET
- 11.1.2.1. Company Overview
- 11.1.2.2. Products
- 11.1.2.3. Company Financials
- 11.1.2.4. SWOT Analysis
- 11.1.3 Weber Metals (OTTO FUCHS COMPANY)*List Not Exhaustive
- 11.1.3.1. Company Overview
- 11.1.3.2. Products
- 11.1.3.3. Company Financials
- 11.1.3.4. SWOT Analysis
- 11.1.4 Perryman Company
- 11.1.4.1. Company Overview
- 11.1.4.2. Products
- 11.1.4.3. Company Financials
- 11.1.4.4. SWOT Analysis
- 11.1.5 KOBE STEEL LTD
- 11.1.5.1. Company Overview
- 11.1.5.2. Products
- 11.1.5.3. Company Financials
- 11.1.5.4. SWOT Analysis
- 11.1.6 ATI
- 11.1.6.1. Company Overview
- 11.1.6.2. Products
- 11.1.6.3. Company Financials
- 11.1.6.4. SWOT Analysis
- 11.1.7 Daido Steel Co Ltd
- 11.1.7.1. Company Overview
- 11.1.7.2. Products
- 11.1.7.3. Company Financials
- 11.1.7.4. SWOT Analysis
- 11.1.8 Toho Titanium Co Ltd
- 11.1.8.1. Company Overview
- 11.1.8.2. Products
- 11.1.8.3. Company Financials
- 11.1.8.4. SWOT Analysis
- 11.1.9 VSMPO-AVISMA Corporation
- 11.1.9.1. Company Overview
- 11.1.9.2. Products
- 11.1.9.3. Company Financials
- 11.1.9.4. SWOT Analysis
- 11.1.10 Howmet Aerospace
- 11.1.10.1. Company Overview
- 11.1.10.2. Products
- 11.1.10.3. Company Financials
- 11.1.10.4. SWOT Analysis
- 11.1.11 CRS Holdings LLC
- 11.1.11.1. Company Overview
- 11.1.11.2. Products
- 11.1.11.3. Company Financials
- 11.1.11.4. SWOT Analysis
- 11.1.12 Eramet
- 11.1.12.1. Company Overview
- 11.1.12.2. Products
- 11.1.12.3. Company Financials
- 11.1.12.4. SWOT Analysis
- 11.1.13 M/s Bansal Brothers
- 11.1.13.1. Company Overview
- 11.1.13.2. Products
- 11.1.13.3. Company Financials
- 11.1.13.4. SWOT Analysis
- 11.1.14 AMG Advanced Metallurgical Group N V
- 11.1.14.1. Company Overview
- 11.1.14.2. Products
- 11.1.14.3. Company Financials
- 11.1.14.4. SWOT Analysis
- 11.1.15 Mishra Dhatu Nigam Limited
- 11.1.15.1. Company Overview
- 11.1.15.2. Products
- 11.1.15.3. Company Financials
- 11.1.15.4. SWOT Analysis
- 11.1.16 TIMET (Precision Castparts Corp )
- 11.1.16.1. Company Overview
- 11.1.16.2. Products
- 11.1.16.3. Company Financials
- 11.1.16.4. SWOT Analysis
- 11.1.1 Hermith GmbH
- 11.2. Market Entropy
- 11.2.1 Company's Key Areas Served
- 11.2.2 Recent Developments
- 11.3. Company Market Share Analysis 2025
- 11.3.1 Top 5 Companies Market Share Analysis
- 11.3.2 Top 3 Companies Market Share Analysis
- 11.4. List of Potential Customers
- 12. Research Methodology
List of Figures
- Figure 1: Global Titanium Alloys Industry Revenue Breakdown (billion, %) by Region 2025 & 2033
- Figure 2: Asia Pacific Titanium Alloys Industry Revenue (billion), by Microstructure 2025 & 2033
- Figure 3: Asia Pacific Titanium Alloys Industry Revenue Share (%), by Microstructure 2025 & 2033
- Figure 4: Asia Pacific Titanium Alloys Industry Revenue (billion), by End-user Industry 2025 & 2033
- Figure 5: Asia Pacific Titanium Alloys Industry Revenue Share (%), by End-user Industry 2025 & 2033
- Figure 6: Asia Pacific Titanium Alloys Industry Revenue (billion), by Country 2025 & 2033
- Figure 7: Asia Pacific Titanium Alloys Industry Revenue Share (%), by Country 2025 & 2033
- Figure 8: North America Titanium Alloys Industry Revenue (billion), by Microstructure 2025 & 2033
- Figure 9: North America Titanium Alloys Industry Revenue Share (%), by Microstructure 2025 & 2033
- Figure 10: North America Titanium Alloys Industry Revenue (billion), by End-user Industry 2025 & 2033
- Figure 11: North America Titanium Alloys Industry Revenue Share (%), by End-user Industry 2025 & 2033
- Figure 12: North America Titanium Alloys Industry Revenue (billion), by Country 2025 & 2033
- Figure 13: North America Titanium Alloys Industry Revenue Share (%), by Country 2025 & 2033
- Figure 14: Europe Titanium Alloys Industry Revenue (billion), by Microstructure 2025 & 2033
- Figure 15: Europe Titanium Alloys Industry Revenue Share (%), by Microstructure 2025 & 2033
- Figure 16: Europe Titanium Alloys Industry Revenue (billion), by End-user Industry 2025 & 2033
- Figure 17: Europe Titanium Alloys Industry Revenue Share (%), by End-user Industry 2025 & 2033
- Figure 18: Europe Titanium Alloys Industry Revenue (billion), by Country 2025 & 2033
- Figure 19: Europe Titanium Alloys Industry Revenue Share (%), by Country 2025 & 2033
- Figure 20: Rest of the World Titanium Alloys Industry Revenue (billion), by Microstructure 2025 & 2033
- Figure 21: Rest of the World Titanium Alloys Industry Revenue Share (%), by Microstructure 2025 & 2033
- Figure 22: Rest of the World Titanium Alloys Industry Revenue (billion), by End-user Industry 2025 & 2033
- Figure 23: Rest of the World Titanium Alloys Industry Revenue Share (%), by End-user Industry 2025 & 2033
- Figure 24: Rest of the World Titanium Alloys Industry Revenue (billion), by Country 2025 & 2033
- Figure 25: Rest of the World Titanium Alloys Industry Revenue Share (%), by Country 2025 & 2033
List of Tables
- Table 1: Global Titanium Alloys Industry Revenue billion Forecast, by Microstructure 2020 & 2033
- Table 2: Global Titanium Alloys Industry Revenue billion Forecast, by End-user Industry 2020 & 2033
- Table 3: Global Titanium Alloys Industry Revenue billion Forecast, by Region 2020 & 2033
- Table 4: Global Titanium Alloys Industry Revenue billion Forecast, by Microstructure 2020 & 2033
- Table 5: Global Titanium Alloys Industry Revenue billion Forecast, by End-user Industry 2020 & 2033
- Table 6: Global Titanium Alloys Industry Revenue billion Forecast, by Country 2020 & 2033
- Table 7: China Titanium Alloys Industry Revenue (billion) Forecast, by Application 2020 & 2033
- Table 8: India Titanium Alloys Industry Revenue (billion) Forecast, by Application 2020 & 2033
- Table 9: Japan Titanium Alloys Industry Revenue (billion) Forecast, by Application 2020 & 2033
- Table 10: South Korea Titanium Alloys Industry Revenue (billion) Forecast, by Application 2020 & 2033
- Table 11: Rest of Asia Pacific Titanium Alloys Industry Revenue (billion) Forecast, by Application 2020 & 2033
- Table 12: Global Titanium Alloys Industry Revenue billion Forecast, by Microstructure 2020 & 2033
- Table 13: Global Titanium Alloys Industry Revenue billion Forecast, by End-user Industry 2020 & 2033
- Table 14: Global Titanium Alloys Industry Revenue billion Forecast, by Country 2020 & 2033
- Table 15: United States Titanium Alloys Industry Revenue (billion) Forecast, by Application 2020 & 2033
- Table 16: Canada Titanium Alloys Industry Revenue (billion) Forecast, by Application 2020 & 2033
- Table 17: Mexico Titanium Alloys Industry Revenue (billion) Forecast, by Application 2020 & 2033
- Table 18: Global Titanium Alloys Industry Revenue billion Forecast, by Microstructure 2020 & 2033
- Table 19: Global Titanium Alloys Industry Revenue billion Forecast, by End-user Industry 2020 & 2033
- Table 20: Global Titanium Alloys Industry Revenue billion Forecast, by Country 2020 & 2033
- Table 21: Germany Titanium Alloys Industry Revenue (billion) Forecast, by Application 2020 & 2033
- Table 22: United Kingdom Titanium Alloys Industry Revenue (billion) Forecast, by Application 2020 & 2033
- Table 23: Italy Titanium Alloys Industry Revenue (billion) Forecast, by Application 2020 & 2033
- Table 24: France Titanium Alloys Industry Revenue (billion) Forecast, by Application 2020 & 2033
- Table 25: Rest of Europe Titanium Alloys Industry Revenue (billion) Forecast, by Application 2020 & 2033
- Table 26: Global Titanium Alloys Industry Revenue billion Forecast, by Microstructure 2020 & 2033
- Table 27: Global Titanium Alloys Industry Revenue billion Forecast, by End-user Industry 2020 & 2033
- Table 28: Global Titanium Alloys Industry Revenue billion Forecast, by Country 2020 & 2033
- Table 29: South America Titanium Alloys Industry Revenue (billion) Forecast, by Application 2020 & 2033
- Table 30: Middle East and Africa Titanium Alloys Industry Revenue (billion) Forecast, by Application 2020 & 2033
Frequently Asked Questions
1. What is the projected Compound Annual Growth Rate (CAGR) of the Titanium Alloys Industry?
The projected CAGR is approximately 7.1%.
2. Which companies are prominent players in the Titanium Alloys Industry?
Key companies in the market include Hermith GmbH, BRISMET, Weber Metals (OTTO FUCHS COMPANY)*List Not Exhaustive, Perryman Company, KOBE STEEL LTD, ATI, Daido Steel Co Ltd, Toho Titanium Co Ltd, VSMPO-AVISMA Corporation, Howmet Aerospace, CRS Holdings LLC, Eramet, M/s Bansal Brothers, AMG Advanced Metallurgical Group N V, Mishra Dhatu Nigam Limited, TIMET (Precision Castparts Corp ).
3. What are the main segments of the Titanium Alloys Industry?
The market segments include Microstructure, End-user Industry.
4. Can you provide details about the market size?
The market size is estimated to be USD 30.34 billion as of 2022.
5. What are some drivers contributing to market growth?
Growing Usage of Titanium Alloys in the Aerospace Sector; Increasing Demand for Titanium Alloys for Combat Vehicles to Replace Steel and Aluminum.
6. What are the notable trends driving market growth?
Increasing Demand of Titanium Alloys in the Aerospace Industry.
7. Are there any restraints impacting market growth?
High Reactivity of Alloy Demands Specialized Care During Production; Other Restraints.
8. Can you provide examples of recent developments in the market?
In November 2022, PTC Industries and Defence PSU Mishra Dhatu Nigam (MIDHANI) signed a memorandum of understanding (MOU) for a technological partnership. In accordance with their MOU, PTC Industries and Midhani will make use of each other's technological resources to manufacture titanium alloy pipes and tubes using locally processed raw materials; manufacture titanium alloy plates and sheets; and fabricate critical parts and LRUs for the defense and aerospace industries using PTC's advanced machining facility and Midhani's forged and rolled products.
9. What pricing options are available for accessing the report?
Pricing options include single-user, multi-user, and enterprise licenses priced at USD 4750, USD 5250, and USD 8750 respectively.
10. Is the market size provided in terms of value or volume?
The market size is provided in terms of value, measured in billion.
11. Are there any specific market keywords associated with the report?
Yes, the market keyword associated with the report is "Titanium Alloys Industry," which aids in identifying and referencing the specific market segment covered.
12. How do I determine which pricing option suits my needs best?
The pricing options vary based on user requirements and access needs. Individual users may opt for single-user licenses, while businesses requiring broader access may choose multi-user or enterprise licenses for cost-effective access to the report.
13. Are there any additional resources or data provided in the Titanium Alloys Industry report?
While the report offers comprehensive insights, it's advisable to review the specific contents or supplementary materials provided to ascertain if additional resources or data are available.
14. How can I stay updated on further developments or reports in the Titanium Alloys Industry?
To stay informed about further developments, trends, and reports in the Titanium Alloys Industry, consider subscribing to industry newsletters, following relevant companies and organizations, or regularly checking reputable industry news sources and publications.
Methodology
Step 1 - Identification of Relevant Samples Size from Population Database


Step 2 - Approaches for Defining Global Market Size (Value, Volume* & Price*)

Note*: In applicable scenarios
Step 3 - Data Sources
Primary Research
- Web Analytics
- Survey Reports
- Research Institute
- Latest Research Reports
- Opinion Leaders
Secondary Research
- Annual Reports
- White Paper
- Latest Press Release
- Industry Association
- Paid Database
- Investor Presentations

Step 4 - Data Triangulation
Involves using different sources of information in order to increase the validity of a study
These sources are likely to be stakeholders in a program - participants, other researchers, program staff, other community members, and so on.
Then we put all data in single framework & apply various statistical tools to find out the dynamic on the market.
During the analysis stage, feedback from the stakeholder groups would be compared to determine areas of agreement as well as areas of divergence