Key Insights
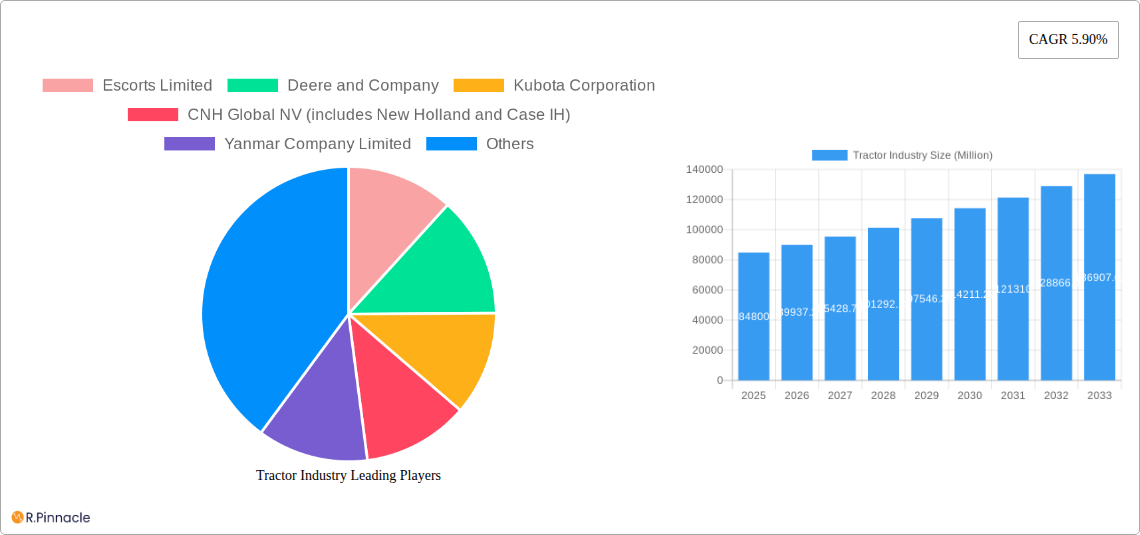
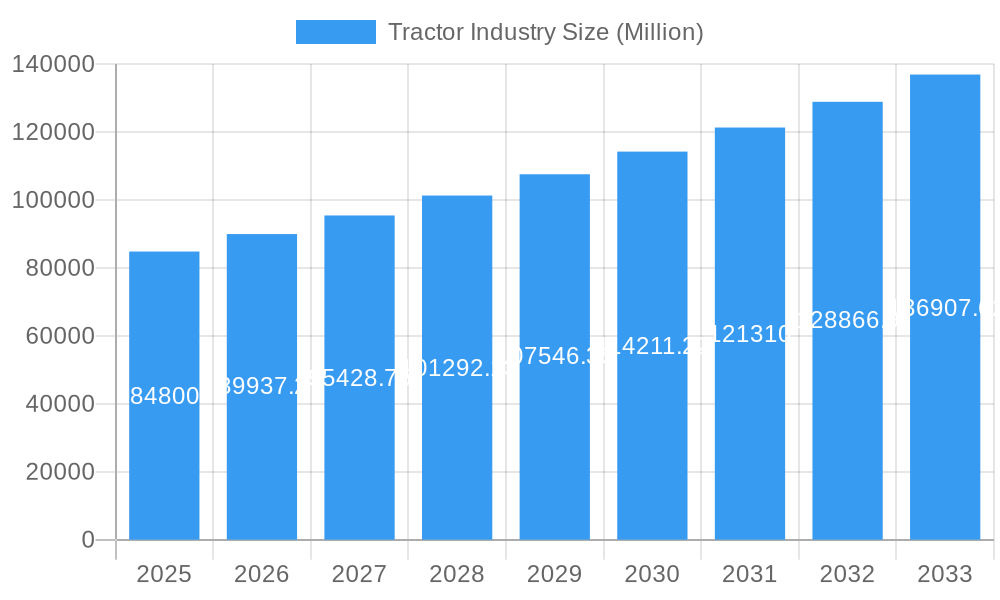
The global tractor market, valued at $84.80 billion in 2025, is projected to experience robust growth, driven by a Compound Annual Growth Rate (CAGR) of 5.90% from 2025 to 2033. This expansion is fueled by several key factors. Increasing global food demand necessitates higher agricultural output, leading to greater tractor adoption. Technological advancements, such as precision farming technologies (GPS-guided tractors, automated steering, and yield monitoring systems), are boosting efficiency and productivity, making tractors more attractive investments for farmers. Furthermore, government initiatives promoting agricultural mechanization in developing economies are contributing significantly to market growth. The market is segmented by horsepower (below 40 HP, 40-100 HP, above 100 HP) and drive type (two-wheel drive, four-wheel drive/all-wheel drive), reflecting diverse farming needs and terrains. Key players like Deere & Company, Kubota, and Mahindra & Mahindra are driving innovation and expanding their market reach through strategic partnerships and product diversification. Regional variations exist, with North America and Europe representing mature markets while Asia-Pacific shows substantial growth potential due to its large agricultural sector and rising farmer incomes. The market faces challenges such as fluctuating fuel prices, stringent emission norms, and the increasing availability of alternative farming technologies. However, the long-term outlook remains positive, driven by consistent agricultural demand and technological innovations.
Tractor Industry Market Size (In Billion)
The competitive landscape is characterized by a mix of established global players and regional manufacturers. Major players are focusing on developing fuel-efficient and technologically advanced tractors to cater to the evolving needs of farmers. The integration of smart technologies and data analytics is reshaping the industry, creating opportunities for specialized services and solutions related to farm management. The focus on sustainability and reduced environmental impact is also influencing tractor design and manufacturing, with a shift towards electric and hybrid models gaining momentum. Market growth will likely be uneven across regions, reflecting differences in agricultural practices, economic development, and government policies. Continued innovation, strategic partnerships, and a focus on meeting the diverse needs of farmers across different regions will be crucial for success in this dynamic market.
Tractor Industry Company Market Share
Tractor Industry Market Report: 2019-2033
This comprehensive report provides an in-depth analysis of the global tractor industry, offering valuable insights for industry professionals, investors, and stakeholders. Covering the period from 2019 to 2033, with a focus on 2025, this report analyzes market dynamics, key players, and future trends, highlighting opportunities and challenges within this evolving sector. The report uses USD Million for all monetary values.
Tractor Industry Market Structure & Innovation Trends
The global tractor market is characterized by a moderate level of concentration, with key players like Deere & Company, Mahindra & Mahindra, and CNH Global holding significant market share. However, the presence of numerous regional and specialized manufacturers fosters competition. Innovation is driven by the need for increased efficiency, automation, and sustainability in agricultural practices. Stringent emission regulations are shaping technological advancements, pushing the industry towards electric and alternative fuel-powered tractors. Mergers and acquisitions (M&A) play a significant role in shaping the market landscape, with recent deals reflecting a focus on expanding geographical reach and technological capabilities. For example, CNH's USD 50 million investment in India showcases this trend.
- Market Concentration: Moderate, with a few dominant players and many smaller regional players.
- Innovation Drivers: Efficiency gains, automation, sustainability, and emission regulations.
- Regulatory Framework: Stringent emission standards and safety regulations influencing product development.
- Product Substitutes: Limited, but alternative farming techniques and mechanization methods pose some competition.
- End-User Demographics: Primarily farmers, but also includes construction, landscaping, and industrial applications.
- M&A Activity: Significant activity focusing on geographical expansion and technological acquisition. Recent M&A deal values in the tractor industry are estimated to reach xx Million USD annually.
Tractor Industry Market Dynamics & Trends
The tractor industry is experiencing steady growth, driven by rising global food demand, increasing farm mechanization in developing economies, and government initiatives promoting agricultural modernization. Technological advancements, particularly in automation and precision farming, are reshaping the industry. Consumer preferences are shifting towards fuel-efficient, technologically advanced tractors with enhanced operator comfort and safety features. The competitive landscape is intense, with manufacturers vying for market share through innovation, strategic partnerships, and aggressive marketing strategies. The CAGR for the period 2025-2033 is estimated at xx%, with market penetration driven primarily by emerging economies.
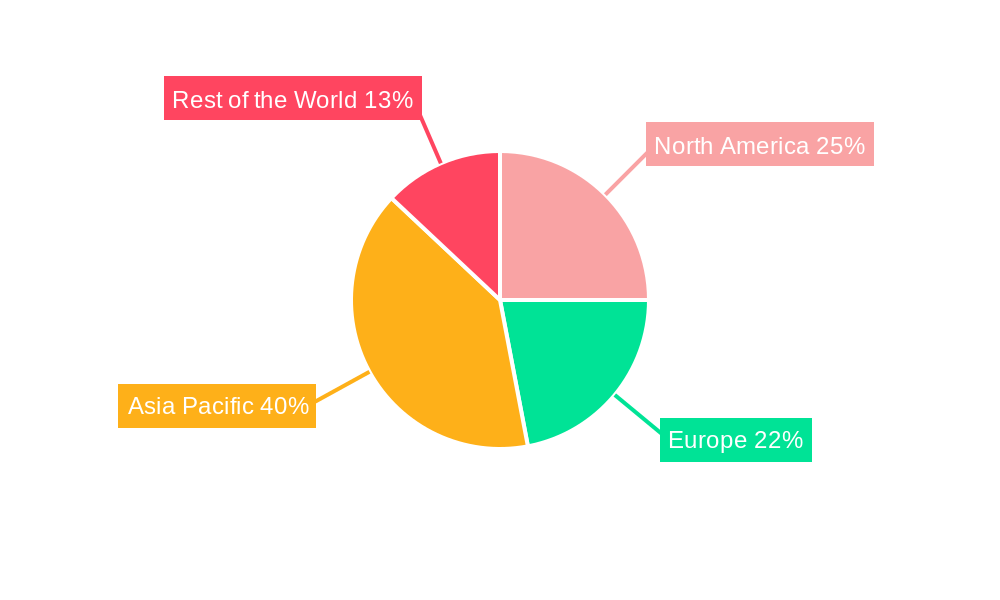
Dominant Regions & Segments in Tractor Industry
The dominant regions for tractor sales are North America, Europe, and Asia-Pacific, with significant growth potential in developing countries. Within the segment analysis:
- By Horsepower: The 40 HP - 100 HP segment holds the largest market share, driven by its versatility and affordability.
- By Drive Type: Four-wheel drive/all-wheel drive tractors are gaining popularity due to enhanced traction and performance in diverse terrains.
Key Drivers:
- Economic Policies: Government subsidies and agricultural support programs.
- Infrastructure: Improved rural infrastructure facilitating easier access and operation of tractors.
North America currently leads the market, boosted by high agricultural productivity and strong demand. However, Asia-Pacific is projected to show the highest growth due to increasing agricultural land under cultivation and government support.
Tractor Industry Product Innovations
Recent innovations include autonomous tractors, electric tractors (like the SV Solis electric tractor), and tractors equipped with advanced precision farming technologies like GPS guidance and variable rate application systems. These advancements aim to improve efficiency, reduce labor costs, and minimize environmental impact, catering to the growing demand for sustainable agricultural practices.
Report Scope & Segmentation Analysis
This report segments the tractor market by horsepower (Below 40 HP, 40 HP - 100 HP, Above 100 HP) and drive type (Two-wheel Drive, Four-wheel Drive/All-wheel Drive). Each segment showcases varying growth projections based on regional demand and technological adoption rates. Market sizes are projected to reach xx Million USD by 2033 across all segments, with the 40-100 HP segment holding the largest market value. Competitive dynamics within each segment vary, with some experiencing higher levels of competition than others.
Key Drivers of Tractor Industry Growth
The key drivers of tractor industry growth include:
- Technological Advancements: Automation, precision farming technologies, and electric/alternative fuel options.
- Economic Growth: Expanding agricultural sector and rising disposable incomes in developing countries.
- Government Regulations: Policies supporting agricultural modernization and sustainable farming practices.
Challenges in the Tractor Industry Sector
The tractor industry faces challenges such as:
- Supply Chain Disruptions: Impacts on component sourcing and manufacturing processes.
- Rising Raw Material Costs: Increasing prices of steel, rubber, and other materials.
- Intense Competition: Pressure on pricing and margins from established and emerging players.
Emerging Opportunities in Tractor Industry
Emerging opportunities include:
- Precision Farming Technologies: Expanding adoption of GPS-guided systems and data analytics in agriculture.
- Autonomous Tractors: Growing demand for automated systems to address labor shortages.
- Electric and Alternative Fuel Tractors: Increasing focus on environmentally friendly solutions.
Leading Players in the Tractor Industry Market
- Escorts Limited
- Deere and Company
- Kubota Corporation
- CNH Global NV
- Yanmar Company Limited
- Kuhn Group (Subsidiary of Bucher Industries)
- Deutz-Fah
- Mahindra and Mahindra Corporation
- CLAAS KGaA mbH
- Tractors and Farm Equipment Limited (TAFE)
- AGCO Corporation
Key Developments in Tractor Industry
- March 2024: Hyster Company's USD 60 million investment in 10 battery-powered terminal tractors highlights the shift towards electric solutions in specialized tractor segments.
- October 2023: International Tractors Limited (ITL)'s launch of the SV Solis electric tractor underscores the growing importance of sustainable and technologically advanced agricultural equipment.
- May 2023: CNH's USD 50 million investment in India signals the increasing focus on emerging markets and agricultural modernization.
- September 2022: KAMAZ PJSC's expansion into gas-powered vehicles reflects the industry's exploration of alternative fuel sources.
- August 2022: Foxconn's manufacturing agreement with Monarch Tractor signifies the integration of technology giants into the autonomous tractor segment.
- July 2022: Ashok Leyland's introduction of new 4x2 tractors demonstrates ongoing innovation within the traditional tractor market.
Future Outlook for Tractor Industry Market
The future of the tractor industry is promising, driven by ongoing technological advancements, increasing global food demand, and supportive government policies. The adoption of precision farming, automation, and sustainable technologies will continue to shape market dynamics. Strategic partnerships and collaborations will play a vital role in fostering innovation and expanding market access. The industry is poised for continued growth, particularly in emerging economies where agricultural mechanization is still in its early stages.
Tractor Industry Segmentation
-
1. Horsepower
- 1.1. Below 40 HP
- 1.2. 40 HP - 100 HP
- 1.3. Above 100 HP
-
2. Drive Type
- 2.1. Two-wheel Drive
- 2.2. Four-wheel Drive/All-wheel Drive
Tractor Industry Segmentation By Geography
-
1. North America
- 1.1. United States
- 1.2. Canada
- 1.3. Rest of North America
-
2. Europe
- 2.1. Germany
- 2.2. United Kingdom
- 2.3. France
- 2.4. Spain
- 2.5. Italy
- 2.6. Rest of Europe
-
3. Asia Pacific
- 3.1. China
- 3.2. Japan
- 3.3. India
- 3.4. South Korea
- 3.5. Rest of Asia Pacific
-
4. Rest of the World
- 4.1. South America
- 4.2. Middle East and Africa
Tractor Industry Regional Market Share
Geographic Coverage of Tractor Industry
Tractor Industry REPORT HIGHLIGHTS
| Aspects | Details |
|---|---|
| Study Period | 2020-2034 |
| Base Year | 2025 |
| Estimated Year | 2026 |
| Forecast Period | 2026-2034 |
| Historical Period | 2020-2025 |
| Growth Rate | CAGR of 5.90% from 2020-2034 |
| Segmentation |
|
Table of Contents
- 1. Introduction
- 1.1. Research Scope
- 1.2. Market Segmentation
- 1.3. Research Objective
- 1.4. Definitions and Assumptions
- 2. Executive Summary
- 2.1. Market Snapshot
- 3. Market Dynamics
- 3.1. Market Drivers
- 3.2. Market Restrains
- 3.3. Market Trends
- 3.4. Market Opportunities
- 4. Market Factor Analysis
- 4.1. Porters Five Forces
- 4.1.1. Bargaining Power of Suppliers
- 4.1.2. Bargaining Power of Buyers
- 4.1.3. Threat of New Entrants
- 4.1.4. Threat of Substitutes
- 4.1.5. Competitive Rivalry
- 4.2. PESTEL analysis
- 4.3. BCG Analysis
- 4.3.1. Stars (High Growth, High Market Share)
- 4.3.2. Cash Cows (Low Growth, High Market Share)
- 4.3.3. Question Mark (High Growth, Low Market Share)
- 4.3.4. Dogs (Low Growth, Low Market Share)
- 4.4. Ansoff Matrix Analysis
- 4.5. Supply Chain Analysis
- 4.6. Regulatory Landscape
- 4.7. Current Market Potential and Opportunity Assessment (TAM–SAM–SOM Framework)
- 4.8. PRI Analyst Note
- 4.1. Porters Five Forces
- 5. Market Analysis, Insights and Forecast 2021-2033
- 5.1. Market Analysis, Insights and Forecast - by Horsepower
- 5.1.1. Below 40 HP
- 5.1.2. 40 HP - 100 HP
- 5.1.3. Above 100 HP
- 5.2. Market Analysis, Insights and Forecast - by Drive Type
- 5.2.1. Two-wheel Drive
- 5.2.2. Four-wheel Drive/All-wheel Drive
- 5.3. Market Analysis, Insights and Forecast - by Region
- 5.3.1. North America
- 5.3.2. Europe
- 5.3.3. Asia Pacific
- 5.3.4. Rest of the World
- 5.1. Market Analysis, Insights and Forecast - by Horsepower
- 6. Global Tractor Industry Analysis, Insights and Forecast, 2021-2033
- 6.1. Market Analysis, Insights and Forecast - by Horsepower
- 6.1.1. Below 40 HP
- 6.1.2. 40 HP - 100 HP
- 6.1.3. Above 100 HP
- 6.2. Market Analysis, Insights and Forecast - by Drive Type
- 6.2.1. Two-wheel Drive
- 6.2.2. Four-wheel Drive/All-wheel Drive
- 6.1. Market Analysis, Insights and Forecast - by Horsepower
- 7. North America Tractor Industry Analysis, Insights and Forecast, 2020-2032
- 7.1. Market Analysis, Insights and Forecast - by Horsepower
- 7.1.1. Below 40 HP
- 7.1.2. 40 HP - 100 HP
- 7.1.3. Above 100 HP
- 7.2. Market Analysis, Insights and Forecast - by Drive Type
- 7.2.1. Two-wheel Drive
- 7.2.2. Four-wheel Drive/All-wheel Drive
- 7.1. Market Analysis, Insights and Forecast - by Horsepower
- 8. Europe Tractor Industry Analysis, Insights and Forecast, 2020-2032
- 8.1. Market Analysis, Insights and Forecast - by Horsepower
- 8.1.1. Below 40 HP
- 8.1.2. 40 HP - 100 HP
- 8.1.3. Above 100 HP
- 8.2. Market Analysis, Insights and Forecast - by Drive Type
- 8.2.1. Two-wheel Drive
- 8.2.2. Four-wheel Drive/All-wheel Drive
- 8.1. Market Analysis, Insights and Forecast - by Horsepower
- 9. Asia Pacific Tractor Industry Analysis, Insights and Forecast, 2020-2032
- 9.1. Market Analysis, Insights and Forecast - by Horsepower
- 9.1.1. Below 40 HP
- 9.1.2. 40 HP - 100 HP
- 9.1.3. Above 100 HP
- 9.2. Market Analysis, Insights and Forecast - by Drive Type
- 9.2.1. Two-wheel Drive
- 9.2.2. Four-wheel Drive/All-wheel Drive
- 9.1. Market Analysis, Insights and Forecast - by Horsepower
- 10. Rest of the World Tractor Industry Analysis, Insights and Forecast, 2020-2032
- 10.1. Market Analysis, Insights and Forecast - by Horsepower
- 10.1.1. Below 40 HP
- 10.1.2. 40 HP - 100 HP
- 10.1.3. Above 100 HP
- 10.2. Market Analysis, Insights and Forecast - by Drive Type
- 10.2.1. Two-wheel Drive
- 10.2.2. Four-wheel Drive/All-wheel Drive
- 10.1. Market Analysis, Insights and Forecast - by Horsepower
- 11. Competitive Analysis
- 11.1. Company Profiles
- 11.1.1 Escorts Limited
- 11.1.1.1. Company Overview
- 11.1.1.2. Products
- 11.1.1.3. Company Financials
- 11.1.1.4. SWOT Analysis
- 11.1.2 Deere and Company
- 11.1.2.1. Company Overview
- 11.1.2.2. Products
- 11.1.2.3. Company Financials
- 11.1.2.4. SWOT Analysis
- 11.1.3 Kubota Corporation
- 11.1.3.1. Company Overview
- 11.1.3.2. Products
- 11.1.3.3. Company Financials
- 11.1.3.4. SWOT Analysis
- 11.1.4 CNH Global NV (includes New Holland and Case IH)
- 11.1.4.1. Company Overview
- 11.1.4.2. Products
- 11.1.4.3. Company Financials
- 11.1.4.4. SWOT Analysis
- 11.1.5 Yanmar Company Limited
- 11.1.5.1. Company Overview
- 11.1.5.2. Products
- 11.1.5.3. Company Financials
- 11.1.5.4. SWOT Analysis
- 11.1.6 Kuhn Group (Subsidiary of Bucher Industries)
- 11.1.6.1. Company Overview
- 11.1.6.2. Products
- 11.1.6.3. Company Financials
- 11.1.6.4. SWOT Analysis
- 11.1.7 Deutz-Fah
- 11.1.7.1. Company Overview
- 11.1.7.2. Products
- 11.1.7.3. Company Financials
- 11.1.7.4. SWOT Analysis
- 11.1.8 Mahindra and Mahindra Corporation
- 11.1.8.1. Company Overview
- 11.1.8.2. Products
- 11.1.8.3. Company Financials
- 11.1.8.4. SWOT Analysis
- 11.1.9 CLAAS KGaA mbH
- 11.1.9.1. Company Overview
- 11.1.9.2. Products
- 11.1.9.3. Company Financials
- 11.1.9.4. SWOT Analysis
- 11.1.10 Tractors and Farm Equipment Limited (TAFE)
- 11.1.10.1. Company Overview
- 11.1.10.2. Products
- 11.1.10.3. Company Financials
- 11.1.10.4. SWOT Analysis
- 11.1.11 AGCO Corporation (includes Massey Ferguson Valtra Fendt and Challenger)
- 11.1.11.1. Company Overview
- 11.1.11.2. Products
- 11.1.11.3. Company Financials
- 11.1.11.4. SWOT Analysis
- 11.1.1 Escorts Limited
- 11.2. Market Entropy
- 11.2.1 Company's Key Areas Served
- 11.2.2 Recent Developments
- 11.3. Company Market Share Analysis 2025
- 11.3.1 Top 5 Companies Market Share Analysis
- 11.3.2 Top 3 Companies Market Share Analysis
- 11.4. List of Potential Customers
- 12. Research Methodology
List of Figures
- Figure 1: Global Tractor Industry Revenue Breakdown (Million, %) by Region 2025 & 2033
- Figure 2: North America Tractor Industry Revenue (Million), by Horsepower 2025 & 2033
- Figure 3: North America Tractor Industry Revenue Share (%), by Horsepower 2025 & 2033
- Figure 4: North America Tractor Industry Revenue (Million), by Drive Type 2025 & 2033
- Figure 5: North America Tractor Industry Revenue Share (%), by Drive Type 2025 & 2033
- Figure 6: North America Tractor Industry Revenue (Million), by Country 2025 & 2033
- Figure 7: North America Tractor Industry Revenue Share (%), by Country 2025 & 2033
- Figure 8: Europe Tractor Industry Revenue (Million), by Horsepower 2025 & 2033
- Figure 9: Europe Tractor Industry Revenue Share (%), by Horsepower 2025 & 2033
- Figure 10: Europe Tractor Industry Revenue (Million), by Drive Type 2025 & 2033
- Figure 11: Europe Tractor Industry Revenue Share (%), by Drive Type 2025 & 2033
- Figure 12: Europe Tractor Industry Revenue (Million), by Country 2025 & 2033
- Figure 13: Europe Tractor Industry Revenue Share (%), by Country 2025 & 2033
- Figure 14: Asia Pacific Tractor Industry Revenue (Million), by Horsepower 2025 & 2033
- Figure 15: Asia Pacific Tractor Industry Revenue Share (%), by Horsepower 2025 & 2033
- Figure 16: Asia Pacific Tractor Industry Revenue (Million), by Drive Type 2025 & 2033
- Figure 17: Asia Pacific Tractor Industry Revenue Share (%), by Drive Type 2025 & 2033
- Figure 18: Asia Pacific Tractor Industry Revenue (Million), by Country 2025 & 2033
- Figure 19: Asia Pacific Tractor Industry Revenue Share (%), by Country 2025 & 2033
- Figure 20: Rest of the World Tractor Industry Revenue (Million), by Horsepower 2025 & 2033
- Figure 21: Rest of the World Tractor Industry Revenue Share (%), by Horsepower 2025 & 2033
- Figure 22: Rest of the World Tractor Industry Revenue (Million), by Drive Type 2025 & 2033
- Figure 23: Rest of the World Tractor Industry Revenue Share (%), by Drive Type 2025 & 2033
- Figure 24: Rest of the World Tractor Industry Revenue (Million), by Country 2025 & 2033
- Figure 25: Rest of the World Tractor Industry Revenue Share (%), by Country 2025 & 2033
List of Tables
- Table 1: Global Tractor Industry Revenue Million Forecast, by Horsepower 2020 & 2033
- Table 2: Global Tractor Industry Revenue Million Forecast, by Drive Type 2020 & 2033
- Table 3: Global Tractor Industry Revenue Million Forecast, by Region 2020 & 2033
- Table 4: Global Tractor Industry Revenue Million Forecast, by Horsepower 2020 & 2033
- Table 5: Global Tractor Industry Revenue Million Forecast, by Drive Type 2020 & 2033
- Table 6: Global Tractor Industry Revenue Million Forecast, by Country 2020 & 2033
- Table 7: United States Tractor Industry Revenue (Million) Forecast, by Application 2020 & 2033
- Table 8: Canada Tractor Industry Revenue (Million) Forecast, by Application 2020 & 2033
- Table 9: Rest of North America Tractor Industry Revenue (Million) Forecast, by Application 2020 & 2033
- Table 10: Global Tractor Industry Revenue Million Forecast, by Horsepower 2020 & 2033
- Table 11: Global Tractor Industry Revenue Million Forecast, by Drive Type 2020 & 2033
- Table 12: Global Tractor Industry Revenue Million Forecast, by Country 2020 & 2033
- Table 13: Germany Tractor Industry Revenue (Million) Forecast, by Application 2020 & 2033
- Table 14: United Kingdom Tractor Industry Revenue (Million) Forecast, by Application 2020 & 2033
- Table 15: France Tractor Industry Revenue (Million) Forecast, by Application 2020 & 2033
- Table 16: Spain Tractor Industry Revenue (Million) Forecast, by Application 2020 & 2033
- Table 17: Italy Tractor Industry Revenue (Million) Forecast, by Application 2020 & 2033
- Table 18: Rest of Europe Tractor Industry Revenue (Million) Forecast, by Application 2020 & 2033
- Table 19: Global Tractor Industry Revenue Million Forecast, by Horsepower 2020 & 2033
- Table 20: Global Tractor Industry Revenue Million Forecast, by Drive Type 2020 & 2033
- Table 21: Global Tractor Industry Revenue Million Forecast, by Country 2020 & 2033
- Table 22: China Tractor Industry Revenue (Million) Forecast, by Application 2020 & 2033
- Table 23: Japan Tractor Industry Revenue (Million) Forecast, by Application 2020 & 2033
- Table 24: India Tractor Industry Revenue (Million) Forecast, by Application 2020 & 2033
- Table 25: South Korea Tractor Industry Revenue (Million) Forecast, by Application 2020 & 2033
- Table 26: Rest of Asia Pacific Tractor Industry Revenue (Million) Forecast, by Application 2020 & 2033
- Table 27: Global Tractor Industry Revenue Million Forecast, by Horsepower 2020 & 2033
- Table 28: Global Tractor Industry Revenue Million Forecast, by Drive Type 2020 & 2033
- Table 29: Global Tractor Industry Revenue Million Forecast, by Country 2020 & 2033
- Table 30: South America Tractor Industry Revenue (Million) Forecast, by Application 2020 & 2033
- Table 31: Middle East and Africa Tractor Industry Revenue (Million) Forecast, by Application 2020 & 2033
Frequently Asked Questions
1. What is the projected Compound Annual Growth Rate (CAGR) of the Tractor Industry?
The projected CAGR is approximately 5.90%.
2. Which companies are prominent players in the Tractor Industry?
Key companies in the market include Escorts Limited, Deere and Company, Kubota Corporation, CNH Global NV (includes New Holland and Case IH), Yanmar Company Limited, Kuhn Group (Subsidiary of Bucher Industries), Deutz-Fah, Mahindra and Mahindra Corporation, CLAAS KGaA mbH, Tractors and Farm Equipment Limited (TAFE), AGCO Corporation (includes Massey Ferguson Valtra Fendt and Challenger).
3. What are the main segments of the Tractor Industry?
The market segments include Horsepower, Drive Type.
4. Can you provide details about the market size?
The market size is estimated to be USD 84.80 Million as of 2022.
5. What are some drivers contributing to market growth?
Rising Residential Activities in Addition to Consumer Spending to Enhance Market Demand.
6. What are the notable trends driving market growth?
The Below 40 HP Tractors Segment's Growth is Expected to be Bolstered over the Next Five Years.
7. Are there any restraints impacting market growth?
Rising Electric Vehicle Adoption to Hinder Market Growth in the Long Run.
8. Can you provide examples of recent developments in the market?
March 2024: Hyster Company announced an agreement to provide APM Terminals with 10 battery-powered terminal tractors for their location at the Port of Mobile in Alabama. The electric terminal tractors, which are scheduled to be delivered in 2024, are part of a USD 60 million investment in port equipment electrification pilots by APM Terminals.
9. What pricing options are available for accessing the report?
Pricing options include single-user, multi-user, and enterprise licenses priced at USD 4750, USD 5250, and USD 8750 respectively.
10. Is the market size provided in terms of value or volume?
The market size is provided in terms of value, measured in Million.
11. Are there any specific market keywords associated with the report?
Yes, the market keyword associated with the report is "Tractor Industry," which aids in identifying and referencing the specific market segment covered.
12. How do I determine which pricing option suits my needs best?
The pricing options vary based on user requirements and access needs. Individual users may opt for single-user licenses, while businesses requiring broader access may choose multi-user or enterprise licenses for cost-effective access to the report.
13. Are there any additional resources or data provided in the Tractor Industry report?
While the report offers comprehensive insights, it's advisable to review the specific contents or supplementary materials provided to ascertain if additional resources or data are available.
14. How can I stay updated on further developments or reports in the Tractor Industry?
To stay informed about further developments, trends, and reports in the Tractor Industry, consider subscribing to industry newsletters, following relevant companies and organizations, or regularly checking reputable industry news sources and publications.
Methodology
Step 1 - Identification of Relevant Samples Size from Population Database


Step 2 - Approaches for Defining Global Market Size (Value, Volume* & Price*)

Note*: In applicable scenarios
Step 3 - Data Sources
Primary Research
- Web Analytics
- Survey Reports
- Research Institute
- Latest Research Reports
- Opinion Leaders
Secondary Research
- Annual Reports
- White Paper
- Latest Press Release
- Industry Association
- Paid Database
- Investor Presentations

Step 4 - Data Triangulation
Involves using different sources of information in order to increase the validity of a study
These sources are likely to be stakeholders in a program - participants, other researchers, program staff, other community members, and so on.
Then we put all data in single framework & apply various statistical tools to find out the dynamic on the market.
During the analysis stage, feedback from the stakeholder groups would be compared to determine areas of agreement as well as areas of divergence

