Key Insights
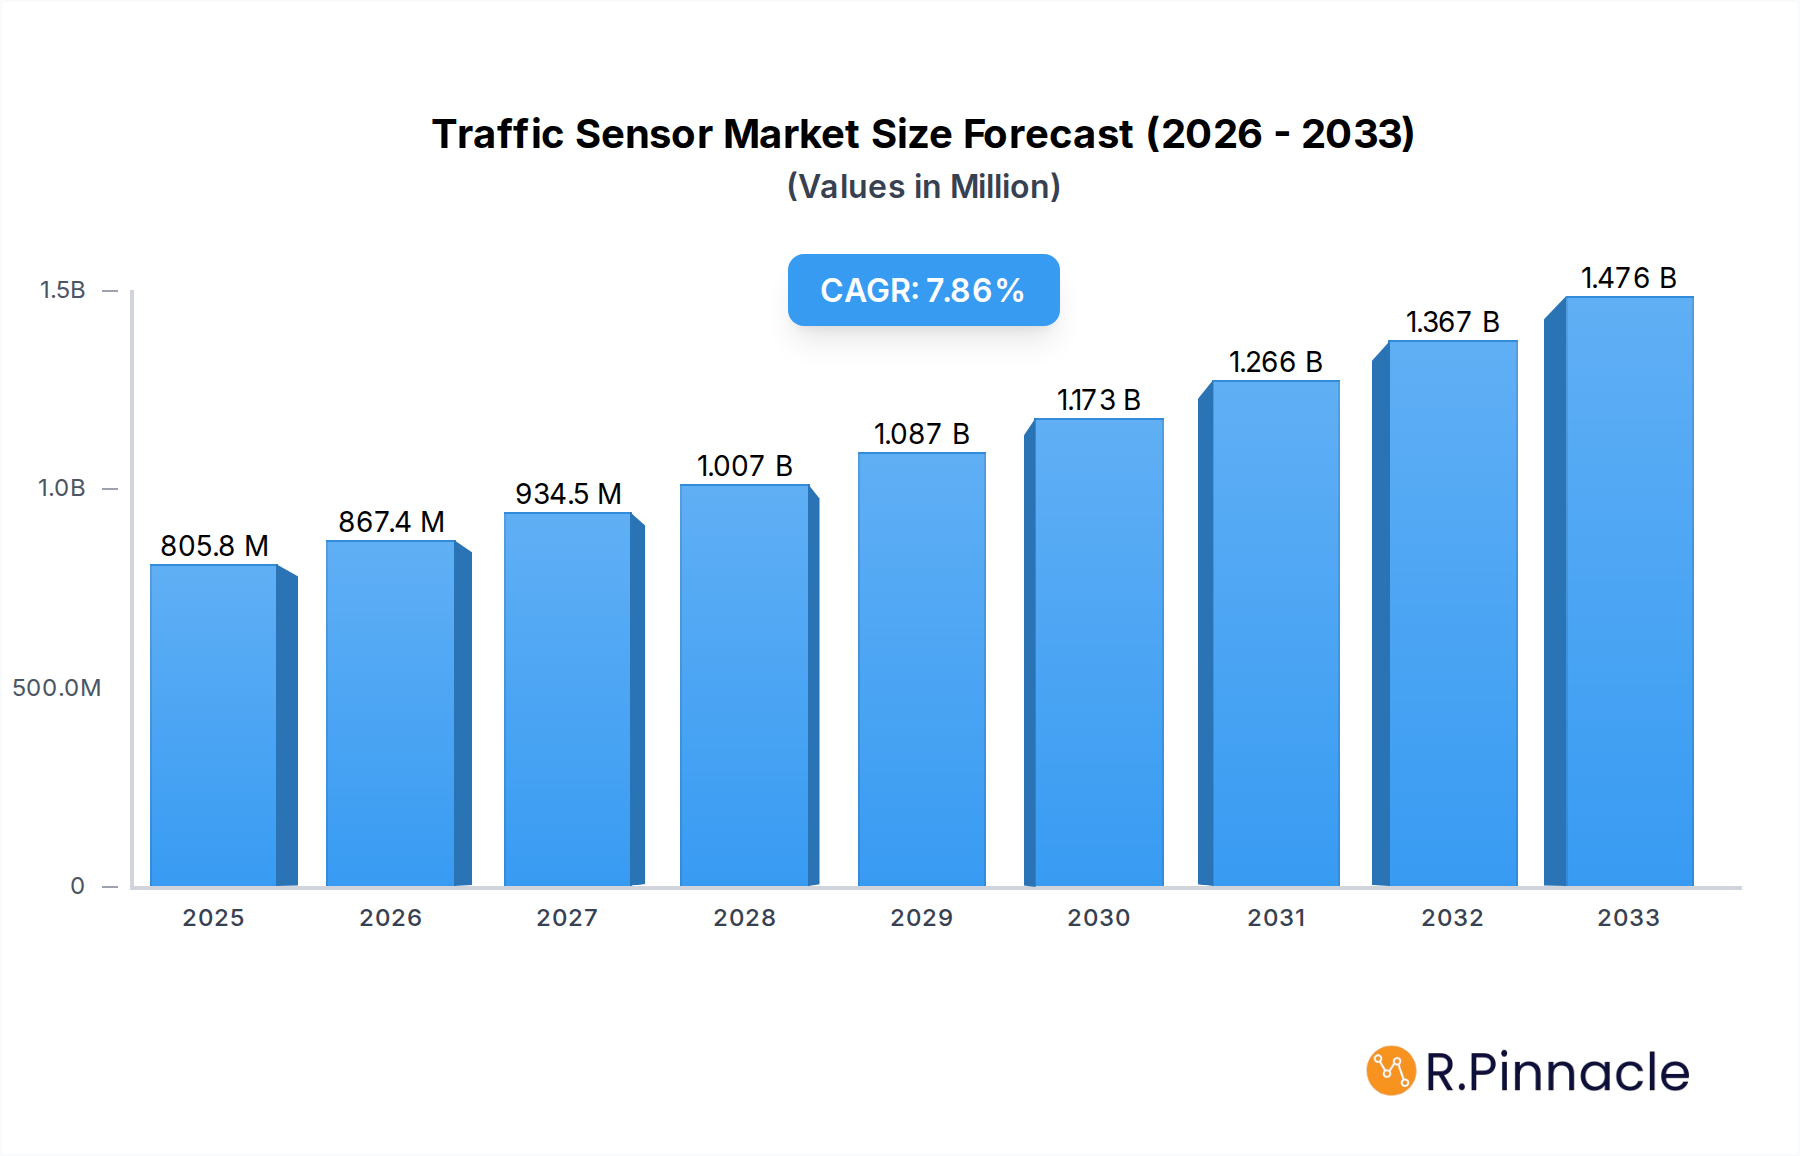
The global Traffic Sensor market is poised for robust expansion, projected to reach an estimated $805.8 million by 2025, with a significant compound annual growth rate (CAGR) of 7.72% anticipated over the forecast period of 2025-2033. This growth is primarily fueled by the escalating need for efficient traffic management solutions to combat congestion and enhance road safety. Increasing urbanization, coupled with a surge in vehicle ownership worldwide, necessitates advanced traffic monitoring systems. Governments and municipalities are heavily investing in smart city initiatives, which inherently rely on sophisticated traffic sensor technologies for real-time data collection, analysis, and intelligent traffic signal control. Furthermore, the development of autonomous vehicles and the increasing adoption of intelligent transportation systems (ITS) are creating new avenues for market growth, as these technologies demand precise and reliable sensor data for navigation, safety, and operational efficiency. The integration of AI and IoT technologies into traffic sensor systems is also a key driver, enabling predictive maintenance, adaptive traffic flow management, and enhanced safety features, thereby contributing to the overall market dynamism.

Traffic Sensor Market Size (In Million)
The market is segmented across various applications, including Vehicle Measurement and Profiling, Weigh in Motion, Traffic Monitoring, and Automated Tolling, each contributing to the overall market size and growth trajectory. The Inductive Loop and Piezoelectric Sensor segments are currently dominant in terms of market share due to their established reliability and widespread deployment. However, emerging technologies such as Image Sensors and Infrared Sensors are gaining traction, driven by their enhanced capabilities in object detection, classification, and speed measurement. Key industry players like Kapsch, TransCore, and Siemens are actively involved in research and development, focusing on innovative sensor solutions that offer greater accuracy, durability, and cost-effectiveness. The market is also witnessing strategic collaborations and acquisitions aimed at expanding product portfolios and geographical reach, further accelerating market penetration and adoption of advanced traffic sensor technologies across different regions globally.
Traffic Sensor Company Market Share
Unlock unparalleled insights into the global traffic sensor market with this definitive industry report. Spanning the historical period of 2019-2024 and projecting growth through 2033, this analysis provides strategic guidance for industry stakeholders. Leveraging millions of data points, we dissect market dynamics, technological advancements, and competitive landscapes, offering actionable intelligence for decision-makers.
Traffic Sensor Market Structure & Innovation Trends
The global traffic sensor market exhibits a moderate to high level of concentration, with a few key players like Siemens, Kapsch, and EFKON holding substantial market share, estimated in the millions of US dollars. Innovation is primarily driven by advancements in AI, IoT, and sensor fusion technologies, leading to enhanced accuracy and real-time data processing. Regulatory frameworks, particularly those focused on smart city initiatives and road safety, are acting as significant catalysts for market adoption. The report identifies the increasing demand for automated tolling and advanced vehicle measurement as key innovation drivers. Product substitutes, such as manual traffic counting, are rapidly being phased out due to their inefficiency and lack of comprehensive data. End-user demographics are expanding from traditional government road authorities to include private transportation operators and urban planning consultancies, all seeking to optimize traffic flow and improve safety. Mergers and acquisitions (M&A) activity is on the rise, with recent deals valued in the tens of millions of US dollars, signaling consolidation and strategic expansion by leading companies. This dynamic ecosystem fosters continuous improvement and the integration of cutting-edge technologies.
Traffic Sensor Market Dynamics & Trends
The traffic sensor market is experiencing robust growth, projected at a Compound Annual Growth Rate (CAGR) of approximately 7.5% over the forecast period (2025-2033), reaching a market size valued in the billions of US dollars by 2033. This expansion is fueled by a confluence of critical factors. The escalating global urbanization and the subsequent increase in vehicular traffic density necessitate sophisticated traffic management solutions, acting as a primary growth driver. Governments worldwide are heavily investing in smart city infrastructure and intelligent transportation systems (ITS), directly boosting the demand for advanced traffic sensors. Technological disruptions, including the widespread adoption of AI for data analytics, the integration of IoT for seamless connectivity, and the development of more accurate and durable sensor technologies, are reshaping the market. Consumer preferences are shifting towards enhanced road safety and efficient travel, with a growing emphasis on real-time traffic information and reduced congestion. The competitive dynamics are characterized by intense innovation and strategic partnerships among established players and emerging technology providers. Market penetration for advanced traffic sensing solutions is steadily increasing, particularly in developed economies, as the tangible benefits of optimized traffic flow, reduced emissions, and improved accident response times become more evident. The ongoing digital transformation of transportation infrastructure is a central theme, driving continuous investment and market evolution.
Dominant Regions & Segments in Traffic Sensor
North America currently dominates the global traffic sensor market, driven by substantial government investment in smart city projects and a strong existing infrastructure for ITS. The United States, in particular, is a key contributor, owing to its advanced technological adoption and stringent road safety regulations. Europe follows closely, with countries like Germany, the UK, and France leading in the implementation of intelligent traffic management systems.
Key Drivers of Regional Dominance:
- Economic Policies & Infrastructure Spending: Significant public and private investments in transportation infrastructure upgrades and smart city initiatives.
- Technological Adoption Rates: High propensity to adopt advanced technologies like AI-powered analytics and IoT-enabled sensors.
- Regulatory Frameworks: Supportive government policies and mandates for traffic safety and efficiency.
Dominant Segments:
- Application:
- Traffic Monitoring: This segment holds the largest market share due to the ubiquitous need for real-time data on traffic flow, congestion, and incident detection across urban and rural areas. The ability of these sensors to provide comprehensive data for traffic management centers is crucial.
- Vehicle Measurement and Profiling: Growing demand for accurate data on vehicle dimensions, speed, and weight for traffic analysis, infrastructure planning, and enforcement purposes.
- Automated Tolling: The expansion of electronic toll collection systems worldwide is a significant growth area, driving demand for reliable and accurate sensors for vehicle identification and classification.
- Type:
- Inductive Loop Sensors: While a mature technology, inductive loop sensors continue to command a significant market share due to their established reliability and cost-effectiveness in many applications. They are widely used for vehicle detection and counting.
- Image Sensors: Rapidly gaining traction due to their ability to provide rich data beyond simple detection, including vehicle classification, speed measurement, and even license plate recognition. Their advanced capabilities are driving adoption in sophisticated traffic management systems.
- Piezoelectric Sensors: Crucial for weigh-in-motion applications, providing accurate vehicle weight data without requiring traffic stoppage, which is essential for infrastructure protection and revenue collection.
The Asia-Pacific region is projected to exhibit the highest growth rate, driven by rapid urbanization, infrastructure development, and increasing government focus on improving traffic safety and efficiency in emerging economies.
Traffic Sensor Product Innovations
Recent product innovations in the traffic sensor market are centered on enhancing accuracy, durability, and data processing capabilities. The integration of artificial intelligence and machine learning is enabling sensors to not only detect vehicles but also classify them, measure their speed and weight in real-time, and even predict traffic flow patterns. Image sensors are evolving with higher resolution and improved low-light performance, while non-intrusive radar and LiDAR technologies are offering robust alternatives to traditional inductive loops. These advancements provide significant competitive advantages by enabling smarter traffic management, improved road safety, and more efficient tolling systems.
Report Scope & Segmentation Analysis
This report meticulously analyzes the global traffic sensor market segmented by Application and Type.
Application Segments:
- Vehicle Measurement and Profiling: Encompasses technologies that accurately measure vehicle dimensions, weight, and speed. Expected to see steady growth driven by infrastructure planning and enforcement needs.
- Weigh in Motion (WIM): Focuses on sensors capable of determining vehicle weights without requiring them to stop. This segment is crucial for freight management and infrastructure preservation.
- Traffic Monitoring: Covers sensors that detect vehicle presence, count them, and measure speed to provide real-time traffic flow data. This is a foundational segment with consistent demand.
- Automated Tolling: Includes sensors used in electronic toll collection systems for vehicle identification, classification, and transaction processing. Significant growth anticipated due to the expansion of cashless tolling.
- Others: This category includes specialized applications such as pedestrian detection, bicycle counting, and environmental monitoring sensors within traffic infrastructure.
Type Segments:
- Inductive Loop Sensors: Traditional and reliable sensors embedded in roadways for vehicle detection.
- Piezoelectric Sensors: Primarily used for weigh-in-motion applications, converting mechanical pressure into electrical signals.
- Bending Plate Sensors: Another technology for weigh-in-motion, offering high accuracy.
- Image Sensors: Utilize cameras for advanced vehicle detection, classification, and recognition.
- Infrared Sensors: Employ infrared technology for vehicle detection and speed measurement.
- Other: This broad category includes emerging technologies such as radar, LiDAR, and acoustic sensors.
Each segment's market size, growth projections, and competitive dynamics are thoroughly examined.
Key Drivers of Traffic Sensor Growth
The global traffic sensor market is propelled by several key drivers. The pervasive trend of urbanization and the resultant increase in vehicular density necessitate advanced traffic management solutions to mitigate congestion and improve safety. Government initiatives, particularly those focused on developing smart cities and intelligent transportation systems (ITS), are substantial growth accelerators, involving significant investments in digital infrastructure. Technological advancements, including the integration of AI for data analytics, IoT for real-time connectivity, and the development of more precise and durable sensor technologies, are continuously enhancing the capabilities and adoption of traffic sensors. Furthermore, a growing emphasis on road safety and the reduction of traffic-related fatalities and accidents is driving the deployment of sophisticated monitoring and detection systems.
Challenges in the Traffic Sensor Sector
Despite robust growth, the traffic sensor sector faces several challenges. The significant initial investment required for the deployment of advanced traffic sensor systems can be a barrier, particularly for developing economies. Regulatory hurdles and the need for standardization across different regions and sensor technologies can slow down widespread adoption. Supply chain disruptions, as witnessed in recent global events, can impact the availability and cost of essential components. Intense competitive pressure among established players and emerging startups can lead to pricing challenges and the need for continuous innovation to maintain market share. Furthermore, the maintenance and calibration of sensors in harsh environmental conditions pose ongoing operational challenges.
Emerging Opportunities in Traffic Sensor
The traffic sensor market is ripe with emerging opportunities. The expansion of autonomous vehicle technology is creating a demand for highly accurate and redundant sensor systems for navigation and safety. The increasing focus on sustainable transportation and environmental monitoring presents opportunities for sensors that can track emissions, noise pollution, and optimize traffic flow for reduced carbon footprints. The development of edge computing capabilities for traffic sensors allows for real-time data processing and analysis directly at the sensor level, reducing latency and bandwidth requirements. Furthermore, the growing adoption of data-driven urban planning and smart city initiatives globally presents a vast untapped market for comprehensive traffic data solutions.
Leading Players in the Traffic Sensor Market
- EFKON
- Kapsch
- TransCore
- Irdinc
- Kistler
- Flir
- TE
- Q-Free
- SWARCO
- SICK
- Axis
- Raytheon
- Siemens
Key Developments in Traffic Sensor Industry
- 2023 Q4: Siemens announces a significant integration of AI into its traffic sensor platforms for predictive analytics.
- 2023 Q3: Kapsch TrafficCom secures a major contract for a smart tolling system expansion in Southeast Asia, valued in the tens of millions.
- 2023 Q2: Axis Communications launches a new generation of intelligent video sensors with enhanced edge processing capabilities.
- 2023 Q1: EFKON unveils a new weigh-in-motion sensor offering unprecedented accuracy for heavy vehicle monitoring.
- 2022 Q4: SWARCO acquires a specialized sensor technology company to bolster its smart city offerings.
- 2022 Q3: Q-Free expands its automated tolling solutions portfolio with advanced vehicle classification technology.
- 2022 Q2: Kistler introduces a new generation of piezoelectric sensors for enhanced road condition monitoring.
- 2022 Q1: IRD announces a partnership to integrate its traffic sensing technology with connected vehicle platforms.
- 2021 Q4: TE Connectivity showcases its latest suite of sensor solutions designed for harsh automotive environments.
- 2021 Q3: Raytheon demonstrates advanced LiDAR capabilities for high-resolution traffic mapping.
- 2021 Q2: FLIR Systems expands its thermal imaging sensor offerings for traffic safety applications.
- 2021 Q1: SICK AG introduces new radar sensors optimized for adaptive traffic control systems.
Future Outlook for Traffic Sensor Market
The future outlook for the traffic sensor market is exceptionally positive, driven by the inexorable march towards smarter, safer, and more efficient transportation networks. The continued expansion of smart cities, the rapid development of autonomous driving technologies, and the global push for sustainable mobility will create sustained demand for advanced traffic sensing solutions. Investments in 5G infrastructure will further enhance the capabilities of IoT-enabled traffic sensors, enabling real-time data transmission and processing at unprecedented speeds. Emerging economies are poised to become significant growth markets as they invest heavily in modernizing their transportation infrastructure. Strategic partnerships, technological innovation, and a focus on data analytics will be critical for players aiming to capitalize on the vast opportunities that lie ahead in this dynamic sector.
Traffic Sensor Segmentation
-
1. Application
- 1.1. Vehicle Measurement and Profiling
- 1.2. Weigh in Motion
- 1.3. Traffic Monitoring
- 1.4. Automated Tolling
- 1.5. Others
-
2. Types
- 2.1. Inductive Loop
- 2.2. Piezoelectric Sensor
- 2.3. Bending Plate
- 2.4. Image Sensor
- 2.5. Infrared Sensor
- 2.6. Other
Traffic Sensor Segmentation By Geography
-
1. North America
- 1.1. United States
- 1.2. Canada
- 1.3. Mexico
-
2. South America
- 2.1. Brazil
- 2.2. Argentina
- 2.3. Rest of South America
-
3. Europe
- 3.1. United Kingdom
- 3.2. Germany
- 3.3. France
- 3.4. Italy
- 3.5. Spain
- 3.6. Russia
- 3.7. Benelux
- 3.8. Nordics
- 3.9. Rest of Europe
-
4. Middle East & Africa
- 4.1. Turkey
- 4.2. Israel
- 4.3. GCC
- 4.4. North Africa
- 4.5. South Africa
- 4.6. Rest of Middle East & Africa
-
5. Asia Pacific
- 5.1. China
- 5.2. India
- 5.3. Japan
- 5.4. South Korea
- 5.5. ASEAN
- 5.6. Oceania
- 5.7. Rest of Asia Pacific
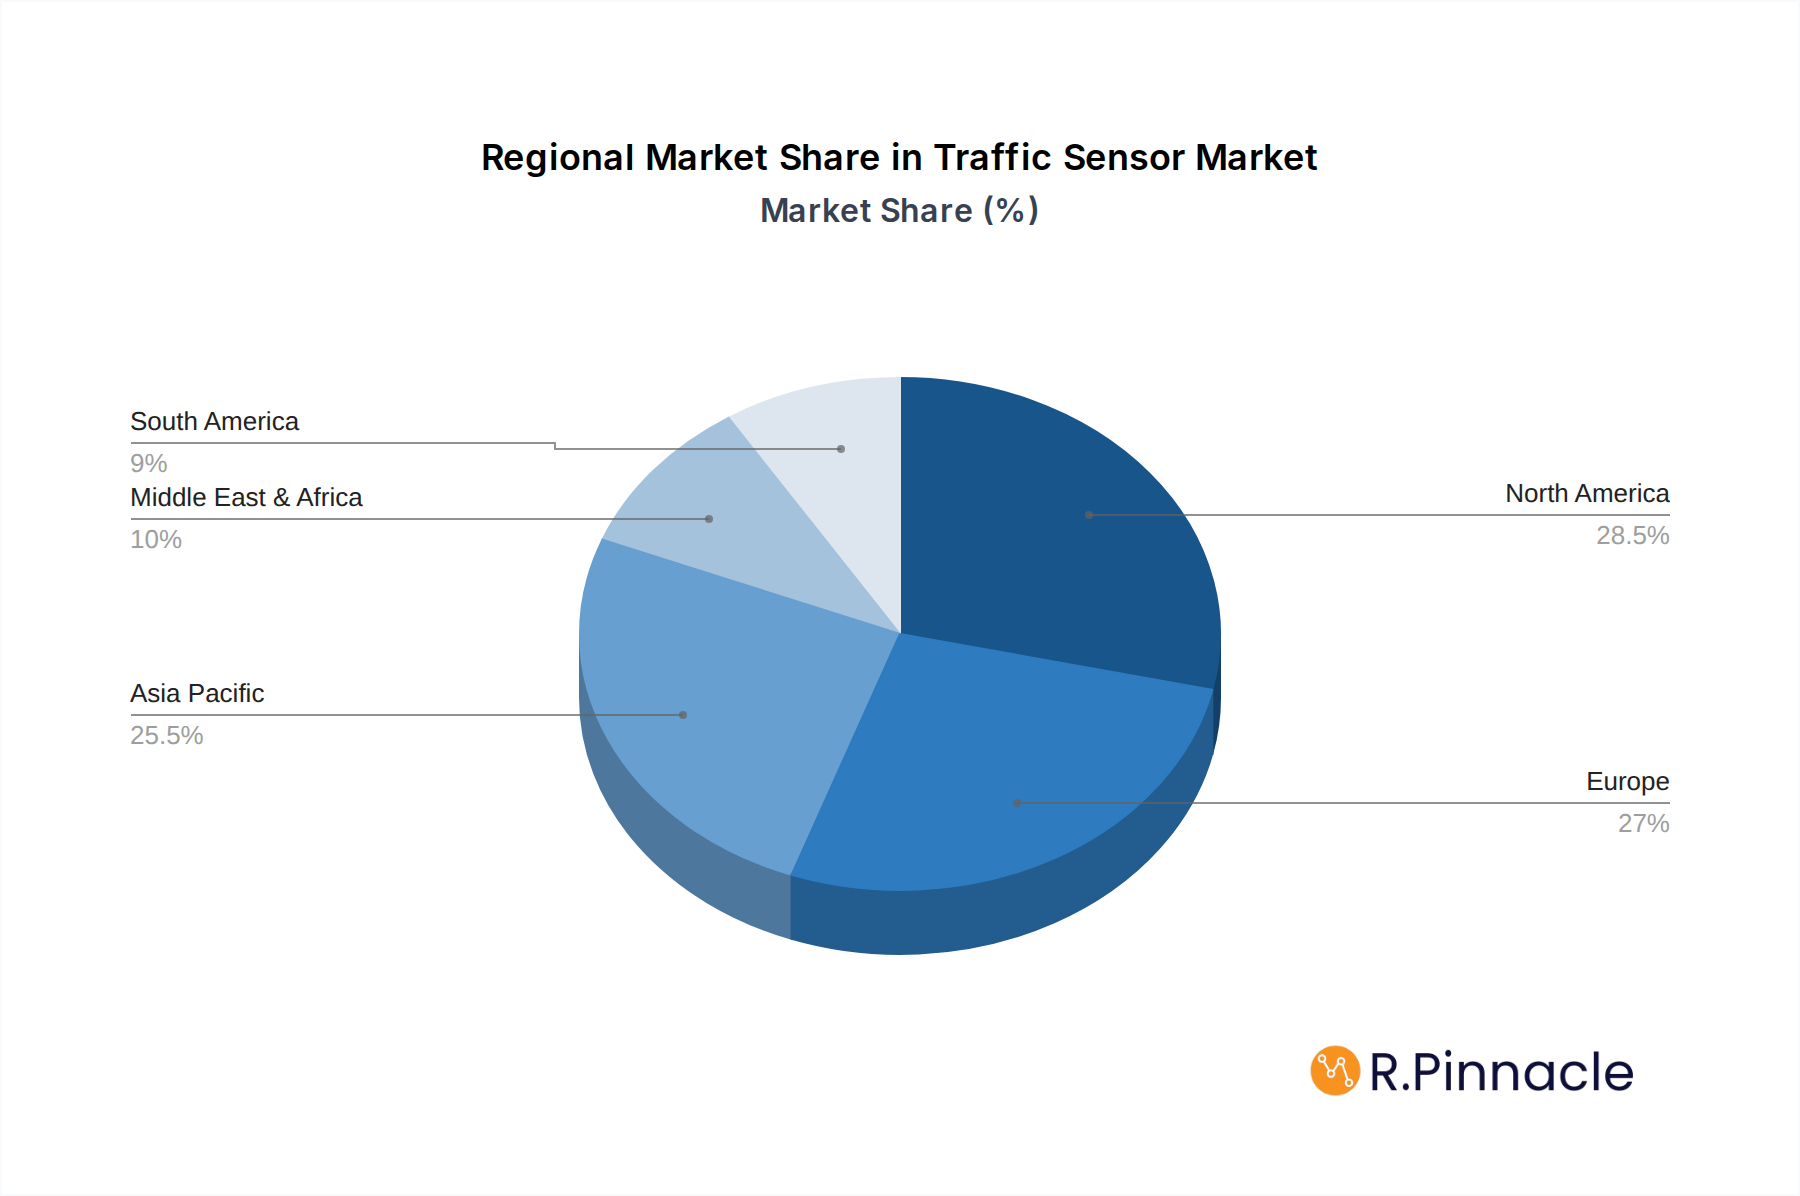
Traffic Sensor Regional Market Share
Geographic Coverage of Traffic Sensor
Traffic Sensor REPORT HIGHLIGHTS
| Aspects | Details |
|---|---|
| Study Period | 2020-2034 |
| Base Year | 2025 |
| Estimated Year | 2026 |
| Forecast Period | 2026-2034 |
| Historical Period | 2020-2025 |
| Growth Rate | CAGR of 7.72% from 2020-2034 |
| Segmentation |
|
Table of Contents
- 1. Introduction
- 1.1. Research Scope
- 1.2. Market Segmentation
- 1.3. Research Objective
- 1.4. Definitions and Assumptions
- 2. Executive Summary
- 2.1. Market Snapshot
- 3. Market Dynamics
- 3.1. Market Drivers
- 3.2. Market Restrains
- 3.3. Market Trends
- 3.4. Market Opportunities
- 4. Market Factor Analysis
- 4.1. Porters Five Forces
- 4.1.1. Bargaining Power of Suppliers
- 4.1.2. Bargaining Power of Buyers
- 4.1.3. Threat of New Entrants
- 4.1.4. Threat of Substitutes
- 4.1.5. Competitive Rivalry
- 4.2. PESTEL analysis
- 4.3. BCG Analysis
- 4.3.1. Stars (High Growth, High Market Share)
- 4.3.2. Cash Cows (Low Growth, High Market Share)
- 4.3.3. Question Mark (High Growth, Low Market Share)
- 4.3.4. Dogs (Low Growth, Low Market Share)
- 4.4. Ansoff Matrix Analysis
- 4.5. Supply Chain Analysis
- 4.6. Regulatory Landscape
- 4.7. Current Market Potential and Opportunity Assessment (TAM–SAM–SOM Framework)
- 4.8. PRI Analyst Note
- 4.1. Porters Five Forces
- 5. Market Analysis, Insights and Forecast 2021-2033
- 5.1. Market Analysis, Insights and Forecast - by Application
- 5.1.1. Vehicle Measurement and Profiling
- 5.1.2. Weigh in Motion
- 5.1.3. Traffic Monitoring
- 5.1.4. Automated Tolling
- 5.1.5. Others
- 5.2. Market Analysis, Insights and Forecast - by Types
- 5.2.1. Inductive Loop
- 5.2.2. Piezoelectric Sensor
- 5.2.3. Bending Plate
- 5.2.4. Image Sensor
- 5.2.5. Infrared Sensor
- 5.2.6. Other
- 5.3. Market Analysis, Insights and Forecast - by Region
- 5.3.1. North America
- 5.3.2. South America
- 5.3.3. Europe
- 5.3.4. Middle East & Africa
- 5.3.5. Asia Pacific
- 5.1. Market Analysis, Insights and Forecast - by Application
- 6. Global Traffic Sensor Analysis, Insights and Forecast, 2021-2033
- 6.1. Market Analysis, Insights and Forecast - by Application
- 6.1.1. Vehicle Measurement and Profiling
- 6.1.2. Weigh in Motion
- 6.1.3. Traffic Monitoring
- 6.1.4. Automated Tolling
- 6.1.5. Others
- 6.2. Market Analysis, Insights and Forecast - by Types
- 6.2.1. Inductive Loop
- 6.2.2. Piezoelectric Sensor
- 6.2.3. Bending Plate
- 6.2.4. Image Sensor
- 6.2.5. Infrared Sensor
- 6.2.6. Other
- 6.1. Market Analysis, Insights and Forecast - by Application
- 7. North America Traffic Sensor Analysis, Insights and Forecast, 2020-2032
- 7.1. Market Analysis, Insights and Forecast - by Application
- 7.1.1. Vehicle Measurement and Profiling
- 7.1.2. Weigh in Motion
- 7.1.3. Traffic Monitoring
- 7.1.4. Automated Tolling
- 7.1.5. Others
- 7.2. Market Analysis, Insights and Forecast - by Types
- 7.2.1. Inductive Loop
- 7.2.2. Piezoelectric Sensor
- 7.2.3. Bending Plate
- 7.2.4. Image Sensor
- 7.2.5. Infrared Sensor
- 7.2.6. Other
- 7.1. Market Analysis, Insights and Forecast - by Application
- 8. South America Traffic Sensor Analysis, Insights and Forecast, 2020-2032
- 8.1. Market Analysis, Insights and Forecast - by Application
- 8.1.1. Vehicle Measurement and Profiling
- 8.1.2. Weigh in Motion
- 8.1.3. Traffic Monitoring
- 8.1.4. Automated Tolling
- 8.1.5. Others
- 8.2. Market Analysis, Insights and Forecast - by Types
- 8.2.1. Inductive Loop
- 8.2.2. Piezoelectric Sensor
- 8.2.3. Bending Plate
- 8.2.4. Image Sensor
- 8.2.5. Infrared Sensor
- 8.2.6. Other
- 8.1. Market Analysis, Insights and Forecast - by Application
- 9. Europe Traffic Sensor Analysis, Insights and Forecast, 2020-2032
- 9.1. Market Analysis, Insights and Forecast - by Application
- 9.1.1. Vehicle Measurement and Profiling
- 9.1.2. Weigh in Motion
- 9.1.3. Traffic Monitoring
- 9.1.4. Automated Tolling
- 9.1.5. Others
- 9.2. Market Analysis, Insights and Forecast - by Types
- 9.2.1. Inductive Loop
- 9.2.2. Piezoelectric Sensor
- 9.2.3. Bending Plate
- 9.2.4. Image Sensor
- 9.2.5. Infrared Sensor
- 9.2.6. Other
- 9.1. Market Analysis, Insights and Forecast - by Application
- 10. Middle East & Africa Traffic Sensor Analysis, Insights and Forecast, 2020-2032
- 10.1. Market Analysis, Insights and Forecast - by Application
- 10.1.1. Vehicle Measurement and Profiling
- 10.1.2. Weigh in Motion
- 10.1.3. Traffic Monitoring
- 10.1.4. Automated Tolling
- 10.1.5. Others
- 10.2. Market Analysis, Insights and Forecast - by Types
- 10.2.1. Inductive Loop
- 10.2.2. Piezoelectric Sensor
- 10.2.3. Bending Plate
- 10.2.4. Image Sensor
- 10.2.5. Infrared Sensor
- 10.2.6. Other
- 10.1. Market Analysis, Insights and Forecast - by Application
- 11. Asia Pacific Traffic Sensor Analysis, Insights and Forecast, 2020-2032
- 11.1. Market Analysis, Insights and Forecast - by Application
- 11.1.1. Vehicle Measurement and Profiling
- 11.1.2. Weigh in Motion
- 11.1.3. Traffic Monitoring
- 11.1.4. Automated Tolling
- 11.1.5. Others
- 11.2. Market Analysis, Insights and Forecast - by Types
- 11.2.1. Inductive Loop
- 11.2.2. Piezoelectric Sensor
- 11.2.3. Bending Plate
- 11.2.4. Image Sensor
- 11.2.5. Infrared Sensor
- 11.2.6. Other
- 11.1. Market Analysis, Insights and Forecast - by Application
- 12. Competitive Analysis
- 12.1. Company Profiles
- 12.1.1 EFKON
- 12.1.1.1. Company Overview
- 12.1.1.2. Products
- 12.1.1.3. Company Financials
- 12.1.1.4. SWOT Analysis
- 12.1.2 Kapsch
- 12.1.2.1. Company Overview
- 12.1.2.2. Products
- 12.1.2.3. Company Financials
- 12.1.2.4. SWOT Analysis
- 12.1.3 TransCore
- 12.1.3.1. Company Overview
- 12.1.3.2. Products
- 12.1.3.3. Company Financials
- 12.1.3.4. SWOT Analysis
- 12.1.4 Irdinc
- 12.1.4.1. Company Overview
- 12.1.4.2. Products
- 12.1.4.3. Company Financials
- 12.1.4.4. SWOT Analysis
- 12.1.5 Kistler
- 12.1.5.1. Company Overview
- 12.1.5.2. Products
- 12.1.5.3. Company Financials
- 12.1.5.4. SWOT Analysis
- 12.1.6 Flir
- 12.1.6.1. Company Overview
- 12.1.6.2. Products
- 12.1.6.3. Company Financials
- 12.1.6.4. SWOT Analysis
- 12.1.7 TE
- 12.1.7.1. Company Overview
- 12.1.7.2. Products
- 12.1.7.3. Company Financials
- 12.1.7.4. SWOT Analysis
- 12.1.8 Q-Free
- 12.1.8.1. Company Overview
- 12.1.8.2. Products
- 12.1.8.3. Company Financials
- 12.1.8.4. SWOT Analysis
- 12.1.9 SWARCO
- 12.1.9.1. Company Overview
- 12.1.9.2. Products
- 12.1.9.3. Company Financials
- 12.1.9.4. SWOT Analysis
- 12.1.10 SICK
- 12.1.10.1. Company Overview
- 12.1.10.2. Products
- 12.1.10.3. Company Financials
- 12.1.10.4. SWOT Analysis
- 12.1.11 Axis
- 12.1.11.1. Company Overview
- 12.1.11.2. Products
- 12.1.11.3. Company Financials
- 12.1.11.4. SWOT Analysis
- 12.1.12 Raytheon
- 12.1.12.1. Company Overview
- 12.1.12.2. Products
- 12.1.12.3. Company Financials
- 12.1.12.4. SWOT Analysis
- 12.1.13 Siemens
- 12.1.13.1. Company Overview
- 12.1.13.2. Products
- 12.1.13.3. Company Financials
- 12.1.13.4. SWOT Analysis
- 12.1.1 EFKON
- 12.2. Market Entropy
- 12.2.1 Company's Key Areas Served
- 12.2.2 Recent Developments
- 12.3. Company Market Share Analysis 2025
- 12.3.1 Top 5 Companies Market Share Analysis
- 12.3.2 Top 3 Companies Market Share Analysis
- 12.4. List of Potential Customers
- 13. Research Methodology
List of Figures
- Figure 1: Global Traffic Sensor Revenue Breakdown (million, %) by Region 2025 & 2033
- Figure 2: Global Traffic Sensor Volume Breakdown (K, %) by Region 2025 & 2033
- Figure 3: North America Traffic Sensor Revenue (million), by Application 2025 & 2033
- Figure 4: North America Traffic Sensor Volume (K), by Application 2025 & 2033
- Figure 5: North America Traffic Sensor Revenue Share (%), by Application 2025 & 2033
- Figure 6: North America Traffic Sensor Volume Share (%), by Application 2025 & 2033
- Figure 7: North America Traffic Sensor Revenue (million), by Types 2025 & 2033
- Figure 8: North America Traffic Sensor Volume (K), by Types 2025 & 2033
- Figure 9: North America Traffic Sensor Revenue Share (%), by Types 2025 & 2033
- Figure 10: North America Traffic Sensor Volume Share (%), by Types 2025 & 2033
- Figure 11: North America Traffic Sensor Revenue (million), by Country 2025 & 2033
- Figure 12: North America Traffic Sensor Volume (K), by Country 2025 & 2033
- Figure 13: North America Traffic Sensor Revenue Share (%), by Country 2025 & 2033
- Figure 14: North America Traffic Sensor Volume Share (%), by Country 2025 & 2033
- Figure 15: South America Traffic Sensor Revenue (million), by Application 2025 & 2033
- Figure 16: South America Traffic Sensor Volume (K), by Application 2025 & 2033
- Figure 17: South America Traffic Sensor Revenue Share (%), by Application 2025 & 2033
- Figure 18: South America Traffic Sensor Volume Share (%), by Application 2025 & 2033
- Figure 19: South America Traffic Sensor Revenue (million), by Types 2025 & 2033
- Figure 20: South America Traffic Sensor Volume (K), by Types 2025 & 2033
- Figure 21: South America Traffic Sensor Revenue Share (%), by Types 2025 & 2033
- Figure 22: South America Traffic Sensor Volume Share (%), by Types 2025 & 2033
- Figure 23: South America Traffic Sensor Revenue (million), by Country 2025 & 2033
- Figure 24: South America Traffic Sensor Volume (K), by Country 2025 & 2033
- Figure 25: South America Traffic Sensor Revenue Share (%), by Country 2025 & 2033
- Figure 26: South America Traffic Sensor Volume Share (%), by Country 2025 & 2033
- Figure 27: Europe Traffic Sensor Revenue (million), by Application 2025 & 2033
- Figure 28: Europe Traffic Sensor Volume (K), by Application 2025 & 2033
- Figure 29: Europe Traffic Sensor Revenue Share (%), by Application 2025 & 2033
- Figure 30: Europe Traffic Sensor Volume Share (%), by Application 2025 & 2033
- Figure 31: Europe Traffic Sensor Revenue (million), by Types 2025 & 2033
- Figure 32: Europe Traffic Sensor Volume (K), by Types 2025 & 2033
- Figure 33: Europe Traffic Sensor Revenue Share (%), by Types 2025 & 2033
- Figure 34: Europe Traffic Sensor Volume Share (%), by Types 2025 & 2033
- Figure 35: Europe Traffic Sensor Revenue (million), by Country 2025 & 2033
- Figure 36: Europe Traffic Sensor Volume (K), by Country 2025 & 2033
- Figure 37: Europe Traffic Sensor Revenue Share (%), by Country 2025 & 2033
- Figure 38: Europe Traffic Sensor Volume Share (%), by Country 2025 & 2033
- Figure 39: Middle East & Africa Traffic Sensor Revenue (million), by Application 2025 & 2033
- Figure 40: Middle East & Africa Traffic Sensor Volume (K), by Application 2025 & 2033
- Figure 41: Middle East & Africa Traffic Sensor Revenue Share (%), by Application 2025 & 2033
- Figure 42: Middle East & Africa Traffic Sensor Volume Share (%), by Application 2025 & 2033
- Figure 43: Middle East & Africa Traffic Sensor Revenue (million), by Types 2025 & 2033
- Figure 44: Middle East & Africa Traffic Sensor Volume (K), by Types 2025 & 2033
- Figure 45: Middle East & Africa Traffic Sensor Revenue Share (%), by Types 2025 & 2033
- Figure 46: Middle East & Africa Traffic Sensor Volume Share (%), by Types 2025 & 2033
- Figure 47: Middle East & Africa Traffic Sensor Revenue (million), by Country 2025 & 2033
- Figure 48: Middle East & Africa Traffic Sensor Volume (K), by Country 2025 & 2033
- Figure 49: Middle East & Africa Traffic Sensor Revenue Share (%), by Country 2025 & 2033
- Figure 50: Middle East & Africa Traffic Sensor Volume Share (%), by Country 2025 & 2033
- Figure 51: Asia Pacific Traffic Sensor Revenue (million), by Application 2025 & 2033
- Figure 52: Asia Pacific Traffic Sensor Volume (K), by Application 2025 & 2033
- Figure 53: Asia Pacific Traffic Sensor Revenue Share (%), by Application 2025 & 2033
- Figure 54: Asia Pacific Traffic Sensor Volume Share (%), by Application 2025 & 2033
- Figure 55: Asia Pacific Traffic Sensor Revenue (million), by Types 2025 & 2033
- Figure 56: Asia Pacific Traffic Sensor Volume (K), by Types 2025 & 2033
- Figure 57: Asia Pacific Traffic Sensor Revenue Share (%), by Types 2025 & 2033
- Figure 58: Asia Pacific Traffic Sensor Volume Share (%), by Types 2025 & 2033
- Figure 59: Asia Pacific Traffic Sensor Revenue (million), by Country 2025 & 2033
- Figure 60: Asia Pacific Traffic Sensor Volume (K), by Country 2025 & 2033
- Figure 61: Asia Pacific Traffic Sensor Revenue Share (%), by Country 2025 & 2033
- Figure 62: Asia Pacific Traffic Sensor Volume Share (%), by Country 2025 & 2033
List of Tables
- Table 1: Global Traffic Sensor Revenue million Forecast, by Application 2020 & 2033
- Table 2: Global Traffic Sensor Volume K Forecast, by Application 2020 & 2033
- Table 3: Global Traffic Sensor Revenue million Forecast, by Types 2020 & 2033
- Table 4: Global Traffic Sensor Volume K Forecast, by Types 2020 & 2033
- Table 5: Global Traffic Sensor Revenue million Forecast, by Region 2020 & 2033
- Table 6: Global Traffic Sensor Volume K Forecast, by Region 2020 & 2033
- Table 7: Global Traffic Sensor Revenue million Forecast, by Application 2020 & 2033
- Table 8: Global Traffic Sensor Volume K Forecast, by Application 2020 & 2033
- Table 9: Global Traffic Sensor Revenue million Forecast, by Types 2020 & 2033
- Table 10: Global Traffic Sensor Volume K Forecast, by Types 2020 & 2033
- Table 11: Global Traffic Sensor Revenue million Forecast, by Country 2020 & 2033
- Table 12: Global Traffic Sensor Volume K Forecast, by Country 2020 & 2033
- Table 13: United States Traffic Sensor Revenue (million) Forecast, by Application 2020 & 2033
- Table 14: United States Traffic Sensor Volume (K) Forecast, by Application 2020 & 2033
- Table 15: Canada Traffic Sensor Revenue (million) Forecast, by Application 2020 & 2033
- Table 16: Canada Traffic Sensor Volume (K) Forecast, by Application 2020 & 2033
- Table 17: Mexico Traffic Sensor Revenue (million) Forecast, by Application 2020 & 2033
- Table 18: Mexico Traffic Sensor Volume (K) Forecast, by Application 2020 & 2033
- Table 19: Global Traffic Sensor Revenue million Forecast, by Application 2020 & 2033
- Table 20: Global Traffic Sensor Volume K Forecast, by Application 2020 & 2033
- Table 21: Global Traffic Sensor Revenue million Forecast, by Types 2020 & 2033
- Table 22: Global Traffic Sensor Volume K Forecast, by Types 2020 & 2033
- Table 23: Global Traffic Sensor Revenue million Forecast, by Country 2020 & 2033
- Table 24: Global Traffic Sensor Volume K Forecast, by Country 2020 & 2033
- Table 25: Brazil Traffic Sensor Revenue (million) Forecast, by Application 2020 & 2033
- Table 26: Brazil Traffic Sensor Volume (K) Forecast, by Application 2020 & 2033
- Table 27: Argentina Traffic Sensor Revenue (million) Forecast, by Application 2020 & 2033
- Table 28: Argentina Traffic Sensor Volume (K) Forecast, by Application 2020 & 2033
- Table 29: Rest of South America Traffic Sensor Revenue (million) Forecast, by Application 2020 & 2033
- Table 30: Rest of South America Traffic Sensor Volume (K) Forecast, by Application 2020 & 2033
- Table 31: Global Traffic Sensor Revenue million Forecast, by Application 2020 & 2033
- Table 32: Global Traffic Sensor Volume K Forecast, by Application 2020 & 2033
- Table 33: Global Traffic Sensor Revenue million Forecast, by Types 2020 & 2033
- Table 34: Global Traffic Sensor Volume K Forecast, by Types 2020 & 2033
- Table 35: Global Traffic Sensor Revenue million Forecast, by Country 2020 & 2033
- Table 36: Global Traffic Sensor Volume K Forecast, by Country 2020 & 2033
- Table 37: United Kingdom Traffic Sensor Revenue (million) Forecast, by Application 2020 & 2033
- Table 38: United Kingdom Traffic Sensor Volume (K) Forecast, by Application 2020 & 2033
- Table 39: Germany Traffic Sensor Revenue (million) Forecast, by Application 2020 & 2033
- Table 40: Germany Traffic Sensor Volume (K) Forecast, by Application 2020 & 2033
- Table 41: France Traffic Sensor Revenue (million) Forecast, by Application 2020 & 2033
- Table 42: France Traffic Sensor Volume (K) Forecast, by Application 2020 & 2033
- Table 43: Italy Traffic Sensor Revenue (million) Forecast, by Application 2020 & 2033
- Table 44: Italy Traffic Sensor Volume (K) Forecast, by Application 2020 & 2033
- Table 45: Spain Traffic Sensor Revenue (million) Forecast, by Application 2020 & 2033
- Table 46: Spain Traffic Sensor Volume (K) Forecast, by Application 2020 & 2033
- Table 47: Russia Traffic Sensor Revenue (million) Forecast, by Application 2020 & 2033
- Table 48: Russia Traffic Sensor Volume (K) Forecast, by Application 2020 & 2033
- Table 49: Benelux Traffic Sensor Revenue (million) Forecast, by Application 2020 & 2033
- Table 50: Benelux Traffic Sensor Volume (K) Forecast, by Application 2020 & 2033
- Table 51: Nordics Traffic Sensor Revenue (million) Forecast, by Application 2020 & 2033
- Table 52: Nordics Traffic Sensor Volume (K) Forecast, by Application 2020 & 2033
- Table 53: Rest of Europe Traffic Sensor Revenue (million) Forecast, by Application 2020 & 2033
- Table 54: Rest of Europe Traffic Sensor Volume (K) Forecast, by Application 2020 & 2033
- Table 55: Global Traffic Sensor Revenue million Forecast, by Application 2020 & 2033
- Table 56: Global Traffic Sensor Volume K Forecast, by Application 2020 & 2033
- Table 57: Global Traffic Sensor Revenue million Forecast, by Types 2020 & 2033
- Table 58: Global Traffic Sensor Volume K Forecast, by Types 2020 & 2033
- Table 59: Global Traffic Sensor Revenue million Forecast, by Country 2020 & 2033
- Table 60: Global Traffic Sensor Volume K Forecast, by Country 2020 & 2033
- Table 61: Turkey Traffic Sensor Revenue (million) Forecast, by Application 2020 & 2033
- Table 62: Turkey Traffic Sensor Volume (K) Forecast, by Application 2020 & 2033
- Table 63: Israel Traffic Sensor Revenue (million) Forecast, by Application 2020 & 2033
- Table 64: Israel Traffic Sensor Volume (K) Forecast, by Application 2020 & 2033
- Table 65: GCC Traffic Sensor Revenue (million) Forecast, by Application 2020 & 2033
- Table 66: GCC Traffic Sensor Volume (K) Forecast, by Application 2020 & 2033
- Table 67: North Africa Traffic Sensor Revenue (million) Forecast, by Application 2020 & 2033
- Table 68: North Africa Traffic Sensor Volume (K) Forecast, by Application 2020 & 2033
- Table 69: South Africa Traffic Sensor Revenue (million) Forecast, by Application 2020 & 2033
- Table 70: South Africa Traffic Sensor Volume (K) Forecast, by Application 2020 & 2033
- Table 71: Rest of Middle East & Africa Traffic Sensor Revenue (million) Forecast, by Application 2020 & 2033
- Table 72: Rest of Middle East & Africa Traffic Sensor Volume (K) Forecast, by Application 2020 & 2033
- Table 73: Global Traffic Sensor Revenue million Forecast, by Application 2020 & 2033
- Table 74: Global Traffic Sensor Volume K Forecast, by Application 2020 & 2033
- Table 75: Global Traffic Sensor Revenue million Forecast, by Types 2020 & 2033
- Table 76: Global Traffic Sensor Volume K Forecast, by Types 2020 & 2033
- Table 77: Global Traffic Sensor Revenue million Forecast, by Country 2020 & 2033
- Table 78: Global Traffic Sensor Volume K Forecast, by Country 2020 & 2033
- Table 79: China Traffic Sensor Revenue (million) Forecast, by Application 2020 & 2033
- Table 80: China Traffic Sensor Volume (K) Forecast, by Application 2020 & 2033
- Table 81: India Traffic Sensor Revenue (million) Forecast, by Application 2020 & 2033
- Table 82: India Traffic Sensor Volume (K) Forecast, by Application 2020 & 2033
- Table 83: Japan Traffic Sensor Revenue (million) Forecast, by Application 2020 & 2033
- Table 84: Japan Traffic Sensor Volume (K) Forecast, by Application 2020 & 2033
- Table 85: South Korea Traffic Sensor Revenue (million) Forecast, by Application 2020 & 2033
- Table 86: South Korea Traffic Sensor Volume (K) Forecast, by Application 2020 & 2033
- Table 87: ASEAN Traffic Sensor Revenue (million) Forecast, by Application 2020 & 2033
- Table 88: ASEAN Traffic Sensor Volume (K) Forecast, by Application 2020 & 2033
- Table 89: Oceania Traffic Sensor Revenue (million) Forecast, by Application 2020 & 2033
- Table 90: Oceania Traffic Sensor Volume (K) Forecast, by Application 2020 & 2033
- Table 91: Rest of Asia Pacific Traffic Sensor Revenue (million) Forecast, by Application 2020 & 2033
- Table 92: Rest of Asia Pacific Traffic Sensor Volume (K) Forecast, by Application 2020 & 2033
Frequently Asked Questions
1. What is the projected Compound Annual Growth Rate (CAGR) of the Traffic Sensor?
The projected CAGR is approximately 7.72%.
2. Which companies are prominent players in the Traffic Sensor?
Key companies in the market include EFKON, Kapsch, TransCore, Irdinc, Kistler, Flir, TE, Q-Free, SWARCO, SICK, Axis, Raytheon, Siemens.
3. What are the main segments of the Traffic Sensor?
The market segments include Application, Types.
4. Can you provide details about the market size?
The market size is estimated to be USD 805.8 million as of 2022.
5. What are some drivers contributing to market growth?
N/A
6. What are the notable trends driving market growth?
N/A
7. Are there any restraints impacting market growth?
N/A
8. Can you provide examples of recent developments in the market?
N/A
9. What pricing options are available for accessing the report?
Pricing options include single-user, multi-user, and enterprise licenses priced at USD 3350.00, USD 5025.00, and USD 6700.00 respectively.
10. Is the market size provided in terms of value or volume?
The market size is provided in terms of value, measured in million and volume, measured in K.
11. Are there any specific market keywords associated with the report?
Yes, the market keyword associated with the report is "Traffic Sensor," which aids in identifying and referencing the specific market segment covered.
12. How do I determine which pricing option suits my needs best?
The pricing options vary based on user requirements and access needs. Individual users may opt for single-user licenses, while businesses requiring broader access may choose multi-user or enterprise licenses for cost-effective access to the report.
13. Are there any additional resources or data provided in the Traffic Sensor report?
While the report offers comprehensive insights, it's advisable to review the specific contents or supplementary materials provided to ascertain if additional resources or data are available.
14. How can I stay updated on further developments or reports in the Traffic Sensor?
To stay informed about further developments, trends, and reports in the Traffic Sensor, consider subscribing to industry newsletters, following relevant companies and organizations, or regularly checking reputable industry news sources and publications.
Methodology
Step 1 - Identification of Relevant Samples Size from Population Database


Step 2 - Approaches for Defining Global Market Size (Value, Volume* & Price*)

Note*: In applicable scenarios
Step 3 - Data Sources
Primary Research
- Web Analytics
- Survey Reports
- Research Institute
- Latest Research Reports
- Opinion Leaders
Secondary Research
- Annual Reports
- White Paper
- Latest Press Release
- Industry Association
- Paid Database
- Investor Presentations

Step 4 - Data Triangulation
Involves using different sources of information in order to increase the validity of a study
These sources are likely to be stakeholders in a program - participants, other researchers, program staff, other community members, and so on.
Then we put all data in single framework & apply various statistical tools to find out the dynamic on the market.
During the analysis stage, feedback from the stakeholder groups would be compared to determine areas of agreement as well as areas of divergence

