

Key Insights
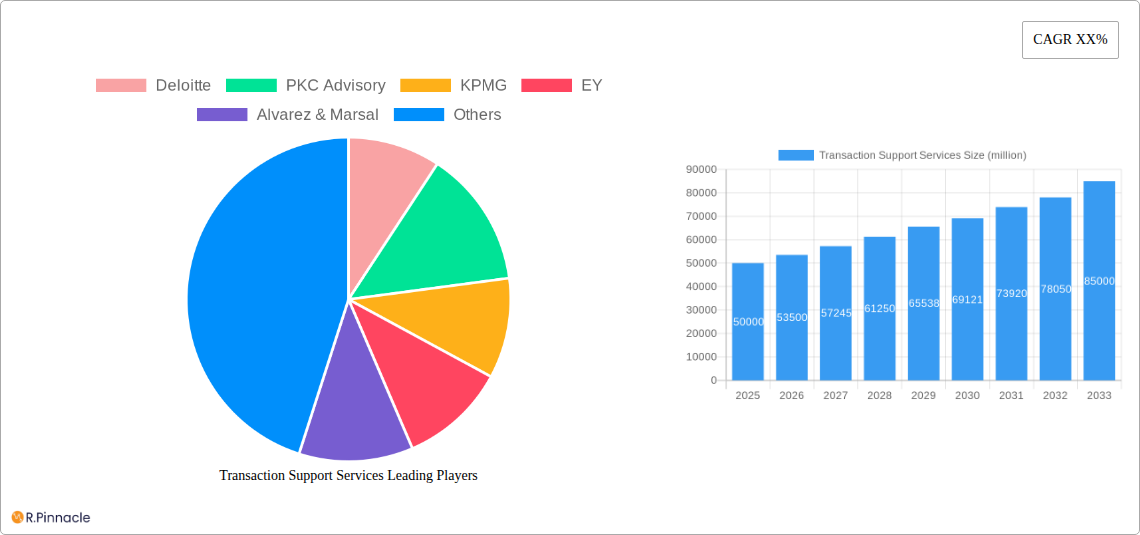
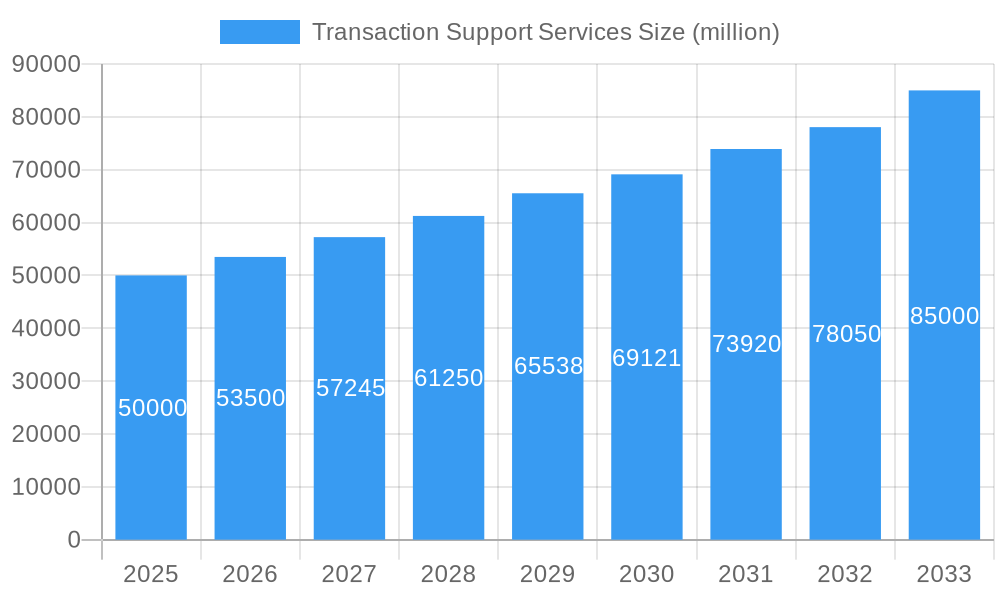
The global Transaction Support Services market is experiencing robust growth, driven by a surge in mergers and acquisitions (M&A) activity, increasing cross-border transactions, and the rising complexity of deal structures. The market, estimated at $50 billion in 2025, is projected to achieve a compound annual growth rate (CAGR) of 7% from 2025 to 2033, reaching approximately $85 billion by 2033. This growth is fueled by several key factors. Firstly, the ongoing digital transformation across various industries is leading to a greater demand for specialized transaction support services, including due diligence, valuation, and integration support. Secondly, regulatory changes and increased scrutiny necessitate expert advice and support throughout the entire transaction lifecycle. Finally, a growing preference for outsourcing non-core functions enables companies to focus on strategic initiatives, further driving demand for professional transaction support services. Leading players such as Deloitte, PwC, KPMG, and EY dominate the market, leveraging their extensive experience and global reach.
Transaction Support Services Market Size (In Billion)
However, certain factors could restrain market growth. Economic uncertainty and geopolitical instability can impact M&A activity, thus affecting demand for these services. Furthermore, the emergence of technology-driven solutions and the increasing availability of readily accessible data may pose challenges to the traditional consulting model. Nevertheless, the ongoing need for specialized expertise in complex transactions, particularly in highly regulated sectors like finance and healthcare, is expected to ensure continued expansion of the market. Segmentation within the market is likely focused on service type (due diligence, valuation, etc.), industry vertical, and geographical region, with North America and Europe currently representing the largest market shares. This necessitates a nuanced approach by service providers to tailor their offerings to specific client needs and regional dynamics.
Transaction Support Services Company Market Share
This comprehensive report provides an in-depth analysis of the global Transaction Support Services market, offering invaluable insights for industry professionals, investors, and strategic decision-makers. With a study period spanning 2019-2033, a base year of 2025, and a forecast period of 2025-2033, this report leverages extensive data analysis to provide a clear understanding of current market dynamics and future growth trajectories. The global market is estimated to reach xx million by 2025 and is projected to continue its strong growth, reaching xx million by 2033.
Transaction Support Services Market Structure & Innovation Trends
The Transaction Support Services market is characterized by a moderately concentrated structure, with key players like Deloitte, KPMG, EY, and PwC holding significant market share. The combined market share of these top four firms is estimated at 40% in 2025. However, the market also includes a multitude of smaller, specialized firms. Innovation is driven primarily by advancements in technology, including AI and machine learning for data analysis and automation of tasks. Regulatory frameworks, particularly those related to data privacy and security, are increasingly influencing market dynamics. The market experiences limited product substitution, with services largely tailored to specific transaction types. End-user demographics are broad, encompassing businesses of all sizes across various industries. M&A activity within the sector is significant, with deal values exceeding $xx million annually in recent years. This level of consolidation is expected to continue.
- Market Concentration: Top 4 players holding approximately 40% market share in 2025.
- Innovation Drivers: AI, machine learning, data analytics automation.
- M&A Activity: Annual deal values exceeding $xx million.
Transaction Support Services Market Dynamics & Trends
The Transaction Support Services market exhibits robust growth, driven by increasing global M&A activity, the rising complexity of transactions, and the growing need for specialized expertise. The market is experiencing technological disruption through the adoption of cloud-based solutions, data analytics tools, and AI-powered platforms that enhance efficiency and accuracy. Consumer preferences are shifting towards more agile, technology-driven services that offer greater transparency and cost-effectiveness. Competitive dynamics are marked by intense competition among established players and the emergence of niche players specializing in specific transaction types or industry verticals. The Compound Annual Growth Rate (CAGR) is projected to be xx% during the forecast period (2025-2033), with market penetration steadily increasing across various industry segments.
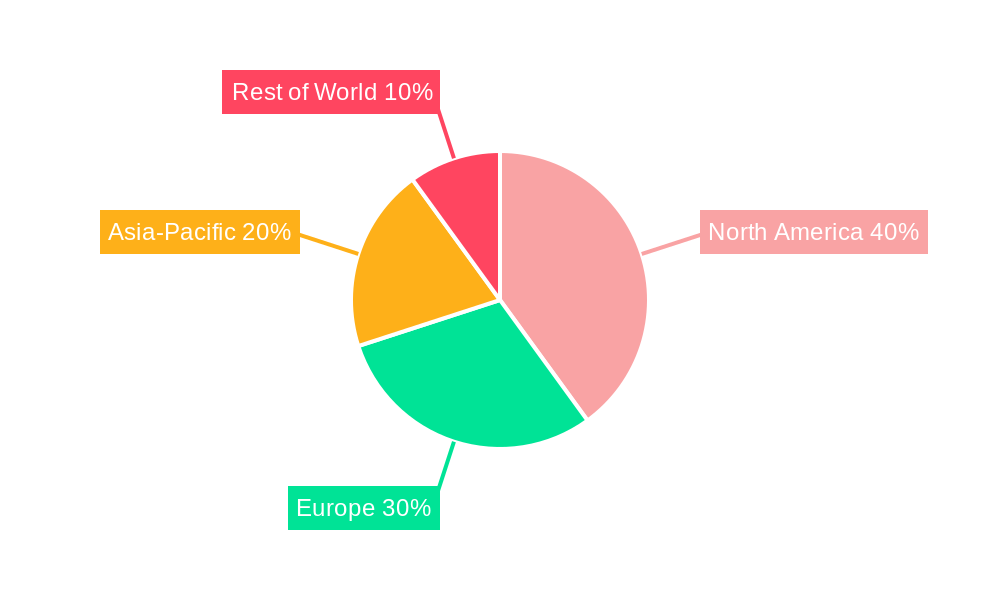
Dominant Regions & Segments in Transaction Support Services
North America currently dominates the Transaction Support Services market, driven by a mature economy, high levels of M&A activity, and a strong regulatory environment. Other regions, such as Europe and Asia-Pacific, are experiencing significant growth, fueled by economic expansion and increasing demand for professional services.
- Key Drivers in North America:
- Mature financial markets and high M&A activity.
- Stringent regulatory compliance requirements.
- High concentration of large corporations and financial institutions.
- Key Drivers in Europe:
- Increasing cross-border M&A transactions.
- Strong regulatory oversight.
- Growing adoption of technology-driven services.
- Key Drivers in Asia-Pacific:
- Rapid economic growth and infrastructure development.
- Expanding middle class and increased consumer spending.
- Growing demand for specialized financial expertise.
Transaction Support Services Product Innovations
Recent product innovations in the Transaction Support Services sector focus on enhancing the efficiency and effectiveness of transaction processes through the integration of advanced technologies such as AI, machine learning, and blockchain. These innovations improve data analysis, risk assessment, due diligence, and regulatory compliance, ultimately delivering superior value and reducing costs for clients. The market is witnessing the emergence of specialized software platforms and analytical tools tailored to specific transaction types, providing more efficient and targeted solutions.
Report Scope & Segmentation Analysis
This report provides a comprehensive analysis of the Transaction Support Services market, segmented by service type (e.g., financial due diligence, valuation, transaction advisory), industry vertical (e.g., technology, healthcare, manufacturing), and geography. Each segment presents distinct growth trajectories and competitive landscapes. The market size and growth projections for each segment are detailed in the report. The competitive landscape analysis for each segment provides an overview of the key players, their market share, and competitive strategies.
Key Drivers of Transaction Support Services Growth
Several factors are driving growth in the Transaction Support Services market. Firstly, an increase in M&A activity, driven by both organic growth strategies and consolidation within industries, requires sophisticated support services. Secondly, the growing complexity of transactions, particularly in cross-border deals, necessitates specialized expertise. Thirdly, enhanced regulatory scrutiny and stricter compliance requirements necessitate greater reliance on specialized professionals. Finally, the increasing adoption of technology, specifically AI and machine learning, is creating new opportunities for streamlining processes and improving efficiency.
Challenges in the Transaction Support Services Sector
The Transaction Support Services sector faces certain challenges. Maintaining data security and protecting client confidentiality in a digital world is paramount. Competition is intense, with a large number of players in the market, leading to pressure on pricing. Meeting regulatory changes across diverse jurisdictions can be complex and expensive, creating operational burdens. Finally, ensuring the availability of skilled professionals in a competitive talent market is crucial.
Emerging Opportunities in Transaction Support Services
Several emerging opportunities exist within the Transaction Support Services market. The increasing adoption of cloud-based solutions and data analytics platforms offers the chance for firms to improve operational efficiency and gain a competitive edge. The growing focus on environmental, social, and governance (ESG) factors in transactions presents a new segment that will require expertise. Expansion into emerging markets offers significant potential for growth.
Leading Players in the Transaction Support Services Market
- Deloitte
- PKC Advisory
- KPMG
- EY
- Alvarez & Marsal
- Baker Tilly Limited
- Menzies LLP
- PwC
- Moore mc
- Teneo
- SLR Consulting
- B.Riley Financial
- RSM
- BDO
- Intralinks
- BSM Consulting
- HMT LLP
- FTI Consulting
Key Developments in Transaction Support Services Industry
- 2022 Q4: Increased adoption of AI-powered due diligence platforms by several major players.
- 2023 Q1: Several mergers and acquisitions amongst smaller firms in the sector.
- 2023 Q3: Launch of a new cloud-based transaction management platform by a leading provider.
Future Outlook for Transaction Support Services Market
The Transaction Support Services market is poised for continued growth, driven by several factors, including the increasing complexity of transactions, the growing demand for specialized expertise, and the ongoing adoption of new technologies. Strategic opportunities lie in leveraging AI and machine learning to streamline processes, expanding into new markets, and focusing on niche areas such as ESG advisory. The market is projected to experience robust growth over the forecast period, creating significant opportunities for established players and new entrants alike.
Transaction Support Services Segmentation
-
1. Application
- 1.1. SMEs
- 1.2. Large Enterprise
-
2. Types
- 2.1. Commercial Due Diligence
- 2.2. M&A Support
- 2.3. Others
Transaction Support Services Segmentation By Geography
-
1. North America
- 1.1. United States
- 1.2. Canada
- 1.3. Mexico
-
2. South America
- 2.1. Brazil
- 2.2. Argentina
- 2.3. Rest of South America
-
3. Europe
- 3.1. United Kingdom
- 3.2. Germany
- 3.3. France
- 3.4. Italy
- 3.5. Spain
- 3.6. Russia
- 3.7. Benelux
- 3.8. Nordics
- 3.9. Rest of Europe
-
4. Middle East & Africa
- 4.1. Turkey
- 4.2. Israel
- 4.3. GCC
- 4.4. North Africa
- 4.5. South Africa
- 4.6. Rest of Middle East & Africa
-
5. Asia Pacific
- 5.1. China
- 5.2. India
- 5.3. Japan
- 5.4. South Korea
- 5.5. ASEAN
- 5.6. Oceania
- 5.7. Rest of Asia Pacific
Transaction Support Services Regional Market Share
Geographic Coverage of Transaction Support Services
Transaction Support Services REPORT HIGHLIGHTS
| Aspects | Details |
|---|---|
| Study Period | 2020-2034 |
| Base Year | 2025 |
| Estimated Year | 2026 |
| Forecast Period | 2026-2034 |
| Historical Period | 2020-2025 |
| Growth Rate | CAGR of 6.68% from 2020-2034 |
| Segmentation |
|
Table of Contents
- 1. Introduction
- 1.1. Research Scope
- 1.2. Market Segmentation
- 1.3. Research Methodology
- 1.4. Definitions and Assumptions
- 2. Executive Summary
- 2.1. Introduction
- 3. Market Dynamics
- 3.1. Introduction
- 3.2. Market Drivers
- 3.3. Market Restrains
- 3.4. Market Trends
- 4. Market Factor Analysis
- 4.1. Porters Five Forces
- 4.2. Supply/Value Chain
- 4.3. PESTEL analysis
- 4.4. Market Entropy
- 4.5. Patent/Trademark Analysis
- 5. Global Transaction Support Services Analysis, Insights and Forecast, 2020-2032
- 5.1. Market Analysis, Insights and Forecast - by Application
- 5.1.1. SMEs
- 5.1.2. Large Enterprise
- 5.2. Market Analysis, Insights and Forecast - by Types
- 5.2.1. Commercial Due Diligence
- 5.2.2. M&A Support
- 5.2.3. Others
- 5.3. Market Analysis, Insights and Forecast - by Region
- 5.3.1. North America
- 5.3.2. South America
- 5.3.3. Europe
- 5.3.4. Middle East & Africa
- 5.3.5. Asia Pacific
- 5.1. Market Analysis, Insights and Forecast - by Application
- 6. North America Transaction Support Services Analysis, Insights and Forecast, 2020-2032
- 6.1. Market Analysis, Insights and Forecast - by Application
- 6.1.1. SMEs
- 6.1.2. Large Enterprise
- 6.2. Market Analysis, Insights and Forecast - by Types
- 6.2.1. Commercial Due Diligence
- 6.2.2. M&A Support
- 6.2.3. Others
- 6.1. Market Analysis, Insights and Forecast - by Application
- 7. South America Transaction Support Services Analysis, Insights and Forecast, 2020-2032
- 7.1. Market Analysis, Insights and Forecast - by Application
- 7.1.1. SMEs
- 7.1.2. Large Enterprise
- 7.2. Market Analysis, Insights and Forecast - by Types
- 7.2.1. Commercial Due Diligence
- 7.2.2. M&A Support
- 7.2.3. Others
- 7.1. Market Analysis, Insights and Forecast - by Application
- 8. Europe Transaction Support Services Analysis, Insights and Forecast, 2020-2032
- 8.1. Market Analysis, Insights and Forecast - by Application
- 8.1.1. SMEs
- 8.1.2. Large Enterprise
- 8.2. Market Analysis, Insights and Forecast - by Types
- 8.2.1. Commercial Due Diligence
- 8.2.2. M&A Support
- 8.2.3. Others
- 8.1. Market Analysis, Insights and Forecast - by Application
- 9. Middle East & Africa Transaction Support Services Analysis, Insights and Forecast, 2020-2032
- 9.1. Market Analysis, Insights and Forecast - by Application
- 9.1.1. SMEs
- 9.1.2. Large Enterprise
- 9.2. Market Analysis, Insights and Forecast - by Types
- 9.2.1. Commercial Due Diligence
- 9.2.2. M&A Support
- 9.2.3. Others
- 9.1. Market Analysis, Insights and Forecast - by Application
- 10. Asia Pacific Transaction Support Services Analysis, Insights and Forecast, 2020-2032
- 10.1. Market Analysis, Insights and Forecast - by Application
- 10.1.1. SMEs
- 10.1.2. Large Enterprise
- 10.2. Market Analysis, Insights and Forecast - by Types
- 10.2.1. Commercial Due Diligence
- 10.2.2. M&A Support
- 10.2.3. Others
- 10.1. Market Analysis, Insights and Forecast - by Application
- 11. Competitive Analysis
- 11.1. Global Market Share Analysis 2025
- 11.2. Company Profiles
- 11.2.1 Deloitte
- 11.2.1.1. Overview
- 11.2.1.2. Products
- 11.2.1.3. SWOT Analysis
- 11.2.1.4. Recent Developments
- 11.2.1.5. Financials (Based on Availability)
- 11.2.2 PKC Advisory
- 11.2.2.1. Overview
- 11.2.2.2. Products
- 11.2.2.3. SWOT Analysis
- 11.2.2.4. Recent Developments
- 11.2.2.5. Financials (Based on Availability)
- 11.2.3 KPMG
- 11.2.3.1. Overview
- 11.2.3.2. Products
- 11.2.3.3. SWOT Analysis
- 11.2.3.4. Recent Developments
- 11.2.3.5. Financials (Based on Availability)
- 11.2.4 EY
- 11.2.4.1. Overview
- 11.2.4.2. Products
- 11.2.4.3. SWOT Analysis
- 11.2.4.4. Recent Developments
- 11.2.4.5. Financials (Based on Availability)
- 11.2.5 Alvarez & Marsal
- 11.2.5.1. Overview
- 11.2.5.2. Products
- 11.2.5.3. SWOT Analysis
- 11.2.5.4. Recent Developments
- 11.2.5.5. Financials (Based on Availability)
- 11.2.6 Baker Tilly Limited
- 11.2.6.1. Overview
- 11.2.6.2. Products
- 11.2.6.3. SWOT Analysis
- 11.2.6.4. Recent Developments
- 11.2.6.5. Financials (Based on Availability)
- 11.2.7 Menzies LLP
- 11.2.7.1. Overview
- 11.2.7.2. Products
- 11.2.7.3. SWOT Analysis
- 11.2.7.4. Recent Developments
- 11.2.7.5. Financials (Based on Availability)
- 11.2.8 PwC
- 11.2.8.1. Overview
- 11.2.8.2. Products
- 11.2.8.3. SWOT Analysis
- 11.2.8.4. Recent Developments
- 11.2.8.5. Financials (Based on Availability)
- 11.2.9 Moore mc
- 11.2.9.1. Overview
- 11.2.9.2. Products
- 11.2.9.3. SWOT Analysis
- 11.2.9.4. Recent Developments
- 11.2.9.5. Financials (Based on Availability)
- 11.2.10 Teneo
- 11.2.10.1. Overview
- 11.2.10.2. Products
- 11.2.10.3. SWOT Analysis
- 11.2.10.4. Recent Developments
- 11.2.10.5. Financials (Based on Availability)
- 11.2.11 SLR Consulting
- 11.2.11.1. Overview
- 11.2.11.2. Products
- 11.2.11.3. SWOT Analysis
- 11.2.11.4. Recent Developments
- 11.2.11.5. Financials (Based on Availability)
- 11.2.12 B.Riley Financial
- 11.2.12.1. Overview
- 11.2.12.2. Products
- 11.2.12.3. SWOT Analysis
- 11.2.12.4. Recent Developments
- 11.2.12.5. Financials (Based on Availability)
- 11.2.13 RSM
- 11.2.13.1. Overview
- 11.2.13.2. Products
- 11.2.13.3. SWOT Analysis
- 11.2.13.4. Recent Developments
- 11.2.13.5. Financials (Based on Availability)
- 11.2.14 BDO
- 11.2.14.1. Overview
- 11.2.14.2. Products
- 11.2.14.3. SWOT Analysis
- 11.2.14.4. Recent Developments
- 11.2.14.5. Financials (Based on Availability)
- 11.2.15 Intralinks
- 11.2.15.1. Overview
- 11.2.15.2. Products
- 11.2.15.3. SWOT Analysis
- 11.2.15.4. Recent Developments
- 11.2.15.5. Financials (Based on Availability)
- 11.2.16 BSM Consulting
- 11.2.16.1. Overview
- 11.2.16.2. Products
- 11.2.16.3. SWOT Analysis
- 11.2.16.4. Recent Developments
- 11.2.16.5. Financials (Based on Availability)
- 11.2.17 HMT LLP
- 11.2.17.1. Overview
- 11.2.17.2. Products
- 11.2.17.3. SWOT Analysis
- 11.2.17.4. Recent Developments
- 11.2.17.5. Financials (Based on Availability)
- 11.2.18 FTI Consulting
- 11.2.18.1. Overview
- 11.2.18.2. Products
- 11.2.18.3. SWOT Analysis
- 11.2.18.4. Recent Developments
- 11.2.18.5. Financials (Based on Availability)
- 11.2.1 Deloitte
List of Figures
- Figure 1: Global Transaction Support Services Revenue Breakdown (undefined, %) by Region 2025 & 2033
- Figure 2: North America Transaction Support Services Revenue (undefined), by Application 2025 & 2033
- Figure 3: North America Transaction Support Services Revenue Share (%), by Application 2025 & 2033
- Figure 4: North America Transaction Support Services Revenue (undefined), by Types 2025 & 2033
- Figure 5: North America Transaction Support Services Revenue Share (%), by Types 2025 & 2033
- Figure 6: North America Transaction Support Services Revenue (undefined), by Country 2025 & 2033
- Figure 7: North America Transaction Support Services Revenue Share (%), by Country 2025 & 2033
- Figure 8: South America Transaction Support Services Revenue (undefined), by Application 2025 & 2033
- Figure 9: South America Transaction Support Services Revenue Share (%), by Application 2025 & 2033
- Figure 10: South America Transaction Support Services Revenue (undefined), by Types 2025 & 2033
- Figure 11: South America Transaction Support Services Revenue Share (%), by Types 2025 & 2033
- Figure 12: South America Transaction Support Services Revenue (undefined), by Country 2025 & 2033
- Figure 13: South America Transaction Support Services Revenue Share (%), by Country 2025 & 2033
- Figure 14: Europe Transaction Support Services Revenue (undefined), by Application 2025 & 2033
- Figure 15: Europe Transaction Support Services Revenue Share (%), by Application 2025 & 2033
- Figure 16: Europe Transaction Support Services Revenue (undefined), by Types 2025 & 2033
- Figure 17: Europe Transaction Support Services Revenue Share (%), by Types 2025 & 2033
- Figure 18: Europe Transaction Support Services Revenue (undefined), by Country 2025 & 2033
- Figure 19: Europe Transaction Support Services Revenue Share (%), by Country 2025 & 2033
- Figure 20: Middle East & Africa Transaction Support Services Revenue (undefined), by Application 2025 & 2033
- Figure 21: Middle East & Africa Transaction Support Services Revenue Share (%), by Application 2025 & 2033
- Figure 22: Middle East & Africa Transaction Support Services Revenue (undefined), by Types 2025 & 2033
- Figure 23: Middle East & Africa Transaction Support Services Revenue Share (%), by Types 2025 & 2033
- Figure 24: Middle East & Africa Transaction Support Services Revenue (undefined), by Country 2025 & 2033
- Figure 25: Middle East & Africa Transaction Support Services Revenue Share (%), by Country 2025 & 2033
- Figure 26: Asia Pacific Transaction Support Services Revenue (undefined), by Application 2025 & 2033
- Figure 27: Asia Pacific Transaction Support Services Revenue Share (%), by Application 2025 & 2033
- Figure 28: Asia Pacific Transaction Support Services Revenue (undefined), by Types 2025 & 2033
- Figure 29: Asia Pacific Transaction Support Services Revenue Share (%), by Types 2025 & 2033
- Figure 30: Asia Pacific Transaction Support Services Revenue (undefined), by Country 2025 & 2033
- Figure 31: Asia Pacific Transaction Support Services Revenue Share (%), by Country 2025 & 2033
List of Tables
- Table 1: Global Transaction Support Services Revenue undefined Forecast, by Application 2020 & 2033
- Table 2: Global Transaction Support Services Revenue undefined Forecast, by Types 2020 & 2033
- Table 3: Global Transaction Support Services Revenue undefined Forecast, by Region 2020 & 2033
- Table 4: Global Transaction Support Services Revenue undefined Forecast, by Application 2020 & 2033
- Table 5: Global Transaction Support Services Revenue undefined Forecast, by Types 2020 & 2033
- Table 6: Global Transaction Support Services Revenue undefined Forecast, by Country 2020 & 2033
- Table 7: United States Transaction Support Services Revenue (undefined) Forecast, by Application 2020 & 2033
- Table 8: Canada Transaction Support Services Revenue (undefined) Forecast, by Application 2020 & 2033
- Table 9: Mexico Transaction Support Services Revenue (undefined) Forecast, by Application 2020 & 2033
- Table 10: Global Transaction Support Services Revenue undefined Forecast, by Application 2020 & 2033
- Table 11: Global Transaction Support Services Revenue undefined Forecast, by Types 2020 & 2033
- Table 12: Global Transaction Support Services Revenue undefined Forecast, by Country 2020 & 2033
- Table 13: Brazil Transaction Support Services Revenue (undefined) Forecast, by Application 2020 & 2033
- Table 14: Argentina Transaction Support Services Revenue (undefined) Forecast, by Application 2020 & 2033
- Table 15: Rest of South America Transaction Support Services Revenue (undefined) Forecast, by Application 2020 & 2033
- Table 16: Global Transaction Support Services Revenue undefined Forecast, by Application 2020 & 2033
- Table 17: Global Transaction Support Services Revenue undefined Forecast, by Types 2020 & 2033
- Table 18: Global Transaction Support Services Revenue undefined Forecast, by Country 2020 & 2033
- Table 19: United Kingdom Transaction Support Services Revenue (undefined) Forecast, by Application 2020 & 2033
- Table 20: Germany Transaction Support Services Revenue (undefined) Forecast, by Application 2020 & 2033
- Table 21: France Transaction Support Services Revenue (undefined) Forecast, by Application 2020 & 2033
- Table 22: Italy Transaction Support Services Revenue (undefined) Forecast, by Application 2020 & 2033
- Table 23: Spain Transaction Support Services Revenue (undefined) Forecast, by Application 2020 & 2033
- Table 24: Russia Transaction Support Services Revenue (undefined) Forecast, by Application 2020 & 2033
- Table 25: Benelux Transaction Support Services Revenue (undefined) Forecast, by Application 2020 & 2033
- Table 26: Nordics Transaction Support Services Revenue (undefined) Forecast, by Application 2020 & 2033
- Table 27: Rest of Europe Transaction Support Services Revenue (undefined) Forecast, by Application 2020 & 2033
- Table 28: Global Transaction Support Services Revenue undefined Forecast, by Application 2020 & 2033
- Table 29: Global Transaction Support Services Revenue undefined Forecast, by Types 2020 & 2033
- Table 30: Global Transaction Support Services Revenue undefined Forecast, by Country 2020 & 2033
- Table 31: Turkey Transaction Support Services Revenue (undefined) Forecast, by Application 2020 & 2033
- Table 32: Israel Transaction Support Services Revenue (undefined) Forecast, by Application 2020 & 2033
- Table 33: GCC Transaction Support Services Revenue (undefined) Forecast, by Application 2020 & 2033
- Table 34: North Africa Transaction Support Services Revenue (undefined) Forecast, by Application 2020 & 2033
- Table 35: South Africa Transaction Support Services Revenue (undefined) Forecast, by Application 2020 & 2033
- Table 36: Rest of Middle East & Africa Transaction Support Services Revenue (undefined) Forecast, by Application 2020 & 2033
- Table 37: Global Transaction Support Services Revenue undefined Forecast, by Application 2020 & 2033
- Table 38: Global Transaction Support Services Revenue undefined Forecast, by Types 2020 & 2033
- Table 39: Global Transaction Support Services Revenue undefined Forecast, by Country 2020 & 2033
- Table 40: China Transaction Support Services Revenue (undefined) Forecast, by Application 2020 & 2033
- Table 41: India Transaction Support Services Revenue (undefined) Forecast, by Application 2020 & 2033
- Table 42: Japan Transaction Support Services Revenue (undefined) Forecast, by Application 2020 & 2033
- Table 43: South Korea Transaction Support Services Revenue (undefined) Forecast, by Application 2020 & 2033
- Table 44: ASEAN Transaction Support Services Revenue (undefined) Forecast, by Application 2020 & 2033
- Table 45: Oceania Transaction Support Services Revenue (undefined) Forecast, by Application 2020 & 2033
- Table 46: Rest of Asia Pacific Transaction Support Services Revenue (undefined) Forecast, by Application 2020 & 2033
Frequently Asked Questions
1. What is the projected Compound Annual Growth Rate (CAGR) of the Transaction Support Services?
The projected CAGR is approximately 6.68%.
2. Which companies are prominent players in the Transaction Support Services?
Key companies in the market include Deloitte, PKC Advisory, KPMG, EY, Alvarez & Marsal, Baker Tilly Limited, Menzies LLP, PwC, Moore mc, Teneo, SLR Consulting, B.Riley Financial, RSM, BDO, Intralinks, BSM Consulting, HMT LLP, FTI Consulting.
3. What are the main segments of the Transaction Support Services?
The market segments include Application, Types.
4. Can you provide details about the market size?
The market size is estimated to be USD XXX N/A as of 2022.
5. What are some drivers contributing to market growth?
N/A
6. What are the notable trends driving market growth?
N/A
7. Are there any restraints impacting market growth?
N/A
8. Can you provide examples of recent developments in the market?
N/A
9. What pricing options are available for accessing the report?
Pricing options include single-user, multi-user, and enterprise licenses priced at USD 3950.00, USD 5925.00, and USD 7900.00 respectively.
10. Is the market size provided in terms of value or volume?
The market size is provided in terms of value, measured in N/A.
11. Are there any specific market keywords associated with the report?
Yes, the market keyword associated with the report is "Transaction Support Services," which aids in identifying and referencing the specific market segment covered.
12. How do I determine which pricing option suits my needs best?
The pricing options vary based on user requirements and access needs. Individual users may opt for single-user licenses, while businesses requiring broader access may choose multi-user or enterprise licenses for cost-effective access to the report.
13. Are there any additional resources or data provided in the Transaction Support Services report?
While the report offers comprehensive insights, it's advisable to review the specific contents or supplementary materials provided to ascertain if additional resources or data are available.
14. How can I stay updated on further developments or reports in the Transaction Support Services?
To stay informed about further developments, trends, and reports in the Transaction Support Services, consider subscribing to industry newsletters, following relevant companies and organizations, or regularly checking reputable industry news sources and publications.
Methodology
Step 1 - Identification of Relevant Samples Size from Population Database


Step 2 - Approaches for Defining Global Market Size (Value, Volume* & Price*)

Note*: In applicable scenarios
Step 3 - Data Sources
Primary Research
- Web Analytics
- Survey Reports
- Research Institute
- Latest Research Reports
- Opinion Leaders
Secondary Research
- Annual Reports
- White Paper
- Latest Press Release
- Industry Association
- Paid Database
- Investor Presentations

Step 4 - Data Triangulation
Involves using different sources of information in order to increase the validity of a study
These sources are likely to be stakeholders in a program - participants, other researchers, program staff, other community members, and so on.
Then we put all data in single framework & apply various statistical tools to find out the dynamic on the market.
During the analysis stage, feedback from the stakeholder groups would be compared to determine areas of agreement as well as areas of divergence