

Key Insights
The global travel accommodation sector is poised for significant expansion, with a projected Compound Annual Growth Rate (CAGR) of 9.56% from 2025 to 2033. This growth is driven by a rising global middle class, particularly in Asia-Pacific, fueling increased leisure travel and demand for diverse lodging. Technological advancements, including intuitive booking platforms and widespread mobile app adoption, are enhancing customer experience and streamlining reservations. The burgeoning popularity of unique accommodations such as boutique hotels and short-term rentals like Airbnb further diversifies the market and caters to evolving traveler preferences. The market is segmented by platform (mobile applications and websites) and booking channel (third-party online travel agencies and direct booking channels). While third-party platforms like Booking.com, Expedia, and TripAdvisor currently lead, direct booking channels are experiencing robust growth as accommodations invest in proprietary online presence and loyalty programs to mitigate third-party commissions. Geographically, North America and Europe maintain substantial market share, but the Asia-Pacific region, notably China and India, presents exceptional growth opportunities.
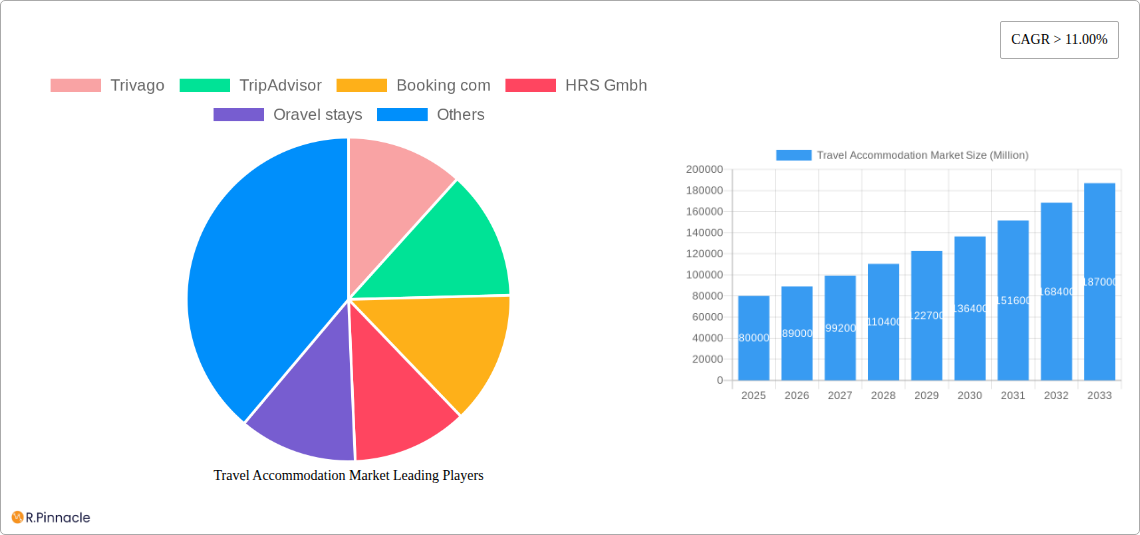
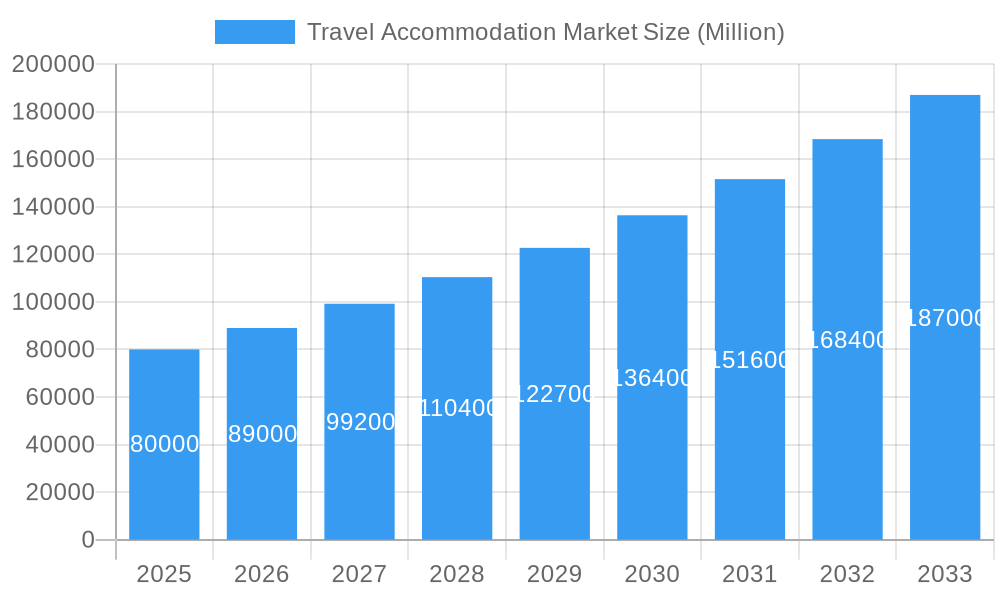
Travel Accommodation Market Market Size (In Billion)
Market challenges include economic volatility, geopolitical uncertainties, and seasonal travel fluctuations. Nevertheless, the industry's inherent adaptability is expected to sustain its upward trajectory. The competitive environment is characterized by a high degree of concentration, with major players such as Booking.com, Expedia, and Airbnb alongside numerous regional entities. Future growth strategies will likely focus on leveraging data analytics for personalized traveler experiences, adopting innovative technologies like AI-powered customer service, and expanding presence in nascent markets. The continuous evolution of traveler expectations and technological innovation will ensure the travel accommodation market remains a dynamic and competitive arena, offering significant opportunities and challenges for all stakeholders.
Travel Accommodation Market Company Market Share
Travel Accommodation Market Analysis: 2025-2033
This comprehensive market report delivers an in-depth analysis of the global Travel Accommodation Market, providing crucial insights for industry professionals, investors, and strategic planners. Covering the period from 2025 to 2033, with 2025 as the base year, this report meticulously evaluates market dynamics, competitive landscapes, and emerging trends. The market size is projected to reach 961.6 billion by 2033, indicating substantial growth potential.
Travel Accommodation Market Structure & Innovation Trends
This section analyzes the market's competitive landscape, focusing on market concentration, innovation drivers, regulatory frameworks, product substitutes, end-user demographics, and mergers & acquisitions (M&A) activities. The report reveals a moderately concentrated market with key players like Booking.com, Expedia, and Airbnb holding significant market share. However, the market also exhibits a high degree of dynamism due to continuous innovation and disruption.
- Market Concentration: Booking.com and Expedia hold a combined xx% market share in 2025, while Airbnb contributes another xx%. Smaller players, including Trivago, TripAdvisor, and AccorHotels, actively compete for market share.
- Innovation Drivers: The adoption of AI-powered recommendation systems, personalized travel experiences, and sustainable tourism initiatives are key drivers of innovation.
- Regulatory Frameworks: Government regulations concerning data privacy, consumer protection, and taxation significantly influence market operations.
- Product Substitutes: Home-sharing platforms and alternative accommodation options (e.g., hostels, guesthouses) pose competitive pressure.
- End-User Demographics: The millennial and Gen Z segments are driving growth due to their high travel frequency and preference for online booking platforms.
- M&A Activities: The report details significant M&A activities within the sector, with a total deal value of approximately xx Million during the historical period (2019-2024), shaping the competitive landscape.
Travel Accommodation Market Dynamics & Trends
This section explores the key drivers and trends shaping the Travel Accommodation Market. The market is experiencing robust growth, fueled by rising disposable incomes, increased tourism, and the proliferation of online travel agencies (OTAs). Technological advancements, shifting consumer preferences, and intense competition further influence market dynamics. The report projects a Compound Annual Growth Rate (CAGR) of xx% during the forecast period (2025-2033), with significant market penetration anticipated in emerging economies.
Dominant Regions & Segments in Travel Accommodation Market
This section identifies the leading regions and segments within the Travel Accommodation Market. North America and Europe currently hold the largest market shares, driven by robust tourism infrastructure and high disposable incomes. However, the Asia-Pacific region is projected to experience the highest growth rate during the forecast period.
By Platform:
- Mobile Application: Mobile booking is experiencing rapid growth due to its convenience and accessibility, expected to account for xx% of total bookings by 2033. Key drivers include increased smartphone penetration and user-friendly interfaces.
- Website: Website bookings remain significant, particularly for detailed travel planning and comparison shopping.
By Mode of Booking:
- Third-party Online Portals: OTAs like Booking.com and Expedia dominate this segment, offering wide selections and competitive pricing.
- Direct/Captive Portals: Hotel chains are increasingly investing in direct booking channels to enhance customer relationships and reduce reliance on OTAs.
Key Drivers:
- Strong economic growth in certain regions
- Development of tourism infrastructure (e.g., airports, transportation networks)
- Favorable government policies supporting tourism
Travel Accommodation Market Product Innovations
The Travel Accommodation Market is witnessing continuous product innovation, with a focus on enhancing user experience, personalization, and sustainability. The emergence of AI-powered recommendation systems, virtual reality (VR) tours, and personalized travel packages are transforming the industry. These innovations aim to create seamless and engaging travel experiences. The increasing integration of blockchain technology for secure payments and data management is also gaining traction.
Report Scope & Segmentation Analysis
This report provides a comprehensive analysis of the Travel Accommodation Market, segmented by platform (mobile application, website) and mode of booking (third-party online portals, direct/captive portals). Each segment's market size, growth projections, and competitive dynamics are thoroughly examined. Significant growth is projected for mobile application bookings and direct/captive portal usage.
Key Drivers of Travel Accommodation Market Growth
The Travel Accommodation Market's growth is driven by several factors: rising disposable incomes globally leading to increased travel spending, advancements in technology enabling seamless booking experiences, and supportive government policies promoting tourism in various regions. The rise of budget airlines and the increasing accessibility of destinations also contribute to market expansion.
Challenges in the Travel Accommodation Market Sector
The Travel Accommodation Market faces challenges including increasing competition from various platforms, fluctuating travel patterns due to economic downturns and global events, stringent regulations, and the need to maintain data security and customer privacy. Supply chain disruptions impacting travel logistics also pose significant challenges.
Emerging Opportunities in Travel Accommodation Market
Emerging opportunities include the expansion into niche travel segments like sustainable tourism and adventure travel, leveraging emerging technologies like AI for personalized recommendations and advanced analytics, and catering to the evolving preferences of different demographic groups. Expansion into untapped markets in developing economies also presents significant potential.
Leading Players in the Travel Accommodation Market Market
- Trivago
- TripAdvisor
- Booking.com
- HRS Gmbh
- Oravel stays
- AirBnb
- AccorHotels
- Agoda
- Hotels.com
- Expedia
- OUI sncf
Key Developments in Travel Accommodation Market Industry
- 2022 Q4: Booking.com launches a new sustainability initiative.
- 2023 Q1: Expedia acquires a smaller OTA specializing in adventure travel.
- 2023 Q3: Airbnb implements stricter verification measures for hosts.
Future Outlook for Travel Accommodation Market Market
The Travel Accommodation Market is poised for continued growth, driven by technological advancements, evolving consumer preferences, and the expansion into new markets. Strategic partnerships, targeted marketing campaigns, and personalized travel experiences will be crucial for success in this dynamic sector. The focus on sustainable and responsible tourism will further shape the market's future.
Travel Accommodation Market Segmentation
-
1. Platform
- 1.1. Mobile application
- 1.2. Website
-
2. Mode of booking
- 2.1. Third party online portals
- 2.2. Direct/captive portals
Travel Accommodation Market Segmentation By Geography
-
1. North America
- 1.1. United States
- 1.2. Canada
- 1.3. Mexico
-
2. South America
- 2.1. Brazil
- 2.2. Argentina
- 2.3. Rest of South America
-
3. Europe
- 3.1. United Kingdom
- 3.2. Germany
- 3.3. France
- 3.4. Italy
- 3.5. Spain
- 3.6. Russia
- 3.7. Benelux
- 3.8. Nordics
- 3.9. Rest of Europe
-
4. Middle East & Africa
- 4.1. Turkey
- 4.2. Israel
- 4.3. GCC
- 4.4. North Africa
- 4.5. South Africa
- 4.6. Rest of Middle East & Africa
-
5. Asia Pacific
- 5.1. China
- 5.2. India
- 5.3. Japan
- 5.4. South Korea
- 5.5. ASEAN
- 5.6. Oceania
- 5.7. Rest of Asia Pacific
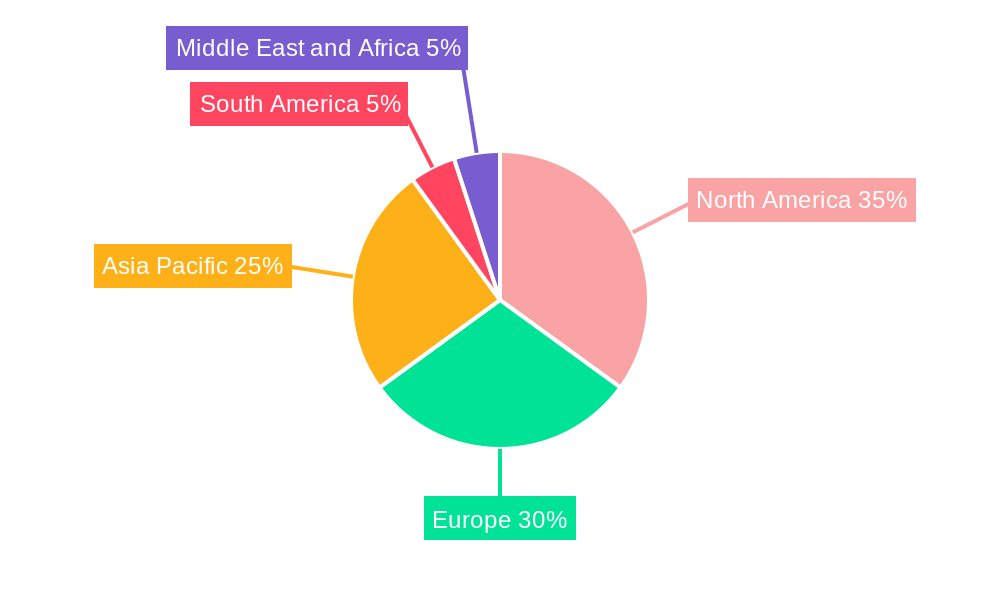
Travel Accommodation Market Regional Market Share
Geographic Coverage of Travel Accommodation Market
Travel Accommodation Market REPORT HIGHLIGHTS
| Aspects | Details |
|---|---|
| Study Period | 2020-2034 |
| Base Year | 2025 |
| Estimated Year | 2026 |
| Forecast Period | 2026-2034 |
| Historical Period | 2020-2025 |
| Growth Rate | CAGR of 9.56% from 2020-2034 |
| Segmentation |
|
Table of Contents
- 1. Introduction
- 1.1. Research Scope
- 1.2. Market Segmentation
- 1.3. Research Objective
- 1.4. Definitions and Assumptions
- 2. Executive Summary
- 2.1. Market Snapshot
- 3. Market Dynamics
- 3.1. Market Drivers
- 3.2. Market Restrains
- 3.3. Market Trends
- 3.4. Market Opportunities
- 4. Market Factor Analysis
- 4.1. Porters Five Forces
- 4.1.1. Bargaining Power of Suppliers
- 4.1.2. Bargaining Power of Buyers
- 4.1.3. Threat of New Entrants
- 4.1.4. Threat of Substitutes
- 4.1.5. Competitive Rivalry
- 4.2. PESTEL analysis
- 4.3. BCG Analysis
- 4.3.1. Stars (High Growth, High Market Share)
- 4.3.2. Cash Cows (Low Growth, High Market Share)
- 4.3.3. Question Mark (High Growth, Low Market Share)
- 4.3.4. Dogs (Low Growth, Low Market Share)
- 4.4. Ansoff Matrix Analysis
- 4.5. Supply Chain Analysis
- 4.6. Regulatory Landscape
- 4.7. Current Market Potential and Opportunity Assessment (TAM–SAM–SOM Framework)
- 4.8. PRI Analyst Note
- 4.1. Porters Five Forces
- 5. Market Analysis, Insights and Forecast 2021-2033
- 5.1. Market Analysis, Insights and Forecast - by Platform
- 5.1.1. Mobile application
- 5.1.2. Website
- 5.2. Market Analysis, Insights and Forecast - by Mode of booking
- 5.2.1. Third party online portals
- 5.2.2. Direct/captive portals
- 5.3. Market Analysis, Insights and Forecast - by Region
- 5.3.1. North America
- 5.3.2. South America
- 5.3.3. Europe
- 5.3.4. Middle East & Africa
- 5.3.5. Asia Pacific
- 5.1. Market Analysis, Insights and Forecast - by Platform
- 6. Global Travel Accommodation Market Analysis, Insights and Forecast, 2021-2033
- 6.1. Market Analysis, Insights and Forecast - by Platform
- 6.1.1. Mobile application
- 6.1.2. Website
- 6.2. Market Analysis, Insights and Forecast - by Mode of booking
- 6.2.1. Third party online portals
- 6.2.2. Direct/captive portals
- 6.1. Market Analysis, Insights and Forecast - by Platform
- 7. North America Travel Accommodation Market Analysis, Insights and Forecast, 2020-2032
- 7.1. Market Analysis, Insights and Forecast - by Platform
- 7.1.1. Mobile application
- 7.1.2. Website
- 7.2. Market Analysis, Insights and Forecast - by Mode of booking
- 7.2.1. Third party online portals
- 7.2.2. Direct/captive portals
- 7.1. Market Analysis, Insights and Forecast - by Platform
- 8. South America Travel Accommodation Market Analysis, Insights and Forecast, 2020-2032
- 8.1. Market Analysis, Insights and Forecast - by Platform
- 8.1.1. Mobile application
- 8.1.2. Website
- 8.2. Market Analysis, Insights and Forecast - by Mode of booking
- 8.2.1. Third party online portals
- 8.2.2. Direct/captive portals
- 8.1. Market Analysis, Insights and Forecast - by Platform
- 9. Europe Travel Accommodation Market Analysis, Insights and Forecast, 2020-2032
- 9.1. Market Analysis, Insights and Forecast - by Platform
- 9.1.1. Mobile application
- 9.1.2. Website
- 9.2. Market Analysis, Insights and Forecast - by Mode of booking
- 9.2.1. Third party online portals
- 9.2.2. Direct/captive portals
- 9.1. Market Analysis, Insights and Forecast - by Platform
- 10. Middle East & Africa Travel Accommodation Market Analysis, Insights and Forecast, 2020-2032
- 10.1. Market Analysis, Insights and Forecast - by Platform
- 10.1.1. Mobile application
- 10.1.2. Website
- 10.2. Market Analysis, Insights and Forecast - by Mode of booking
- 10.2.1. Third party online portals
- 10.2.2. Direct/captive portals
- 10.1. Market Analysis, Insights and Forecast - by Platform
- 11. Asia Pacific Travel Accommodation Market Analysis, Insights and Forecast, 2020-2032
- 11.1. Market Analysis, Insights and Forecast - by Platform
- 11.1.1. Mobile application
- 11.1.2. Website
- 11.2. Market Analysis, Insights and Forecast - by Mode of booking
- 11.2.1. Third party online portals
- 11.2.2. Direct/captive portals
- 11.1. Market Analysis, Insights and Forecast - by Platform
- 12. Competitive Analysis
- 12.1. Company Profiles
- 12.1.1 Trivago
- 12.1.1.1. Company Overview
- 12.1.1.2. Products
- 12.1.1.3. Company Financials
- 12.1.1.4. SWOT Analysis
- 12.1.2 TripAdvisor
- 12.1.2.1. Company Overview
- 12.1.2.2. Products
- 12.1.2.3. Company Financials
- 12.1.2.4. SWOT Analysis
- 12.1.3 Booking com
- 12.1.3.1. Company Overview
- 12.1.3.2. Products
- 12.1.3.3. Company Financials
- 12.1.3.4. SWOT Analysis
- 12.1.4 HRS Gmbh
- 12.1.4.1. Company Overview
- 12.1.4.2. Products
- 12.1.4.3. Company Financials
- 12.1.4.4. SWOT Analysis
- 12.1.5 Oravel stays
- 12.1.5.1. Company Overview
- 12.1.5.2. Products
- 12.1.5.3. Company Financials
- 12.1.5.4. SWOT Analysis
- 12.1.6 AirBnb
- 12.1.6.1. Company Overview
- 12.1.6.2. Products
- 12.1.6.3. Company Financials
- 12.1.6.4. SWOT Analysis
- 12.1.7 AccorHotels
- 12.1.7.1. Company Overview
- 12.1.7.2. Products
- 12.1.7.3. Company Financials
- 12.1.7.4. SWOT Analysis
- 12.1.8 Agoda**List Not Exhaustive
- 12.1.8.1. Company Overview
- 12.1.8.2. Products
- 12.1.8.3. Company Financials
- 12.1.8.4. SWOT Analysis
- 12.1.9 Hotels com
- 12.1.9.1. Company Overview
- 12.1.9.2. Products
- 12.1.9.3. Company Financials
- 12.1.9.4. SWOT Analysis
- 12.1.10 Expedia
- 12.1.10.1. Company Overview
- 12.1.10.2. Products
- 12.1.10.3. Company Financials
- 12.1.10.4. SWOT Analysis
- 12.1.11 OUI sncf
- 12.1.11.1. Company Overview
- 12.1.11.2. Products
- 12.1.11.3. Company Financials
- 12.1.11.4. SWOT Analysis
- 12.1.1 Trivago
- 12.2. Market Entropy
- 12.2.1 Company's Key Areas Served
- 12.2.2 Recent Developments
- 12.3. Company Market Share Analysis 2025
- 12.3.1 Top 5 Companies Market Share Analysis
- 12.3.2 Top 3 Companies Market Share Analysis
- 12.4. List of Potential Customers
- 13. Research Methodology
List of Figures
- Figure 1: Global Travel Accommodation Market Revenue Breakdown (billion, %) by Region 2025 & 2033
- Figure 2: North America Travel Accommodation Market Revenue (billion), by Platform 2025 & 2033
- Figure 3: North America Travel Accommodation Market Revenue Share (%), by Platform 2025 & 2033
- Figure 4: North America Travel Accommodation Market Revenue (billion), by Mode of booking 2025 & 2033
- Figure 5: North America Travel Accommodation Market Revenue Share (%), by Mode of booking 2025 & 2033
- Figure 6: North America Travel Accommodation Market Revenue (billion), by Country 2025 & 2033
- Figure 7: North America Travel Accommodation Market Revenue Share (%), by Country 2025 & 2033
- Figure 8: South America Travel Accommodation Market Revenue (billion), by Platform 2025 & 2033
- Figure 9: South America Travel Accommodation Market Revenue Share (%), by Platform 2025 & 2033
- Figure 10: South America Travel Accommodation Market Revenue (billion), by Mode of booking 2025 & 2033
- Figure 11: South America Travel Accommodation Market Revenue Share (%), by Mode of booking 2025 & 2033
- Figure 12: South America Travel Accommodation Market Revenue (billion), by Country 2025 & 2033
- Figure 13: South America Travel Accommodation Market Revenue Share (%), by Country 2025 & 2033
- Figure 14: Europe Travel Accommodation Market Revenue (billion), by Platform 2025 & 2033
- Figure 15: Europe Travel Accommodation Market Revenue Share (%), by Platform 2025 & 2033
- Figure 16: Europe Travel Accommodation Market Revenue (billion), by Mode of booking 2025 & 2033
- Figure 17: Europe Travel Accommodation Market Revenue Share (%), by Mode of booking 2025 & 2033
- Figure 18: Europe Travel Accommodation Market Revenue (billion), by Country 2025 & 2033
- Figure 19: Europe Travel Accommodation Market Revenue Share (%), by Country 2025 & 2033
- Figure 20: Middle East & Africa Travel Accommodation Market Revenue (billion), by Platform 2025 & 2033
- Figure 21: Middle East & Africa Travel Accommodation Market Revenue Share (%), by Platform 2025 & 2033
- Figure 22: Middle East & Africa Travel Accommodation Market Revenue (billion), by Mode of booking 2025 & 2033
- Figure 23: Middle East & Africa Travel Accommodation Market Revenue Share (%), by Mode of booking 2025 & 2033
- Figure 24: Middle East & Africa Travel Accommodation Market Revenue (billion), by Country 2025 & 2033
- Figure 25: Middle East & Africa Travel Accommodation Market Revenue Share (%), by Country 2025 & 2033
- Figure 26: Asia Pacific Travel Accommodation Market Revenue (billion), by Platform 2025 & 2033
- Figure 27: Asia Pacific Travel Accommodation Market Revenue Share (%), by Platform 2025 & 2033
- Figure 28: Asia Pacific Travel Accommodation Market Revenue (billion), by Mode of booking 2025 & 2033
- Figure 29: Asia Pacific Travel Accommodation Market Revenue Share (%), by Mode of booking 2025 & 2033
- Figure 30: Asia Pacific Travel Accommodation Market Revenue (billion), by Country 2025 & 2033
- Figure 31: Asia Pacific Travel Accommodation Market Revenue Share (%), by Country 2025 & 2033
List of Tables
- Table 1: Global Travel Accommodation Market Revenue billion Forecast, by Platform 2020 & 2033
- Table 2: Global Travel Accommodation Market Revenue billion Forecast, by Mode of booking 2020 & 2033
- Table 3: Global Travel Accommodation Market Revenue billion Forecast, by Region 2020 & 2033
- Table 4: Global Travel Accommodation Market Revenue billion Forecast, by Platform 2020 & 2033
- Table 5: Global Travel Accommodation Market Revenue billion Forecast, by Mode of booking 2020 & 2033
- Table 6: Global Travel Accommodation Market Revenue billion Forecast, by Country 2020 & 2033
- Table 7: United States Travel Accommodation Market Revenue (billion) Forecast, by Application 2020 & 2033
- Table 8: Canada Travel Accommodation Market Revenue (billion) Forecast, by Application 2020 & 2033
- Table 9: Mexico Travel Accommodation Market Revenue (billion) Forecast, by Application 2020 & 2033
- Table 10: Global Travel Accommodation Market Revenue billion Forecast, by Platform 2020 & 2033
- Table 11: Global Travel Accommodation Market Revenue billion Forecast, by Mode of booking 2020 & 2033
- Table 12: Global Travel Accommodation Market Revenue billion Forecast, by Country 2020 & 2033
- Table 13: Brazil Travel Accommodation Market Revenue (billion) Forecast, by Application 2020 & 2033
- Table 14: Argentina Travel Accommodation Market Revenue (billion) Forecast, by Application 2020 & 2033
- Table 15: Rest of South America Travel Accommodation Market Revenue (billion) Forecast, by Application 2020 & 2033
- Table 16: Global Travel Accommodation Market Revenue billion Forecast, by Platform 2020 & 2033
- Table 17: Global Travel Accommodation Market Revenue billion Forecast, by Mode of booking 2020 & 2033
- Table 18: Global Travel Accommodation Market Revenue billion Forecast, by Country 2020 & 2033
- Table 19: United Kingdom Travel Accommodation Market Revenue (billion) Forecast, by Application 2020 & 2033
- Table 20: Germany Travel Accommodation Market Revenue (billion) Forecast, by Application 2020 & 2033
- Table 21: France Travel Accommodation Market Revenue (billion) Forecast, by Application 2020 & 2033
- Table 22: Italy Travel Accommodation Market Revenue (billion) Forecast, by Application 2020 & 2033
- Table 23: Spain Travel Accommodation Market Revenue (billion) Forecast, by Application 2020 & 2033
- Table 24: Russia Travel Accommodation Market Revenue (billion) Forecast, by Application 2020 & 2033
- Table 25: Benelux Travel Accommodation Market Revenue (billion) Forecast, by Application 2020 & 2033
- Table 26: Nordics Travel Accommodation Market Revenue (billion) Forecast, by Application 2020 & 2033
- Table 27: Rest of Europe Travel Accommodation Market Revenue (billion) Forecast, by Application 2020 & 2033
- Table 28: Global Travel Accommodation Market Revenue billion Forecast, by Platform 2020 & 2033
- Table 29: Global Travel Accommodation Market Revenue billion Forecast, by Mode of booking 2020 & 2033
- Table 30: Global Travel Accommodation Market Revenue billion Forecast, by Country 2020 & 2033
- Table 31: Turkey Travel Accommodation Market Revenue (billion) Forecast, by Application 2020 & 2033
- Table 32: Israel Travel Accommodation Market Revenue (billion) Forecast, by Application 2020 & 2033
- Table 33: GCC Travel Accommodation Market Revenue (billion) Forecast, by Application 2020 & 2033
- Table 34: North Africa Travel Accommodation Market Revenue (billion) Forecast, by Application 2020 & 2033
- Table 35: South Africa Travel Accommodation Market Revenue (billion) Forecast, by Application 2020 & 2033
- Table 36: Rest of Middle East & Africa Travel Accommodation Market Revenue (billion) Forecast, by Application 2020 & 2033
- Table 37: Global Travel Accommodation Market Revenue billion Forecast, by Platform 2020 & 2033
- Table 38: Global Travel Accommodation Market Revenue billion Forecast, by Mode of booking 2020 & 2033
- Table 39: Global Travel Accommodation Market Revenue billion Forecast, by Country 2020 & 2033
- Table 40: China Travel Accommodation Market Revenue (billion) Forecast, by Application 2020 & 2033
- Table 41: India Travel Accommodation Market Revenue (billion) Forecast, by Application 2020 & 2033
- Table 42: Japan Travel Accommodation Market Revenue (billion) Forecast, by Application 2020 & 2033
- Table 43: South Korea Travel Accommodation Market Revenue (billion) Forecast, by Application 2020 & 2033
- Table 44: ASEAN Travel Accommodation Market Revenue (billion) Forecast, by Application 2020 & 2033
- Table 45: Oceania Travel Accommodation Market Revenue (billion) Forecast, by Application 2020 & 2033
- Table 46: Rest of Asia Pacific Travel Accommodation Market Revenue (billion) Forecast, by Application 2020 & 2033
Frequently Asked Questions
1. What is the projected Compound Annual Growth Rate (CAGR) of the Travel Accommodation Market?
The projected CAGR is approximately 9.56%.
2. Which companies are prominent players in the Travel Accommodation Market?
Key companies in the market include Trivago, TripAdvisor, Booking com, HRS Gmbh, Oravel stays, AirBnb, AccorHotels, Agoda**List Not Exhaustive, Hotels com, Expedia, OUI sncf.
3. What are the main segments of the Travel Accommodation Market?
The market segments include Platform, Mode of booking.
4. Can you provide details about the market size?
The market size is estimated to be USD 961.6 billion as of 2022.
5. What are some drivers contributing to market growth?
Health and Wellness Trends is Driving the Market; Cultural Exploration is Driving the Market.
6. What are the notable trends driving market growth?
Rising Internet Usage Pushing Customers Towards Online Accommodation in France..
7. Are there any restraints impacting market growth?
Long-Distances are Physically Demanding which in return Restraining the Market.
8. Can you provide examples of recent developments in the market?
N/A
9. What pricing options are available for accessing the report?
Pricing options include single-user, multi-user, and enterprise licenses priced at USD 3800, USD 4500, and USD 5800 respectively.
10. Is the market size provided in terms of value or volume?
The market size is provided in terms of value, measured in billion.
11. Are there any specific market keywords associated with the report?
Yes, the market keyword associated with the report is "Travel Accommodation Market," which aids in identifying and referencing the specific market segment covered.
12. How do I determine which pricing option suits my needs best?
The pricing options vary based on user requirements and access needs. Individual users may opt for single-user licenses, while businesses requiring broader access may choose multi-user or enterprise licenses for cost-effective access to the report.
13. Are there any additional resources or data provided in the Travel Accommodation Market report?
While the report offers comprehensive insights, it's advisable to review the specific contents or supplementary materials provided to ascertain if additional resources or data are available.
14. How can I stay updated on further developments or reports in the Travel Accommodation Market?
To stay informed about further developments, trends, and reports in the Travel Accommodation Market, consider subscribing to industry newsletters, following relevant companies and organizations, or regularly checking reputable industry news sources and publications.
Methodology
Step 1 - Identification of Relevant Samples Size from Population Database


Step 2 - Approaches for Defining Global Market Size (Value, Volume* & Price*)

Note*: In applicable scenarios
Step 3 - Data Sources
Primary Research
- Web Analytics
- Survey Reports
- Research Institute
- Latest Research Reports
- Opinion Leaders
Secondary Research
- Annual Reports
- White Paper
- Latest Press Release
- Industry Association
- Paid Database
- Investor Presentations

Step 4 - Data Triangulation
Involves using different sources of information in order to increase the validity of a study
These sources are likely to be stakeholders in a program - participants, other researchers, program staff, other community members, and so on.
Then we put all data in single framework & apply various statistical tools to find out the dynamic on the market.
During the analysis stage, feedback from the stakeholder groups would be compared to determine areas of agreement as well as areas of divergence