

Key Insights
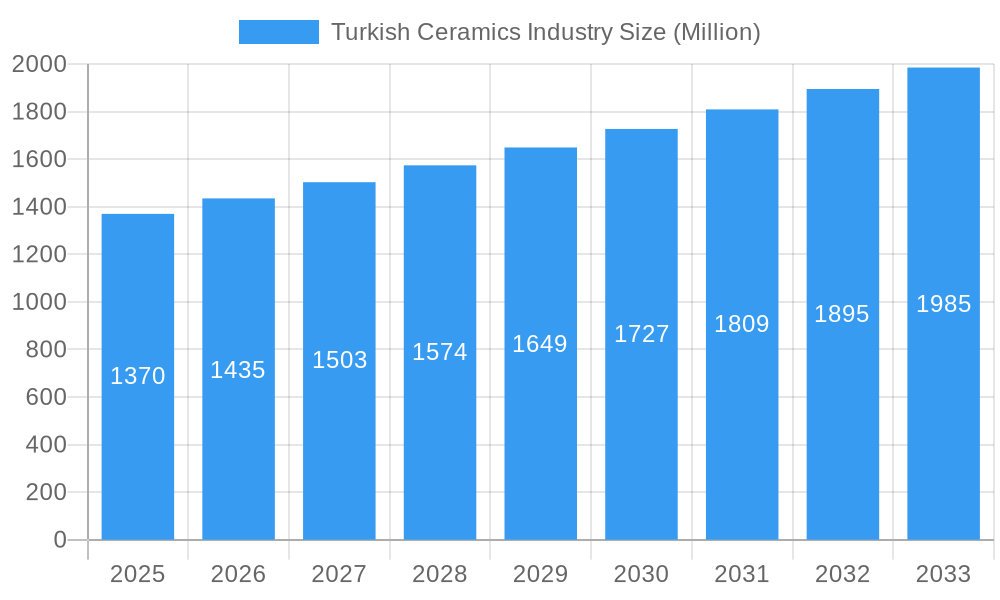
The Turkish ceramics industry, boasting a market size of $1.37 billion in 2025, is projected to experience robust growth, driven by a compound annual growth rate (CAGR) of 4.55% from 2025 to 2033. This expansion is fueled by several key factors. Firstly, the increasing popularity of ceramic tiles in both residential and commercial construction projects, particularly in renovation and replacement segments, significantly boosts demand. The trend towards aesthetically pleasing and durable flooring and wall solutions is further amplified by rising disposable incomes and a preference for modern design in many regions. Secondly, innovations in product technology, such as the development of scratch-free and glazed porcelain tiles, are catering to consumer preferences for high-quality, low-maintenance materials. This leads to increased product differentiation and higher average selling prices, contributing to market growth. Furthermore, the strategic expansion of Turkish ceramics manufacturers into international markets, particularly in Europe, Asia-Pacific, and North America, leverages global construction growth. However, challenges remain. Fluctuations in raw material prices and global economic instability pose potential restraints on growth. Competition from other building material alternatives, such as engineered stone and vinyl flooring, also needs consideration. The industry's success will depend on adapting to evolving consumer tastes, embracing sustainable manufacturing practices, and effectively navigating the global economic landscape. Specific regional growth will vary, with emerging markets like those in Asia-Pacific potentially demonstrating faster expansion compared to more mature markets in Europe or North America. The dominance of established players like Kale Group and VitrA, while providing stability, also highlights the need for smaller players to differentiate their offerings and secure market share.
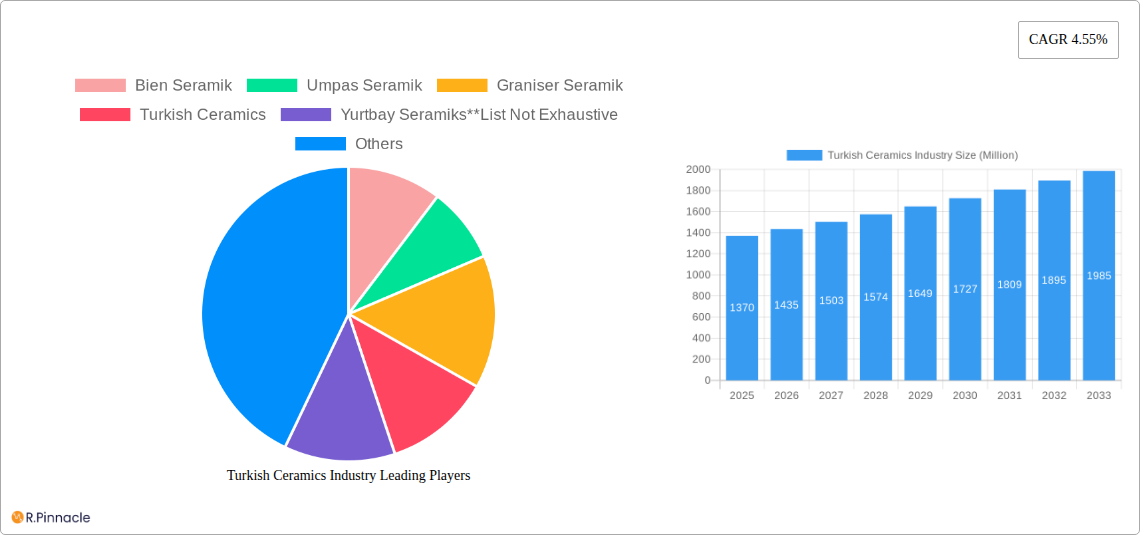
Turkish Ceramics Industry Market Size (In Billion)
The segmentation within the Turkish ceramics market reveals significant opportunities. The residential sector continues to be the largest end-user, followed by commercial construction. The product segment is broadly characterized by a strong demand for glazed and porcelain tiles, reflecting preferences for ease of maintenance and aesthetic appeal. New construction remains a significant driver, yet the renovation and replacement segments are showing increasing growth potential, especially in developed economies undergoing refurbishment projects. The geographic distribution of sales shows varying levels of penetration in different regions; North America and Europe represent relatively mature markets, while regions in Asia-Pacific and the Middle East and Africa present opportunities for future expansion due to infrastructure development and growing urbanization. Therefore, continued growth will hinge upon effective marketing strategies targeting diverse segments, innovation in product design and functionality, and a strategic management of the supply chain to mitigate raw material price volatility.
Turkish Ceramics Industry Company Market Share
Turkish Ceramics Industry: Market Report 2019-2033
This comprehensive report provides an in-depth analysis of the Turkish ceramics industry, covering market structure, dynamics, leading players, and future prospects. With a study period spanning 2019-2033, a base year of 2025, and a forecast period of 2025-2033, this report is an essential resource for industry professionals, investors, and anyone seeking to understand this dynamic market. The report leverages extensive data and analysis to provide actionable insights and strategic recommendations. The total market size is estimated at xx Million in 2025.
Turkish Ceramics Industry Market Structure & Innovation Trends
The Turkish ceramics industry exhibits a moderately concentrated market structure, with key players like Kale Group, VitrA, and Seramiksan holding significant market share. However, numerous smaller and medium-sized enterprises (SMEs) also contribute substantially. The industry is driven by continuous innovation in product design, material technology, and manufacturing processes. Regulatory frameworks, primarily focused on environmental sustainability and product safety, influence manufacturing practices. Product substitutes, such as other flooring materials (e.g., wood, vinyl), pose a competitive challenge. End-user demographics show a growing preference for high-quality, aesthetically pleasing, and durable ceramic tiles, particularly in residential and commercial construction. M&A activity in the sector has been moderate, with deal values typically ranging from xx Million to xx Million. Key metrics include:
- Market Concentration: High concentration amongst top players (Kale Group, VitrA, Seramiksan) estimated at xx%.
- M&A Deal Value (2019-2024): Total value estimated at xx Million.
- Average Market Share of Top 3 Players: xx%.
Turkish Ceramics Industry Market Dynamics & Trends
The Turkish ceramics market is experiencing robust growth, driven by factors such as increasing construction activity, rising disposable incomes, and a growing preference for aesthetically pleasing and durable flooring solutions. Technological disruptions, such as advancements in digital printing and 3D modeling, are enhancing product design and customization. Consumer preferences are shifting towards eco-friendly and sustainable products, demanding innovation in manufacturing processes. Competitive dynamics are characterized by price competition, product differentiation, and brand building. Key trends include:
- CAGR (2025-2033): Estimated at xx%.
- Market Penetration of Porcelain Tiles: Expected to increase to xx% by 2033.
- Growing Demand for Large-Format Tiles: This is driven by contemporary architectural trends.
Dominant Regions & Segments in Turkish Ceramics Industry
The dominant region for the Turkish ceramics industry is the Marmara region, benefiting from its established manufacturing infrastructure and proximity to key markets. Amongst segments:
- By Application: Floor tiles dominate the market share, accounting for approximately xx Million, followed by wall tiles and other applications. Key drivers include construction growth and renovation projects.
- By Construction Type: New construction projects represent the largest segment, driven by urbanization and infrastructure development. Renovation projects are a growing segment, fueled by increasing disposable incomes.
- By End-User: Residential applications lead the market, with xx Million in estimated value, due to increased housing demand. However, the commercial segment is also significant, driven by infrastructural and commercial developments.
- By Product: Porcelain tiles hold the largest market share due to their superior durability and aesthetics, with an estimated market value of xx Million.
Turkish Ceramics Industry Product Innovations
Recent years have witnessed significant advancements in ceramic tile technology. New collections feature improved durability, scratch resistance, and aesthetically advanced designs. The focus is on environmentally friendly production methods, incorporating recycled materials and reducing water consumption. The integration of digital printing technology allows for highly customized designs. These innovations align with evolving market demand for sustainable and aesthetically superior products, enhancing the competitive advantage of leading players.
Report Scope & Segmentation Analysis
This report provides a comprehensive analysis of the Turkish ceramics market, segmented by application (floor tiles, wall tiles, other applications), construction type (new construction, replacement, renovation), end-user (residential, commercial), and product type (glazed, porcelain, scratch-free, other). Each segment's market size, growth projections, and competitive dynamics are thoroughly examined. For instance, the floor tile segment is projected to grow at a xx% CAGR during the forecast period due to the increasing demand for new residential and commercial buildings. The porcelain tile segment is expected to witness substantial growth due to its superior features.
Key Drivers of Turkish Ceramics Industry Growth
The Turkish ceramics industry’s growth is driven by several factors: rising construction activity fueled by government infrastructure projects and increasing urbanization; a growing preference for aesthetically appealing and durable ceramic tiles; technological advancements in tile production and design; and supportive government policies aimed at promoting the domestic manufacturing sector.
Challenges in the Turkish Ceramics Industry Sector
The Turkish ceramics industry faces challenges including fluctuations in raw material prices, intense competition, particularly from international players; and environmental regulations that impact production costs. Energy price volatility, especially natural gas, also significantly impacts operating expenses.
Emerging Opportunities in Turkish Ceramics Industry
Emerging opportunities include the growing demand for sustainable and eco-friendly tiles, the expansion into new export markets (especially in Europe and the Middle East), and the development of innovative product designs incorporating smart technologies.
Leading Players in the Turkish Ceramics Industry Market
- Bien Seramik
- Umpas Seramik
- Graniser Seramik
- Turkish Ceramics
- Yurtbay Seramiks
- Ege Seramik
- Akgun Seramik
- NG Kutahya Seramik
- Seramiksan
- Kale Group
- VitrA
Key Developments in Turkish Ceramics Industry
- 2023 (Q1): VitrA launched a new tile collection inspired by nature, featuring integrated systems and a material library.
- 2023 (Q2): Kale Group introduced a new range of ceramic tiles in various colors and sizes (60x120 and 80x80), including Royal Marbles Silver River Dark Porcelain Tile and Silverstone Matte Beige Rock Surface Porcelain Tile.
Future Outlook for Turkish Ceramics Industry Market
The Turkish ceramics industry is poised for continued growth, driven by ongoing urbanization, infrastructure development, and increasing consumer demand for high-quality tiles. Strategic opportunities lie in technological innovation, sustainable manufacturing practices, and expanding into international markets. The industry's future success will depend on adaptability, innovation, and effective management of both environmental and economic challenges.
Turkish Ceramics Industry Segmentation
- 1. Production Analysis
- 2. Consumption Analysis
- 3. Import Market Analysis (Value & Volume)
- 4. Export Market Analysis (Value & Volume)
- 5. Price Trend Analysis
Turkish Ceramics Industry Segmentation By Geography
-
1. North America
- 1.1. United States
- 1.2. Canada
- 1.3. Mexico
-
2. South America
- 2.1. Brazil
- 2.2. Argentina
- 2.3. Rest of South America
-
3. Europe
- 3.1. United Kingdom
- 3.2. Germany
- 3.3. France
- 3.4. Italy
- 3.5. Spain
- 3.6. Russia
- 3.7. Benelux
- 3.8. Nordics
- 3.9. Rest of Europe
-
4. Middle East & Africa
- 4.1. Turkey
- 4.2. Israel
- 4.3. GCC
- 4.4. North Africa
- 4.5. South Africa
- 4.6. Rest of Middle East & Africa
-
5. Asia Pacific
- 5.1. China
- 5.2. India
- 5.3. Japan
- 5.4. South Korea
- 5.5. ASEAN
- 5.6. Oceania
- 5.7. Rest of Asia Pacific
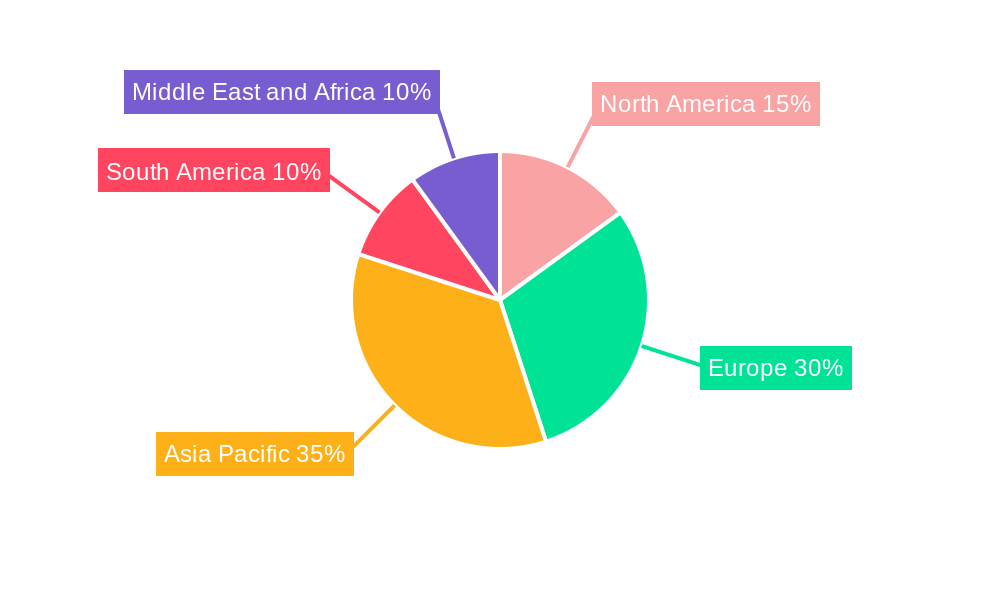
Turkish Ceramics Industry Regional Market Share
Geographic Coverage of Turkish Ceramics Industry
Turkish Ceramics Industry REPORT HIGHLIGHTS
| Aspects | Details |
|---|---|
| Study Period | 2020-2034 |
| Base Year | 2025 |
| Estimated Year | 2026 |
| Forecast Period | 2026-2034 |
| Historical Period | 2020-2025 |
| Growth Rate | CAGR of 4.55% from 2020-2034 |
| Segmentation |
|
Table of Contents
- 1. Introduction
- 1.1. Research Scope
- 1.2. Market Segmentation
- 1.3. Research Objective
- 1.4. Definitions and Assumptions
- 2. Executive Summary
- 2.1. Market Snapshot
- 3. Market Dynamics
- 3.1. Market Drivers
- 3.2. Market Restrains
- 3.3. Market Trends
- 3.4. Market Opportunities
- 4. Market Factor Analysis
- 4.1. Porters Five Forces
- 4.1.1. Bargaining Power of Suppliers
- 4.1.2. Bargaining Power of Buyers
- 4.1.3. Threat of New Entrants
- 4.1.4. Threat of Substitutes
- 4.1.5. Competitive Rivalry
- 4.2. PESTEL analysis
- 4.3. BCG Analysis
- 4.3.1. Stars (High Growth, High Market Share)
- 4.3.2. Cash Cows (Low Growth, High Market Share)
- 4.3.3. Question Mark (High Growth, Low Market Share)
- 4.3.4. Dogs (Low Growth, Low Market Share)
- 4.4. Ansoff Matrix Analysis
- 4.5. Supply Chain Analysis
- 4.6. Regulatory Landscape
- 4.7. Current Market Potential and Opportunity Assessment (TAM–SAM–SOM Framework)
- 4.8. PRI Analyst Note
- 4.1. Porters Five Forces
- 5. Market Analysis, Insights and Forecast 2021-2033
- 5.1. Market Analysis, Insights and Forecast - by Production Analysis
- 5.2. Market Analysis, Insights and Forecast - by Consumption Analysis
- 5.3. Market Analysis, Insights and Forecast - by Import Market Analysis (Value & Volume)
- 5.4. Market Analysis, Insights and Forecast - by Export Market Analysis (Value & Volume)
- 5.5. Market Analysis, Insights and Forecast - by Price Trend Analysis
- 5.6. Market Analysis, Insights and Forecast - by Region
- 5.6.1. North America
- 5.6.2. South America
- 5.6.3. Europe
- 5.6.4. Middle East & Africa
- 5.6.5. Asia Pacific
- 6. Global Turkish Ceramics Industry Analysis, Insights and Forecast, 2021-2033
- 6.1. Market Analysis, Insights and Forecast - by Production Analysis
- 6.2. Market Analysis, Insights and Forecast - by Consumption Analysis
- 6.3. Market Analysis, Insights and Forecast - by Import Market Analysis (Value & Volume)
- 6.4. Market Analysis, Insights and Forecast - by Export Market Analysis (Value & Volume)
- 6.5. Market Analysis, Insights and Forecast - by Price Trend Analysis
- 7. North America Turkish Ceramics Industry Analysis, Insights and Forecast, 2020-2032
- 7.1. Market Analysis, Insights and Forecast - by Production Analysis
- 7.2. Market Analysis, Insights and Forecast - by Consumption Analysis
- 7.3. Market Analysis, Insights and Forecast - by Import Market Analysis (Value & Volume)
- 7.4. Market Analysis, Insights and Forecast - by Export Market Analysis (Value & Volume)
- 7.5. Market Analysis, Insights and Forecast - by Price Trend Analysis
- 8. South America Turkish Ceramics Industry Analysis, Insights and Forecast, 2020-2032
- 8.1. Market Analysis, Insights and Forecast - by Production Analysis
- 8.2. Market Analysis, Insights and Forecast - by Consumption Analysis
- 8.3. Market Analysis, Insights and Forecast - by Import Market Analysis (Value & Volume)
- 8.4. Market Analysis, Insights and Forecast - by Export Market Analysis (Value & Volume)
- 8.5. Market Analysis, Insights and Forecast - by Price Trend Analysis
- 9. Europe Turkish Ceramics Industry Analysis, Insights and Forecast, 2020-2032
- 9.1. Market Analysis, Insights and Forecast - by Production Analysis
- 9.2. Market Analysis, Insights and Forecast - by Consumption Analysis
- 9.3. Market Analysis, Insights and Forecast - by Import Market Analysis (Value & Volume)
- 9.4. Market Analysis, Insights and Forecast - by Export Market Analysis (Value & Volume)
- 9.5. Market Analysis, Insights and Forecast - by Price Trend Analysis
- 10. Middle East & Africa Turkish Ceramics Industry Analysis, Insights and Forecast, 2020-2032
- 10.1. Market Analysis, Insights and Forecast - by Production Analysis
- 10.2. Market Analysis, Insights and Forecast - by Consumption Analysis
- 10.3. Market Analysis, Insights and Forecast - by Import Market Analysis (Value & Volume)
- 10.4. Market Analysis, Insights and Forecast - by Export Market Analysis (Value & Volume)
- 10.5. Market Analysis, Insights and Forecast - by Price Trend Analysis
- 11. Asia Pacific Turkish Ceramics Industry Analysis, Insights and Forecast, 2020-2032
- 11.1. Market Analysis, Insights and Forecast - by Production Analysis
- 11.2. Market Analysis, Insights and Forecast - by Consumption Analysis
- 11.3. Market Analysis, Insights and Forecast - by Import Market Analysis (Value & Volume)
- 11.4. Market Analysis, Insights and Forecast - by Export Market Analysis (Value & Volume)
- 11.5. Market Analysis, Insights and Forecast - by Price Trend Analysis
- 12. Competitive Analysis
- 12.1. Company Profiles
- 12.1.1 Bien Seramik
- 12.1.1.1. Company Overview
- 12.1.1.2. Products
- 12.1.1.3. Company Financials
- 12.1.1.4. SWOT Analysis
- 12.1.2 Umpas Seramik
- 12.1.2.1. Company Overview
- 12.1.2.2. Products
- 12.1.2.3. Company Financials
- 12.1.2.4. SWOT Analysis
- 12.1.3 Graniser Seramik
- 12.1.3.1. Company Overview
- 12.1.3.2. Products
- 12.1.3.3. Company Financials
- 12.1.3.4. SWOT Analysis
- 12.1.4 Turkish Ceramics
- 12.1.4.1. Company Overview
- 12.1.4.2. Products
- 12.1.4.3. Company Financials
- 12.1.4.4. SWOT Analysis
- 12.1.5 Yurtbay Seramiks**List Not Exhaustive
- 12.1.5.1. Company Overview
- 12.1.5.2. Products
- 12.1.5.3. Company Financials
- 12.1.5.4. SWOT Analysis
- 12.1.6 Ege Seramik
- 12.1.6.1. Company Overview
- 12.1.6.2. Products
- 12.1.6.3. Company Financials
- 12.1.6.4. SWOT Analysis
- 12.1.7 Akgun Seramik
- 12.1.7.1. Company Overview
- 12.1.7.2. Products
- 12.1.7.3. Company Financials
- 12.1.7.4. SWOT Analysis
- 12.1.8 NG Kutahya Seramik
- 12.1.8.1. Company Overview
- 12.1.8.2. Products
- 12.1.8.3. Company Financials
- 12.1.8.4. SWOT Analysis
- 12.1.9 Seramiksan
- 12.1.9.1. Company Overview
- 12.1.9.2. Products
- 12.1.9.3. Company Financials
- 12.1.9.4. SWOT Analysis
- 12.1.10 Kale Group
- 12.1.10.1. Company Overview
- 12.1.10.2. Products
- 12.1.10.3. Company Financials
- 12.1.10.4. SWOT Analysis
- 12.1.11 VitrA
- 12.1.11.1. Company Overview
- 12.1.11.2. Products
- 12.1.11.3. Company Financials
- 12.1.11.4. SWOT Analysis
- 12.1.1 Bien Seramik
- 12.2. Market Entropy
- 12.2.1 Company's Key Areas Served
- 12.2.2 Recent Developments
- 12.3. Company Market Share Analysis 2025
- 12.3.1 Top 5 Companies Market Share Analysis
- 12.3.2 Top 3 Companies Market Share Analysis
- 12.4. List of Potential Customers
- 13. Research Methodology
List of Figures
- Figure 1: Global Turkish Ceramics Industry Revenue Breakdown (Million, %) by Region 2025 & 2033
- Figure 2: North America Turkish Ceramics Industry Revenue (Million), by Production Analysis 2025 & 2033
- Figure 3: North America Turkish Ceramics Industry Revenue Share (%), by Production Analysis 2025 & 2033
- Figure 4: North America Turkish Ceramics Industry Revenue (Million), by Consumption Analysis 2025 & 2033
- Figure 5: North America Turkish Ceramics Industry Revenue Share (%), by Consumption Analysis 2025 & 2033
- Figure 6: North America Turkish Ceramics Industry Revenue (Million), by Import Market Analysis (Value & Volume) 2025 & 2033
- Figure 7: North America Turkish Ceramics Industry Revenue Share (%), by Import Market Analysis (Value & Volume) 2025 & 2033
- Figure 8: North America Turkish Ceramics Industry Revenue (Million), by Export Market Analysis (Value & Volume) 2025 & 2033
- Figure 9: North America Turkish Ceramics Industry Revenue Share (%), by Export Market Analysis (Value & Volume) 2025 & 2033
- Figure 10: North America Turkish Ceramics Industry Revenue (Million), by Price Trend Analysis 2025 & 2033
- Figure 11: North America Turkish Ceramics Industry Revenue Share (%), by Price Trend Analysis 2025 & 2033
- Figure 12: North America Turkish Ceramics Industry Revenue (Million), by Country 2025 & 2033
- Figure 13: North America Turkish Ceramics Industry Revenue Share (%), by Country 2025 & 2033
- Figure 14: South America Turkish Ceramics Industry Revenue (Million), by Production Analysis 2025 & 2033
- Figure 15: South America Turkish Ceramics Industry Revenue Share (%), by Production Analysis 2025 & 2033
- Figure 16: South America Turkish Ceramics Industry Revenue (Million), by Consumption Analysis 2025 & 2033
- Figure 17: South America Turkish Ceramics Industry Revenue Share (%), by Consumption Analysis 2025 & 2033
- Figure 18: South America Turkish Ceramics Industry Revenue (Million), by Import Market Analysis (Value & Volume) 2025 & 2033
- Figure 19: South America Turkish Ceramics Industry Revenue Share (%), by Import Market Analysis (Value & Volume) 2025 & 2033
- Figure 20: South America Turkish Ceramics Industry Revenue (Million), by Export Market Analysis (Value & Volume) 2025 & 2033
- Figure 21: South America Turkish Ceramics Industry Revenue Share (%), by Export Market Analysis (Value & Volume) 2025 & 2033
- Figure 22: South America Turkish Ceramics Industry Revenue (Million), by Price Trend Analysis 2025 & 2033
- Figure 23: South America Turkish Ceramics Industry Revenue Share (%), by Price Trend Analysis 2025 & 2033
- Figure 24: South America Turkish Ceramics Industry Revenue (Million), by Country 2025 & 2033
- Figure 25: South America Turkish Ceramics Industry Revenue Share (%), by Country 2025 & 2033
- Figure 26: Europe Turkish Ceramics Industry Revenue (Million), by Production Analysis 2025 & 2033
- Figure 27: Europe Turkish Ceramics Industry Revenue Share (%), by Production Analysis 2025 & 2033
- Figure 28: Europe Turkish Ceramics Industry Revenue (Million), by Consumption Analysis 2025 & 2033
- Figure 29: Europe Turkish Ceramics Industry Revenue Share (%), by Consumption Analysis 2025 & 2033
- Figure 30: Europe Turkish Ceramics Industry Revenue (Million), by Import Market Analysis (Value & Volume) 2025 & 2033
- Figure 31: Europe Turkish Ceramics Industry Revenue Share (%), by Import Market Analysis (Value & Volume) 2025 & 2033
- Figure 32: Europe Turkish Ceramics Industry Revenue (Million), by Export Market Analysis (Value & Volume) 2025 & 2033
- Figure 33: Europe Turkish Ceramics Industry Revenue Share (%), by Export Market Analysis (Value & Volume) 2025 & 2033
- Figure 34: Europe Turkish Ceramics Industry Revenue (Million), by Price Trend Analysis 2025 & 2033
- Figure 35: Europe Turkish Ceramics Industry Revenue Share (%), by Price Trend Analysis 2025 & 2033
- Figure 36: Europe Turkish Ceramics Industry Revenue (Million), by Country 2025 & 2033
- Figure 37: Europe Turkish Ceramics Industry Revenue Share (%), by Country 2025 & 2033
- Figure 38: Middle East & Africa Turkish Ceramics Industry Revenue (Million), by Production Analysis 2025 & 2033
- Figure 39: Middle East & Africa Turkish Ceramics Industry Revenue Share (%), by Production Analysis 2025 & 2033
- Figure 40: Middle East & Africa Turkish Ceramics Industry Revenue (Million), by Consumption Analysis 2025 & 2033
- Figure 41: Middle East & Africa Turkish Ceramics Industry Revenue Share (%), by Consumption Analysis 2025 & 2033
- Figure 42: Middle East & Africa Turkish Ceramics Industry Revenue (Million), by Import Market Analysis (Value & Volume) 2025 & 2033
- Figure 43: Middle East & Africa Turkish Ceramics Industry Revenue Share (%), by Import Market Analysis (Value & Volume) 2025 & 2033
- Figure 44: Middle East & Africa Turkish Ceramics Industry Revenue (Million), by Export Market Analysis (Value & Volume) 2025 & 2033
- Figure 45: Middle East & Africa Turkish Ceramics Industry Revenue Share (%), by Export Market Analysis (Value & Volume) 2025 & 2033
- Figure 46: Middle East & Africa Turkish Ceramics Industry Revenue (Million), by Price Trend Analysis 2025 & 2033
- Figure 47: Middle East & Africa Turkish Ceramics Industry Revenue Share (%), by Price Trend Analysis 2025 & 2033
- Figure 48: Middle East & Africa Turkish Ceramics Industry Revenue (Million), by Country 2025 & 2033
- Figure 49: Middle East & Africa Turkish Ceramics Industry Revenue Share (%), by Country 2025 & 2033
- Figure 50: Asia Pacific Turkish Ceramics Industry Revenue (Million), by Production Analysis 2025 & 2033
- Figure 51: Asia Pacific Turkish Ceramics Industry Revenue Share (%), by Production Analysis 2025 & 2033
- Figure 52: Asia Pacific Turkish Ceramics Industry Revenue (Million), by Consumption Analysis 2025 & 2033
- Figure 53: Asia Pacific Turkish Ceramics Industry Revenue Share (%), by Consumption Analysis 2025 & 2033
- Figure 54: Asia Pacific Turkish Ceramics Industry Revenue (Million), by Import Market Analysis (Value & Volume) 2025 & 2033
- Figure 55: Asia Pacific Turkish Ceramics Industry Revenue Share (%), by Import Market Analysis (Value & Volume) 2025 & 2033
- Figure 56: Asia Pacific Turkish Ceramics Industry Revenue (Million), by Export Market Analysis (Value & Volume) 2025 & 2033
- Figure 57: Asia Pacific Turkish Ceramics Industry Revenue Share (%), by Export Market Analysis (Value & Volume) 2025 & 2033
- Figure 58: Asia Pacific Turkish Ceramics Industry Revenue (Million), by Price Trend Analysis 2025 & 2033
- Figure 59: Asia Pacific Turkish Ceramics Industry Revenue Share (%), by Price Trend Analysis 2025 & 2033
- Figure 60: Asia Pacific Turkish Ceramics Industry Revenue (Million), by Country 2025 & 2033
- Figure 61: Asia Pacific Turkish Ceramics Industry Revenue Share (%), by Country 2025 & 2033
List of Tables
- Table 1: Global Turkish Ceramics Industry Revenue Million Forecast, by Production Analysis 2020 & 2033
- Table 2: Global Turkish Ceramics Industry Revenue Million Forecast, by Consumption Analysis 2020 & 2033
- Table 3: Global Turkish Ceramics Industry Revenue Million Forecast, by Import Market Analysis (Value & Volume) 2020 & 2033
- Table 4: Global Turkish Ceramics Industry Revenue Million Forecast, by Export Market Analysis (Value & Volume) 2020 & 2033
- Table 5: Global Turkish Ceramics Industry Revenue Million Forecast, by Price Trend Analysis 2020 & 2033
- Table 6: Global Turkish Ceramics Industry Revenue Million Forecast, by Region 2020 & 2033
- Table 7: Global Turkish Ceramics Industry Revenue Million Forecast, by Production Analysis 2020 & 2033
- Table 8: Global Turkish Ceramics Industry Revenue Million Forecast, by Consumption Analysis 2020 & 2033
- Table 9: Global Turkish Ceramics Industry Revenue Million Forecast, by Import Market Analysis (Value & Volume) 2020 & 2033
- Table 10: Global Turkish Ceramics Industry Revenue Million Forecast, by Export Market Analysis (Value & Volume) 2020 & 2033
- Table 11: Global Turkish Ceramics Industry Revenue Million Forecast, by Price Trend Analysis 2020 & 2033
- Table 12: Global Turkish Ceramics Industry Revenue Million Forecast, by Country 2020 & 2033
- Table 13: United States Turkish Ceramics Industry Revenue (Million) Forecast, by Application 2020 & 2033
- Table 14: Canada Turkish Ceramics Industry Revenue (Million) Forecast, by Application 2020 & 2033
- Table 15: Mexico Turkish Ceramics Industry Revenue (Million) Forecast, by Application 2020 & 2033
- Table 16: Global Turkish Ceramics Industry Revenue Million Forecast, by Production Analysis 2020 & 2033
- Table 17: Global Turkish Ceramics Industry Revenue Million Forecast, by Consumption Analysis 2020 & 2033
- Table 18: Global Turkish Ceramics Industry Revenue Million Forecast, by Import Market Analysis (Value & Volume) 2020 & 2033
- Table 19: Global Turkish Ceramics Industry Revenue Million Forecast, by Export Market Analysis (Value & Volume) 2020 & 2033
- Table 20: Global Turkish Ceramics Industry Revenue Million Forecast, by Price Trend Analysis 2020 & 2033
- Table 21: Global Turkish Ceramics Industry Revenue Million Forecast, by Country 2020 & 2033
- Table 22: Brazil Turkish Ceramics Industry Revenue (Million) Forecast, by Application 2020 & 2033
- Table 23: Argentina Turkish Ceramics Industry Revenue (Million) Forecast, by Application 2020 & 2033
- Table 24: Rest of South America Turkish Ceramics Industry Revenue (Million) Forecast, by Application 2020 & 2033
- Table 25: Global Turkish Ceramics Industry Revenue Million Forecast, by Production Analysis 2020 & 2033
- Table 26: Global Turkish Ceramics Industry Revenue Million Forecast, by Consumption Analysis 2020 & 2033
- Table 27: Global Turkish Ceramics Industry Revenue Million Forecast, by Import Market Analysis (Value & Volume) 2020 & 2033
- Table 28: Global Turkish Ceramics Industry Revenue Million Forecast, by Export Market Analysis (Value & Volume) 2020 & 2033
- Table 29: Global Turkish Ceramics Industry Revenue Million Forecast, by Price Trend Analysis 2020 & 2033
- Table 30: Global Turkish Ceramics Industry Revenue Million Forecast, by Country 2020 & 2033
- Table 31: United Kingdom Turkish Ceramics Industry Revenue (Million) Forecast, by Application 2020 & 2033
- Table 32: Germany Turkish Ceramics Industry Revenue (Million) Forecast, by Application 2020 & 2033
- Table 33: France Turkish Ceramics Industry Revenue (Million) Forecast, by Application 2020 & 2033
- Table 34: Italy Turkish Ceramics Industry Revenue (Million) Forecast, by Application 2020 & 2033
- Table 35: Spain Turkish Ceramics Industry Revenue (Million) Forecast, by Application 2020 & 2033
- Table 36: Russia Turkish Ceramics Industry Revenue (Million) Forecast, by Application 2020 & 2033
- Table 37: Benelux Turkish Ceramics Industry Revenue (Million) Forecast, by Application 2020 & 2033
- Table 38: Nordics Turkish Ceramics Industry Revenue (Million) Forecast, by Application 2020 & 2033
- Table 39: Rest of Europe Turkish Ceramics Industry Revenue (Million) Forecast, by Application 2020 & 2033
- Table 40: Global Turkish Ceramics Industry Revenue Million Forecast, by Production Analysis 2020 & 2033
- Table 41: Global Turkish Ceramics Industry Revenue Million Forecast, by Consumption Analysis 2020 & 2033
- Table 42: Global Turkish Ceramics Industry Revenue Million Forecast, by Import Market Analysis (Value & Volume) 2020 & 2033
- Table 43: Global Turkish Ceramics Industry Revenue Million Forecast, by Export Market Analysis (Value & Volume) 2020 & 2033
- Table 44: Global Turkish Ceramics Industry Revenue Million Forecast, by Price Trend Analysis 2020 & 2033
- Table 45: Global Turkish Ceramics Industry Revenue Million Forecast, by Country 2020 & 2033
- Table 46: Turkey Turkish Ceramics Industry Revenue (Million) Forecast, by Application 2020 & 2033
- Table 47: Israel Turkish Ceramics Industry Revenue (Million) Forecast, by Application 2020 & 2033
- Table 48: GCC Turkish Ceramics Industry Revenue (Million) Forecast, by Application 2020 & 2033
- Table 49: North Africa Turkish Ceramics Industry Revenue (Million) Forecast, by Application 2020 & 2033
- Table 50: South Africa Turkish Ceramics Industry Revenue (Million) Forecast, by Application 2020 & 2033
- Table 51: Rest of Middle East & Africa Turkish Ceramics Industry Revenue (Million) Forecast, by Application 2020 & 2033
- Table 52: Global Turkish Ceramics Industry Revenue Million Forecast, by Production Analysis 2020 & 2033
- Table 53: Global Turkish Ceramics Industry Revenue Million Forecast, by Consumption Analysis 2020 & 2033
- Table 54: Global Turkish Ceramics Industry Revenue Million Forecast, by Import Market Analysis (Value & Volume) 2020 & 2033
- Table 55: Global Turkish Ceramics Industry Revenue Million Forecast, by Export Market Analysis (Value & Volume) 2020 & 2033
- Table 56: Global Turkish Ceramics Industry Revenue Million Forecast, by Price Trend Analysis 2020 & 2033
- Table 57: Global Turkish Ceramics Industry Revenue Million Forecast, by Country 2020 & 2033
- Table 58: China Turkish Ceramics Industry Revenue (Million) Forecast, by Application 2020 & 2033
- Table 59: India Turkish Ceramics Industry Revenue (Million) Forecast, by Application 2020 & 2033
- Table 60: Japan Turkish Ceramics Industry Revenue (Million) Forecast, by Application 2020 & 2033
- Table 61: South Korea Turkish Ceramics Industry Revenue (Million) Forecast, by Application 2020 & 2033
- Table 62: ASEAN Turkish Ceramics Industry Revenue (Million) Forecast, by Application 2020 & 2033
- Table 63: Oceania Turkish Ceramics Industry Revenue (Million) Forecast, by Application 2020 & 2033
- Table 64: Rest of Asia Pacific Turkish Ceramics Industry Revenue (Million) Forecast, by Application 2020 & 2033
Frequently Asked Questions
1. What is the projected Compound Annual Growth Rate (CAGR) of the Turkish Ceramics Industry?
The projected CAGR is approximately 4.55%.
2. Which companies are prominent players in the Turkish Ceramics Industry?
Key companies in the market include Bien Seramik, Umpas Seramik, Graniser Seramik, Turkish Ceramics, Yurtbay Seramiks**List Not Exhaustive, Ege Seramik, Akgun Seramik, NG Kutahya Seramik, Seramiksan, Kale Group, VitrA.
3. What are the main segments of the Turkish Ceramics Industry?
The market segments include Production Analysis, Consumption Analysis, Import Market Analysis (Value & Volume), Export Market Analysis (Value & Volume), Price Trend Analysis.
4. Can you provide details about the market size?
The market size is estimated to be USD 1.37 Million as of 2022.
5. What are some drivers contributing to market growth?
Growth in e-Commerce.
6. What are the notable trends driving market growth?
Rising Construction Activities in Turkey Driving the Market.
7. Are there any restraints impacting market growth?
Counterfeit Products.
8. Can you provide examples of recent developments in the market?
2023: The new tile collection from Vitra is now available in its stores. Customers are urged to go on a daring, vibrant, and a regenerative voyage of discovery with VitrA Tiles' most recent integrated systems and material library, which are inspired by nature and the fundamental circular creativity of life. Wide ranges of ceramic tiles are available.
9. What pricing options are available for accessing the report?
Pricing options include single-user, multi-user, and enterprise licenses priced at USD 3800, USD 4500, and USD 5800 respectively.
10. Is the market size provided in terms of value or volume?
The market size is provided in terms of value, measured in Million.
11. Are there any specific market keywords associated with the report?
Yes, the market keyword associated with the report is "Turkish Ceramics Industry," which aids in identifying and referencing the specific market segment covered.
12. How do I determine which pricing option suits my needs best?
The pricing options vary based on user requirements and access needs. Individual users may opt for single-user licenses, while businesses requiring broader access may choose multi-user or enterprise licenses for cost-effective access to the report.
13. Are there any additional resources or data provided in the Turkish Ceramics Industry report?
While the report offers comprehensive insights, it's advisable to review the specific contents or supplementary materials provided to ascertain if additional resources or data are available.
14. How can I stay updated on further developments or reports in the Turkish Ceramics Industry?
To stay informed about further developments, trends, and reports in the Turkish Ceramics Industry, consider subscribing to industry newsletters, following relevant companies and organizations, or regularly checking reputable industry news sources and publications.
Methodology
Step 1 - Identification of Relevant Samples Size from Population Database


Step 2 - Approaches for Defining Global Market Size (Value, Volume* & Price*)

Note*: In applicable scenarios
Step 3 - Data Sources
Primary Research
- Web Analytics
- Survey Reports
- Research Institute
- Latest Research Reports
- Opinion Leaders
Secondary Research
- Annual Reports
- White Paper
- Latest Press Release
- Industry Association
- Paid Database
- Investor Presentations

Step 4 - Data Triangulation
Involves using different sources of information in order to increase the validity of a study
These sources are likely to be stakeholders in a program - participants, other researchers, program staff, other community members, and so on.
Then we put all data in single framework & apply various statistical tools to find out the dynamic on the market.
During the analysis stage, feedback from the stakeholder groups would be compared to determine areas of agreement as well as areas of divergence